

 PDF
PDF ePub
ePub Citation
 Print
Print


The number of cases of lung cancer is increasing year by year, so screening for this malady has become popular in advanced countries (1). The detection of lung cancer at an early stage is very important to cure it; however, it is very difficult for radiologists to detect and to diagnose lung cancer on chest x-ray images because of following reasons.
There are many tissues that overlap each other on chest radiographs. The presence of cancerous tumors is obscured by the overlying ribs, bronchia, blood vessels and other normal anatomic structures. The shadows of cancerous tumors seen on chest radiograph are usually vague and subtle, and they tend to be missed. The development of a reliable computer aided diagnosis (CAD) system for lung cancer is one of the most important research topics in the area of medical image processing.
Various CAD methods have been proposed to detect lung nodules. Giger et al. (2) detected nodules using multiple gray-level thresholding and a rule-based approach. Armato et al. (3) introduced some 3D features, and they performed feature analysis by using a Linear Discriminant Analysis (LDA) classifier. Kanazawa et al. (4) used fuzzy clustering and a rule-based method. Penedo et al. (5) set up 2 Neural Networks (NNs), with the first one detecting the suspected areas, and the second one acting as a classifier. Xu et al. (6) described a system which, following proper radiogram preprocessing, utilizes a set of decision rules and a feed forward neural network to determine the nodular patterns. Following a different approach, Lo et al. (7) proposed a two-stage system: the first one locates possible nodular patterns (thus performing a sort of attention focusing process) while the second, implemented by a convolutional neural network, discriminates nodules from non-nodules. A prior model was developed by Brown et al. (8) to find nodules on the baseline scan and to locate nodules on the follow up scans.
Several template-based methods have also been used to detect nodules. Betke et al. (9) proposed a system to detect anatomical landmarks, and in particular, the trachea, sternum and spine, with using an attenuation-based template matching approach. Surface transformation was applied to align the nodules seen on the initial CT scan with the nodules seen on the follow-up scan. Lee et al. (10) proposed a novel template-matching technique based on Genetic Algorithm (GA) Template Matching (GATM) for detecting nodules that exist within the lung area. The GA was used to efficiently determine the target position on the observed image and to select an adequate template image from several reference patterns for quick template matching. Farag et al. (11) proposed an algorithm for nodule detection with using deformable 3D and 2D templates that described the typical geometry and gray level distribution within the nodules of the same type. This detection combined normalized cross-correlation template matching according to genetic optimization and a Bayesian post-classification.
Fuzzy Logic was conceived as a better method for sorting and handling data, but this has proven to be an excellent choice for many control system applications since it mimics human control logic (12). Fuzzy Logic can be built into anything from small, hand-held products to large computerized process control systems. It uses imprecise, but very descriptive language to deal with input data in a fashion that is more like a human operator. It is very robust and forgiving of the operator and the data input and it often works when first implemented with little or no tuning.
In this study, we designed a CAD system for detecting lung nodules on CT images. First, segmentation of a lung region was considered with using Genetic Cellular Neural Networks (G-CNN). Then, the ROIs were found with using the density values of the voxels in the image slices and scanning these voxels in 8 directions with distance thresholds. The 3D ROI image was obtained by combining the ROI images. In order to classify the nodules, a 3D template was used and the similarity to the template was measured using a convolution operation. After the convolution of the 3D ROI image with the proposed template, the shapes that were similar to those on the template were strengthened. Thus, fuzzy rule based thresholding was applied and the nodules were successfully detected.
MATERIALS AND METHODS
On a serial-section lung CT slice, a cylindrical vessel can appear circular, and many vessels in the lung have a diameter that is similar to the lesions of interest. If the CAD systems detect the candidates based on the 2D image features, then hundreds of candidates occur. The systems then employ various operations to tackle the enormous numbers of false positives, and when filtering the large volume of false positives, the true positives are also omitted. The experienced radiologists look for lung nodules not by independently considering individual image slices, but by searching through the serial images for the characteristics of the 3D appearance that distinguish nodules from vessels.
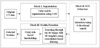
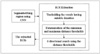
We developed a CAD scheme via computer programs that can prepare quantitative values and the position of lesions for the radiologists. If radiologists take into account the information obtained from our CAD system, their diagnostic performance will be be higher and the amount of time consumed would be less. Figure 1 shows the overview of our CAD system.
For the development and evaluation of the proposed system, we used the Lung Image Database Consortium (LIDC) dataset (13). Each CT slice used in this study has dimensions of 512×512 pixels. These 2D slices have a 0.625 mm thickness and each slice consists of unit elements called voxels that have values due to the thickness of the slice. The diameters of the nodules used in this study were between 3.5 and 7.3 mm and the nodule thicknesses, which are related with the numbers of slices that nodules appear, were between 5.625 and 18.75 millimeters. A Hounsfield Unit (HU) is a unit of X-ray attenuation that's used for CT scans, with each voxel being assigned a value on a scale on which air is -1,000, water is 0 and compact bone is +1,000 (14). When the dataset was examined, it was determined that the density values of the nodules were between -500 HUs and 100 HUs, and these were called the "minimum density threshold" and the "maximum density threshold" values, respectively.
Segmentation of a Lung Region
In this paper, segmentation of a lung region was done in order to prevent wasting time while searching for lung nodules out of the specified lung region. The proposed CNN method was introduced by Chua and Yang et al. (15), and this was used to segment the lung region, and its parameters were computed using GA, as was explained in (16-18).
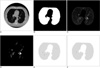
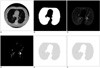
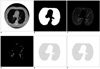
In order to segment the lung region, 10 neighborhoods were used for the CNN templates A and B, which represent the feedback and feed-forward connections, respectively. Another CNN template I was used as an offset matrix. 66 elements were needed for the A and B templates to have a symmetrical form. Thus, element vector S included 133 elements: 66 elements for A, 66 elements for B and 1 element for I. In Figures 2A, 3A and 4A, three serial CT images are shown and the segmented ung images with using CNN are given in Figures 2B, 3B and 4B. Figures 2C, 3C and 4C show the CT image in the lung region.
Regions of Interest Specification Methods
To reduce the complexity of the system, the ROIs were extracted using 8 directional ROI specification methods, which were introduced by Ozekes et al. (19, 20), to detect he mass candidates. Instead of scanning the whole CT slices with the template voxel by voxel, only the ROIs were considered in the scan. Consequently, the computation time and the detection time were reduced. Figure 5 demonstrates the overview of the ROI specification method.
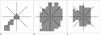
Voxels, which form the candidate lung nodule region, must be members of a set of adjacent neighbor voxels with densities between the "minimum density threshold" and the "maximum density threshold" values. Thus, in the first step of the ROI specification method, thresholding was performed to find the voxels with densities between the "minimum density threshold" and the "maximum density threshold" values. Figures 2D, 3D and 4D show the voxels with suitable density values. It has been observed that the diameters of lung nodules are between the upper and lower boundaries. So, to understand whether a voxel is in the center region of the shape, first, the diameter of the shape (assuming the voxel in question is the center) should be considered. At this stage, we introduce two thresholds that form the boundaries. One is the "minimum distance threshold" representing the lower boundary and the other is the "maximum distance threshold" representing the upper boundary. If a voxel has adjacent neighbors that are less than the "minimum distance threshold" or more than the "maximum distance threshold" in 8 directions, it could be concluded that this voxel couldn't be a part of the candidate lung nodule. Otherwise, it could be a part of the candidate lung nodule. Examples of determining if the voxels are a part of the ROI can be seen in Figure 6. Assume that the grey voxels in Figures 6A-C have suitable intensities. As seen in Figure 6A, if a grey voxel doesn't have a number of adjacent neighbor grey voxels that are greater than or equal to the value of the "minimum distance threshold", or as seen in Figure 6B, if a grey voxel doesn't have a number of adjacent neighbor grey voxels that are less than or equal to the value of the "maximum distance threshold" in all directions, it could be considered that the voxel under investigation is not a part of the ROI. Otherwise, as seen in Figure 6C, it could be concluded that the voxel is a part of the ROI. The values of the minimum and maximum distance thresholds deal with the resolution of the CT image. These thresholds are used to avoid very big or very small structures such as parts of the chest bones or heart and vertical vessels. In Figures 2E, 3E and 4E, the lung regions are shown with grey color and he detected ROIs are shown with black.
The input of the proposed system was all of the CT slices of the patient. Each slice is denoted as g(z), with z as the slice number. Therefore, g indicates the 3D demonstration of CT images with putting slices one below the other one. The value of a voxel at the location of x, y and z in the CT slices can be given as g(x, y, z) and g∈(-1000, 1000) HUs. The 3D ROI image is indicated as r(z), with z as the slice number, and the value at the location of x, y and z is represented as r(x, y, z), which have values +1 and -1. +1 represents the voxels that form the ROIs and -1 represents the voxels outside the ROIs.
Classification of the ROIs Using a 3D Nodule Template
Experienced radiologists constructed a 3D model of the nodule (anatomy around a nodule morphology) and they kept in mind the interaction of a 3D object with the serial image slices. In this study, we constructed a 3D model, which extracted the imaging features of a nodule, and then we performed a search through the 3D ROIs for objects that were similar to our 3D prismatic nodule template.
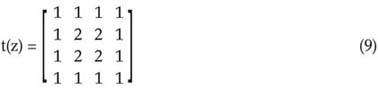
where t is 3D template matrix and t(z) is the zth layer of t. The values of the elements that constitute the 3D template were chosen as 1 and 2.
The classification task was performed by convolving the 3D ROI image with our 3D nodule model that we call the 3D template. The 3D convolution calculation is given below,
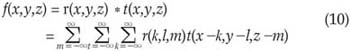
r(x,y,z)∈{1,-1} is the value of the voxel in the (x,y) coordinate of the zth ROI image. T(x,y,z) is the voxel value of the template at the location of x, y and z. f(x,y,z) is the voxel value of the output 3D images, which is obtained by convolving the 3D ROI image with the template, at the location of x, y and z.
The shapes, which are similar to the template, become stronger at the end of the convolution computation. Therefore, the voxel values of these shapes become highly positive, while the voxel values of the non-similar ones become highly negative. Thus, the nodules were extracted from the output image f with using Fuzzy rule based thresholding. To select the threshold values, we used the maximum entropy principle and the fuzzy partition method that were developed by Cheng et al. (21). The threshold values were the crossover points of the fuzzy sets that form the fuzzy partition.
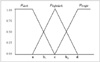
The 3-level thresholding was used to classify voxels into the dark, lightdark and bright groups. At the end of this voxel classification task, the dark group would represent the nodules. The lightdark and bright groups represent shapes that would be discarded. The membership functions of the fuzzy sets, i.e., dark, lightdark and bright, were defined as follows:
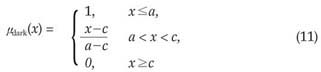
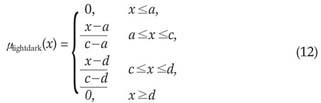
where x is the independent variable and a, c and d are the parameters determining the shape of the above three membership functions, as shown in Figure 7.
An exhaustive search was done to find the values for a, c and d. The details are described below.
Step 1. Input the image
Step 2. Compute the histogram, h(i), i = 0, …, 99
Step 3. Compute the probability of the occurrence, that is,
Pr(i) = h(i), i = 0, …, 99
Step 4. Use the exhaustive search method to find aopt, copt, and dopt, which form a fuzzy 3-partition that has the maximum entropy.
4.1. For the given a, c and d, compute a new membership function, µdark(i), µlightdark(i) and µbright(i) , for i = 0, …, 99
4.2. Compute the probabilities of the fuzzy events of the dark, lightdark and bright fuzzy sets.


4.3. Compute the entropy of this partition:
H = -P(dark)log2(P(dark))-P(lightdark) log2(P(lightdark))-P(bright)log2(P(bright))
4.4. If current H is greater than Hmax, then replace Hmax with current H. In the meantime, replace aopt, copt and dopt with current a, c, and d, respectively
Step 5. Then, the two threshold values of this fuzzy 3-partition are the mid-points of aopt, copt and dopt, i.e. b1opt =(aopt + copt) / 2, b2opt = (copt + dopt) / 2
Finally b1opt was used as the threshold value to determine the dark group that represents the nodules.
As seen in (9), the size of the template was 2.5 mm×2.5 mm. But as mentioned in the introduction part of section 2, the diameters of the nodules were between 3.5 mm and 7.3 mm. The reason for using a template smaller than the nodules was the convolution operation, which was used for the similarity measurement. If a ROI or nodule is convolved with a template bigger than itself, it will unavoidably disappear. On consecutive CT slices, some nodules' in-plane circular appearance appears to drift a little across the viewing screen from one slice to the next. In these cases, to detect those kinds of nodules, the convolution must be performed with smaller templates. Also using a small template in the convolution improves the probability of detecting the small nodules.
The resultant images after applying 3D convolution and fuzzy thresholding are given in Figures 2F, 3F and 4F. Here, the nodule was found on three images and no false positive (FP) nodule was detected.
RESULTS
The proposed method was applied to 16 cases that consisted of 16 nodules and 425 slices, which were taken from the LIDC dataset (13). The detection results were obtained according to the numbers of cases. The ROI images were obtained using 8 direction searches with a "minimum distance threshold" of 1 pixel and a "maximum distance threshold" of 8 pixels.
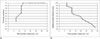
Detection sensitivity was calculated according to the minimum thickness of the nodule. If the minimum nodule thickness was chosen as a small value, then the probability of detecting the nodule was very high, but the number of false positive regions per case was also high. If a large value was chosen for the minimum nodule thickness, then the probability of detecting the nodule decreased because the less thick nodules were missed, but the number of false positive regions per case was small. In Figures 8A and 8B, the detection sensitivity and minimum nodule thickness are drawn according to the false positive regions per case. 100% sensitivity was reached at 13.375 FP regions per case and with a minimum nodule thickness of 5.625 mm. At this point, a total of 214 FP markings were found in 425 slices for 16 cases. If we combine all the slices into three dimensional space, then these 214 FP regions constitute 14 false nodules.
DISCUSSION
There is growing interest in using CAD systems that aid in the detection of lung abnormalities at earlier stages, and there are various image processing methods that have been proposed for the detection of nodules on lung CT images. Any computer system that analyzes the lungs and does not work on manually delineated regions of interest must incorporate automatic lung segmentation. Armato and Sensakovic (22) illustrated the importance of accurate segmentation as a preprocessing step in a CAD scheme. In a nodule detection setting, they showed that 5-17% of the lung nodules in their test data were missed due to the preprocessing segmentation, depending on whether or not the segmentation algorithm was adapted specifically to the nodule detection task. As the lung is essentially a bag of air in the body, it shows up as a dark region on CT scans. This contrast between the lung and the surrounding tissues forms the basis for the majority of the segmentation schemes. Most of the methods are rule-based (22-27). The ain lung volume is found in one of two ways. Gray-level thresholding and component analysis can be used, after which the objects that are the lungs are identified by imposing restrictions on size and location. Alternatively, the volume is found according to the region that originates from the trachea.
In this study, CNN was used to segment the lung region, and this was different from the previous studies. CNN consists of a number of signal processing units called cells each one associated with a single image pixel), which are usually arranged on two-dimensional grid points. Each cell is coupled only with its neighboring cells and the parallel pixel based-nature make CNNs extremely suitable for image processing. In this study, the coefficients of the CNN templates A, B and I are determined with using a genetic algorithm for geophysical data. Genetic algorithm is a statistical optimisation technique that uses natural selection. Compared with the other segmentation systems, the proposed lung region segmentaion method, which combines CNN and genetic algorithms, offers the advantages of higher processing speed and easy implementation.
The efficiency and complexity of this system are better than that of the other systems presented in the literature and also the current commercially available systems. Penedo et al. (5) tested their method with using 60 radiographs taken from routine clinical practice with 90 real nodules and 288 simulated nodules. They achieved 89-96% sensitivity and 5-7 FP's/image, depending on the size of the nodules. Xu et al. (6) used two hundred chest radiographs, 100 normals and 100 abnormals, as the database for their study. The CAD scheme achieved, on average, a sensitivity of 70% with 1.7 false positives per chest image. The system developed by Brown et al. (8) detected 16 out of the possible 20 (80%) new nodules on the follow-up scans with ten FPs per case. For 56 out of 58 nodules seen on the initial CT scans of 10 patients, the corresponding nodules on the follow-up scans were correctly established by a system developed by Betke et al. (9). The template-matching based system proposed by Lee et al. (10) correctly detected 71 nodules out of 98 with the number of false positives at approximately 1.1 per sectional image. A detection rate of 82.3% with the FP rate of 9.2% was achieved by the template matching system developed by Farag et al. (11). A number of studies have also reported the detection performance of various commercial CAD products. Kakeda et al. (28) assessed the usefulness of the commercially available CAD system called EpiSight/XR (Mitsubishi Space Software, Amagasaki, Japan). 45 cases with solitary lung nodules that ranged in size from 8 to 25 mm in diameter were used. The average area under the ROC curve value increased significantly from 0.924 without the CAD output images to 0.986 with CAD output images. The initial results from the ImageChecker CT (R2 Technology, Sunnyvale, CA) CAD software, which was presented at the RSNA by Wood et al. (29), showed a sensitivity of over 90% with two false positives per case.
In this paper, we designed a 3D CAD system for detecting lung nodules on serial CT images. CNN was used to segment the lung region and its parameters were computed using GA. The ROIs were found using the density values of the voxels in the lung regions and scanning these voxels in 8 directions with distance thresholds. The ROI images of all the slices were combined together to obtain a 3D ROI image. In order to classify the ROIs, a 3D template was constructed and convolution of the 3D ROI image with the nodule template was performed. Using Fuzzy rule-based thresholding methods, the true lung nodules were detected successfully. The Lung Image Database Consortium (LIDC) dataset was used in this study. 100% sensitivity was reached at 13.375 FP regions per case.
In conclusion, segmentation of a lung region with Genetic CNN and using a 3D template with Fuzzy rule-based thresholding for automated nodule detection on lung CT images was found to be an efficient method that displayed high sensitivity with an acceptable number of false positives per image.
 XML Download