

 PDF
PDF ePub
ePub Citation
 Print
Print


INTRODUCTION
Asbestos has long been used in roofing, insulators, brake pads, and gaskets, and at various workplaces and construction sites. Exposure to asbestos has been related to mesothelioma, asbestosis, and lung cancer (12). In the midwestern part of South Korea, production in domestic asbestos mines started in the early 1930s and ended in the 1990s. Because the mines were intermingled with villages, people residing near the mines were also exposed to asbestos, as were workers in the asbestos mines and processing facilities. In 2008, an asbestosis epidemic near an asbestos mine was reported due to a surveillance program of the National Institute of Environmental Research. The South Korean government subsequently enacted and enforced the Asbestos Damage Relief Act.
A pleural plaque, a localized pleural thickening occurring in individuals exposed to asbestos, is usually asymptomatic and causes slight impairment of lung function only when its extent is large (345). However, it is the most common form of the pleuropulmonary abnormality consistent with asbestos exposure and is considered to be a marker of exposure, indicating an increased risk of pulmonary fibrosis or asbestos-related malignancies versus the general population (46). In most screening for pneumoconiosis, a simple chest radiograph is used as the standard method, but this procedure has important limitations in the detection of early subtle pleural plaques, whereas a CT scan enables diagnosis of thin or tiny non-calcified plaques (78910). In South Korea, CT scans are used to assess asbestos-related pleuropulmonary lesions and pleural plaques; this kind of confirmation by a CT scan is considered evidence of asbestos exposure in individuals who are registered for asbestos damage relief but do not have clear evidence of asbestos exposure in their occupational or residential history. Experienced CT readers can diagnose pleural plaques with high confidence in most cases, which show the typical findings of bilateral multiple localized pleural thickenings sparing the costophrenic angles (610). However, the CT features are sometimes equivocal in challenging cases.
In this study, we aimed to evaluate the CT characteristics of various pleural plaques in individuals who had clear evidence of asbestos exposure from asbestos mines, and compared the CT features between occupational and environmental exposure groups.
MATERIALS AND METHODS
Study Population
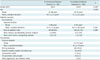
This retrospective study was approved by an Institutional Review Board. Informed consent was obtained from all subjects. The Asbestos Damage Relief Law has been enforced since January 2011 in Korea; and individuals who are registered with the Korea Environment Corporation for asbestos damage relief have to undergo a chest CT for the evaluation of pulmonary or pleural abnormalities that are consistent with asbestos exposure. Among them, in total, 279 subjects, who were exposed to chrysotile (a serpentine form of asbestos) from asbestos mines, were diagnosed as having pleural plaques (a localized pleural thickening) from January 2011 to December 2014, and were enrolled in the present study. The excluded individuals were those who had other benign or malignant pleural thickenings or effusions. There were 181 with occupational asbestos exposure (124 males, 57 females; mean age, 72.3 ± 8.2 years; age range, 48-92 years) and 98 residents (55 males, 43 females; mean age, 69.7 ± 9.5 years; age range, 42-88 years) within 4 km of asbestos mines, which were closed in the period from 1992 to 2006. All subjects with occupational exposure were also environmentally exposed to asbestos, because they lived in close proximity to asbestos mines. The study population included individuals who had worked in asbestos mines, factories manufacturing asbestos-related products, train stations used for transporting and unloading asbestos, and at sites located within 4 km of asbestos mines. Occupational and environmental exposures were assessed by two expert industrial hygienists. The demographics of the study population are summarized in Table 1.
CT Examination
CT scans were performed using various CT scanners at the institutions, to which the subjects were referred, for the evaluation of asbestos-related pleuropulmonary abnormalities. However, all the scans were obtained using a CT protocol that was designed for the purpose of evaluating pulmonary and pleural abnormalities related to asbestos exposure; it consisted of supine and prone thin-section (1-1.5 mm) images obtained at 1-cm intervals and continuous thick-section (3-5 mm) images performed in a supine position. No intravenous contrast medium was used.
Image Analysis
All the CT images were transferred to a picture archiving and communication system (PACS) at the institution where the imaging analysis was performed. The CT scans, from which personal information had been removed, were provided to two radiologists (who had 22 and 18 years of experience in thoracic CT, respectively, and 5 years of experience each as CT readers for asbestos-related thoracic diseases) who were blinded to the subjects' history of asbestos exposure. The two readers assessed the pulmonary and pleural lesions consistent with asbestos exposure and reached a conclusion by consensus. Image analysis was performed at mediastinal window (window level, 40 Hounsfield unit [HU]; window width, 400 HU) and lung window settings (window level, 700 HU; window width, 1500 HU), using a PACS viewer (INFINITT PiViewSTAR; Infinitt Healthcare, Seoul, Korea). The radiologists were permitted to adjust the window settings.
Pleural plaques were defined as variable-size localized pleural thickenings of soft tissue, or calcific densities attached along the pleura of the chest wall, diaphragm, and mediastinum on the CT scans. The following were recorded: number, presence of calcification, maximum width and length, location (chest wall, diaphragm, mediastinal pleura), and extent score of pleural plaques. The maximum width was measured from the thickest plaque in the subjects, and defined as the maximum vertical distance from the parietal pleura to the interface between the plaque and lung. The maximum length was measured in the largest plaque in the subjects, and defined as the longest diameter of the plaque. For the evaluation of plaque location, the chest wall was divided into right and left, ventral (anterior to the mid-axillary line) and dorsal, and upper (upper 1/2 of the thorax) and lower parts. The extent scores were measured in each hemithorax according to the involvement of the circumference of the lung, excluding the mediastinum, by combined maximum lengths of pleural plaques on axial image at the mid-thoracic level as follows: 0 = 0; 1 = up to 1/4; 2 = 1/4-1/2, and; 3 > 1/2 of the circumference of the chest wall. The total extent score was defined as sum of the extent scores of the right and left hemithoraces.
The CT findings, which were regarded as consistent with asbestosis, were the following pulmonary abnormalities: subpleural dot-like or branching opacities, subpleural curvilinear lines, intralobular interstitial thickening, interlobular septal thickening, parenchymal bands, and honeycombing. The following data about asbestosis were recorded: presence, extent, and fibrosis score: 0, absence of fibrosis; 1, subpleural dot-like or branching opacities only; 2, presence of reticular or linear opacities, and; 3, presence of honeycombing or traction bronchiectasis. The highest fibrosis scores were recorded. The extent was defined as the total volume of involved lung relative to total lung volume, and the extent scores were assessed visually. The total lung volume was divided into four quarters in a craniocaudal direction using five horizontal lines at the levels of apex, aortic arch, carina, inferior pulmonary vein, and costophrenic angle. The extent scores were measured as follows: 0 = 0; 1 = up to 1/4; 2 = 1/4-1/2, and; 3 > 1/2 of the total lung volume.
Statistical Analysis
Statistical analyses were performed using the SAS software (ver. 9.3; SAS Institute Inc., Cary, NC, USA). For categorical variables, the χ2 and Fisher's exact test were used, and for continuous variables, the Wilcoxon rank-sum test was used. Comparing the affected lobe as right to left, the Wilcoxon signed-rank test was used. Evaluating the relationship between asbestos exposure duration (environmental and environmental routes) and pleural plaque indices (maximum width and maximum lengths), a generalized linear model was used to evaluate the correlation coefficient and its p value. A p value < 0.05 was considered to indicate statistical significance.
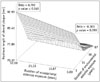
The relationship between asbestos exposure duration (environmental and occupational routes) and pleural plaque indices (maximum width and maximum lengths) was visualized using a locally weighted scatterplot smoothing regression fit model (11).
RESULTS
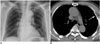
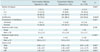
The CT features of pleural plaques in 279 subjects are summarized in Tables 2 and 3. Six (2.2%) subjects had only a pleural plaque in the thorax (Fig. 1), whereas 10 (3.6%) showed pleural plaques in a unilateral hemithorax. Calcification in pleural plaques was noted in 239 (85.6%) subjects; and was significantly more common in the occupational exposure group (88.9%) than the environmental exposure group (79.6%, p = 0.035).
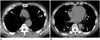
In the distribution of the pleural plaques in the thorax (Tables 3,4), the chest wall was the most common location (98.6%). In the craniocaudal direction, plaques were more common in the lower chest wall (upper, 90.7% vs. lower, 93.6%; p = 0.003), with a dorsal predominance (in lower chest wall: ventral, 55.9% vs. dorsal, 91.8%; p < 0.001); whereas plaques in the upper chest wall show slight ventral predominance (in upper chest wall: ventral, 77.8% vs. dorsal, 74.9%; p < 0.001). In the anterior-posterior direction, the dorsal side of the chest wall was more frequently involved than the ventral (ventral, 88.5% vs. dorsal, 96.8%; p = 0.012). In the ventral chest wall, pleural plaques were more commonly observed in the upper chest wall (in ventral chest wall: upper, 77.8% vs. lower, 55.9%; p < 0.001); whereas the lower chest wall was more frequently involved on the dorsal side (in dorsal chest wall: upper, 74.9% vs. lower, 91.8%; p = 0.021) (Fig. 2).
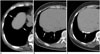
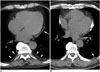
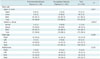
The diaphragm was the second most common site of pleural plaques (78.1%) with a right-side predominance (right, 73.8% vs. left, 55.6%; p < 0.001). In total, 75 (26.9%) subjects showed unilateral diaphragmatic involvement (right, 22.6%; left, 4.3%) and 143 (51.3%) showed bilateral involvement (Fig. 3). The mediastinal pleura were involved in 119 (42.7%) subjects with unilateral involvement in 79 (29.3%: right, 3.2%; left, 26.1%) and bilateral involvement in 40 (14.3%). In contrast to the right predominance of diaphragmatic plaques, the mediastinal plaques clearly demonstrated a left predominance (right, 17.6% vs. left, 39.4%; p < 0.001) (Fig. 4).
The distribution of pleural plaques did not differ significantly between the occupational and environmental exposure groups, except in the ventral and dorsal distributions of chest wall plaques (Table 3).
Pleural plaques showed variable widths and lengths (Figs. 1, 2, 3, 4). The maximum width measured 5.4 ± 2.7 mm (mean ± standard deviation) (range, 1-20 mm) and the maximum length measured 72.6 ± 54.8 mm (range, 5-310 mm). The maximum lengths of plaques were significantly longer in the occupational asbestos exposure group, as compared with the environmental exposure group (environmental, 60.8 ± 51.1 mm vs. occupational, 78.9 ± 55.8 mm; p < 0.001), but there was no significant difference in the maximum width (environmental, 5.3 ± 2.5 mm vs. occupational, 5.5 ± 2.8 mm; p = 0.792). The extent score of the pleural plaques was also significantly larger in the occupational exposure group (environmental, 2.64 ± 1.3 vs. occupational, 3.00 ± 1.27; p = 0.027). There was no significant difference in the extent scores between the right (1.44 ± 0.73) and left (1.42 ± 0.74; p = 0.8611) hemithoraces (Table 2).
Pulmonary fibrosis, consistent with asbestosis, was observed more commonly in the occupational exposure group (122, 67.4%) than in the environmental exposure group (52, 53.1%; p = 0.018). The extent (asbestosis extent score: environmental, 0.57 ± 0.6 vs. occupational, 0.75 ± 0.61; p = 0.015) and the degree (asbestosis fibrosis score: environmental, 0.99 ± 0.99 vs. occupational, 1.24 ± 0.95; p = 0.038) of pulmonary fibrosis were significantly larger in the occupational exposure group (Table 5).
When the 279 subjects, including both the environmental exposure and occupational exposure groups, were divided according to the presence of asbestosis (isolated pleural plaque [IPP] vs. pleural plaque and asbestosis [PPA]), there were significant differences in the maximum length (environmental exposure: IPP, 46.6 ± 30.9 vs. PPA, 73.4 ± 61.5; p = 0.016; occupational exposure: IPP, 53.5 ± 31.3 vs. PPA, 91.3 ± 60.8; p < 0.001) and total plaque extent (environmental exposure: IPP, 2.4 ± 1.0 vs. PPA, 2.8 ± 1.4; p < 0.001; occupational exposure: IPP, 2.4 ± 1.1 vs. PPA, 3.3 ± 1.5; p < 0.001), but no significant difference was observed in other plaque CT indices (Table 6).
In regression analysis to evaluate the relationship with asbestos exposure duration, a significant correlation was noted between the exposure duration and the maximum length of plaques in the occupational exposure group (p = 0.049), but not in environmental exposure group (p = 0.099) (Fig. 5). There was no significant correlation between the exposure duration and the other CT indices in either group.
DISCUSSION
In the midwestern part of the Korean Peninsula, there were many chrysotile asbestos mines, which were exploited for several decades beginning in the 1930s, and were closed in the 1990s. The residents near these asbestos mines were exposed to asbestos from occupational sources (asbestos mining, processing, and transporting) and environmental sources (living near the asbestos mine, factory, train station, and naturally occurring asbestos exposure from human activity with soils) (12).
There are several epidemiological reports of asbestos-related diseases caused by naturally occurring asbestos (13141516). The Dayao (crocidolite; China), Anatolia and Cappadocia (tremolite, actinolite, and eryolite; Turkey), and Libby, Montana (vermiculite; USA) areas are well known for exposure to asbestos from soils during incidental human activity (e.g., road surfacing, construction, agriculture, building). Crocidolite, tremolite, and actinolite have higher tendencies to cause asbestos-related diseases, whereas chrysotile is relatively less potent. It is notable that chrysotile, which is the major component at residences near asbestos mines, was associated with both occupational and environmental exposure to asbestos in this study. In a cross-sectional study of 6668 residents near Libby, Montana (USA), 17.8% of workers and their families showed pleural abnormalities; however, of those only exposed to naturally occurring asbestos, 6% had pleural abnormalities (16). In another study performed in Central Anatolia (Turkey) on 991 villagers, among individuals exposed to environmental asbestos 14.4% had pleural plaques and 10.4% diffuse pleural fibrosis, which is similar to the occupationally exposed asbestos cohorts (17). These findings are consistent with the present study in which both environmental and occupational exposures were associated with pleural abnormalities. Hence, a more-detailed longitudinal study should be conducted to assess the causal relationship between epidemiological (environmental and occupational) features and pleural plaques.
In this study, occupationally exposed individuals, who are likely to have had high levels of asbestos exposure, showed more severe asbestosis and a greater extent of pleural plaques than environmentally exposed residents. These results are consistent with those in previous reports that asbestosis and pleural plaques show a dose-response relationship (1819). Larson et al. (4) also reported that restrictive pulmonary function impairment correlated with the severity of pleural plaques and occupationally exposed individuals demonstrated a slightly higher frequency of restrictive impairment (12%) versus asbestos-exposed residents (9%). However, pleural plaque width, which is known to be associated with latency rather than exposure amount and to not be related to functional impairment (5171820), did not significantly differ between the groups. In this study, plaque calcification, also associated with latency, was observed more commonly in occupationally exposed individuals. We believe that the higher incidence of calcification is related to their slightly higher mean age, suggesting that they were likely to have slightly longer latency than the environmentally exposed group.
In the present study, we found an interesting tendency in the distribution of pleural plaques that has not been previously reported. Pleural plaques are classically found on the posterior thoracic wall and over the central tendons of the diaphragm, and generally spare the costophrenic angles and apices of the thoracic cavity. In addition to this classical pattern, this study revealed that diaphragmatic plaques were distributed more commonly on the right, whereas mediastinal plaques were on the left. In a previous study using chest radiographs, Elshazley et al. (10) also reported that all paracardiac pleural plaques were observed on the left. We hypothesize that that these anatomical and mechanical factors are likely related to this distribution. Asbestos fibers are transported to the pleural surface along lymphatic channels by macrophages or by direct penetration (2122). The right diaphragmatic dome has a larger interface with the lung because the anterior part of the left diaphragmatic dome contacts the heart. The left mediastinum also has a larger interface with the lung and the pulsating left ventricle pushes the left mediastinal pleura against the adjacent left lung with more intense pressure than that exerted by the right atrium against the right mediastinal pleura to the right lung. Regarding chest wall pleural plaques, ventral-side plaques were significantly more common in the upper hemithorax. We further hypothesize that this unique distribution is likely affected by lymphatic flow or mechanical pressure between the lung and pleura.
In asbestos-exposed people, the bilateral multiple localized pleural thickenings, not involving the costophrenic angles, are classical findings of asbestos pleural plaques, but they sometimes show atypical features of unilateral or single lesions in which differential diagnosis is needed because of pleural thickening or calcification by other causes, including previous trauma, surgery, or pulmonary infection (6). In the current study, a small number of subjects showed single plaques (2.2%) or unilateral hemithorax involvement (3.6%); the majority showed bilateral and multiple lesions. We hypothesize that unilateral or asymmetric involvement might be related to individual difference in the lymphatic flow of both hemithoraces.
Pleural plaques show variable sizes, ranging from a few millimeters to an extensive sheet-like lesion, and variable widths of 1-2 mm to a few centimeters. In this study, a CT protocol was used that is designed to diagnose all asbestos-related benign or malignant pleuropulmonary diseases. This consisted of supine and prone high-resolution CT at 1-cm intervals and conventional CT. The CT has higher sensitivity (93-100%) and specificity (83-100%) for the diagnosis of asbestos-related pulmonary or pleural abnormalities than chest radiographs (723) because a simple radiograph may not detect early subtle lesions and may provide a false-positive diagnosis of pleural plaques because of subpleural fat (71020). A thin-section CT scan is superior to conventional CT for the diagnosis of asbestosis or 1-2-mm-thin pleural plaques, with better discrimination between pleural plaques and extrapleural fat; furthermore, a prone CT scan is recommended for the detection of early pulmonary fibrosis occurring in the dorsal lung (892324).
A limitation of this study is that there was a selection bias in the enrolment of the study population. The applicants were not a representative population of those residing in close proximity to an asbestos mine. Those with available CT data were included in the eligible population. Those who were exposed to both occupational and environmental asbestos might have already passed away; thus, the "healthy worker survivor effect" may have been an issue. Another weakness is that there were small variations in CT thickness depending on the CT scanners used; because the CT scans were performed in several institutions using different CT scanners, although we recommended a CT protocol designed for the evaluation of asbestos-related pleuropulmonary lesions. Finally, in cases of equivocal CT features, such as single localized pleural thickening or pleural lesions of calcified nodular form, a diagnosis of asbestos pleural plaques was not obtained by pathological confirmation but only on the basis that the subjects were definitely exposed to asbestos and did not have other evidence of pulmonary infection on CT scans. Thus, we cannot completely exclude the possibility that lesions associated with atypical CT findings might be sequelae of previous pulmonary infections, such as tuberculosis. These limitations should be considered when interpreting the results of the present study.
Despite these limitations, this study has several strengths. All eligible cases from the South Korean Asbestos Damage Relief Act since January 2011 were included to examine radiological features. Thus, the study population was relatively large. For epidemiological studies, chest radiography has been used to identify pleural plaques. However, the CT scans were used to verify the presence and features of pleural plaques in the present study. Hence, more detail information might have been provided with CT. The data were derived from the Asbestos Damage Relief System, thus, detailed life-long histories for occupational and environmental exposure status were available.
In summary, pleural plaques associated with asbestos exposure are variable in number and size, and show predominant distributions in the upper ventral and lower dorsal chest walls, right diaphragm, and left mediastinum. The occupationally exposed mine workers have larger extents of pleural plaques and pulmonary fibrosis than environmentally exposed residents.


 XML Download