

 PDF
PDF ePub
ePub Citation
 Print
Print


INTRODUCTION
Idiopathic pulmonary fibrosis (IPF) is a specific kind of chronic, progressive fibrosing interstitial pneumonia of unknown origin and there is no sufficient evidence to support the use of any specific pharmacologic therapy (1, 2). To date, animal trials on therapeutic drugs for the treatment of IPF suggest a possible benefit, but most of these studies relied on the pathologic examination to establish the results (3, 4, 5, 6). Recently, micro-CT has become a useful imaging tool for the investigation of lung diseases in rats and mice, and it has been reported that findings of lung fibrosis on imaging correlated to pathologic findings (7, 8, 9, 10, 11). In addition, as new technology, such as cardiac and respiratory gating with free-breathing develops, micro-CT becomes a more effective tool to illustrate lung diseases, including pulmonary fibrosis, in mouse models good images can be obtained without sacrificing the mouse (11, 12). Also, Lee et al. (12) reported that micro-CT and pathologic scores of lung fibrosis after bleomycin instillation were found to be strongly correlated with in vivo and postmortem measures.
However, the micro-CT can be very useful in the assessment of therapeutic responses, but only few cases using micro-CT for lung fibrosis in mice have been reported yet (7). And there is no report assessing the serial follow-up micro-CT imaging for the therapeutic response in the same lung fibrosis mice model.
Therefore, in this study, we intended to investigate serial micro-CT findings before and after rosiglitazone administration in a lung fibrosis mouse model induced with bleomycin.
MATERIALS AND METHODS
Animals and Experimental Protocols
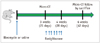
This study was approved by the Institutional Animal Care and Use Committee of Chonbuk National University. Female C57BL/6 mice (aged 8-10 weeks) were obtained from the Orientbio Inc. (Seongnam, Korea) and were housed. After the mice were anesthetized with thiopental sodium (0.08 mL/kg of body weight) administered intraperitoneally, control mice (n = 10) were instilled with saline only into both lungs through a tracheal cannula. The experimental mice (n = 20) were instilled with bleomycin solution. The bleomycin solution (bleomycin hydrochloride [5 U/kg, Nippon Kayaku Co., Tokyo, Japan] suspended in sterile 0.9% NaCl) was prepared immediately before administration and was directly instilled as a single 60 µL dose into the trachea. The mice were placed in supine position for five minutes and kept warm under a heat lamp until they fully recovered from respiratory distress. At that time, the mice instilled with saline or bleomycin underwent micro-CT imaging. After the instillation with bleomycin, mice were closely observed for 3 weeks. At 3 weeks, another micro-CT was performed. If they presented abnormal CT findings, the mice were treated with rosiglitazone (5 mg/kg body weight/day; Alexis Biochemicals, San Diego, CA, USA) dissolved in distilled water seven times by oral gavage at 24-hour intervals for seven days from day 21 to day 27. However, if they had normal micro-CT results at 3 weeks and a normal follow-up at 6 weeks again, the mice did not receive rosiglitazone treatment. If rosiglitazone treatment was given, we performed micro-CTs 2 weeks after treatment completion to define the effects of the agent on the lungs (Fig. 1).
Micro-CT
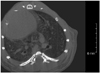
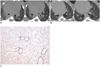
After mice were anesthetized with intraperitoneally administered thiopental sodium, the mouse lung imaging was performed using a micro-CT scanner (SkyScan 1176; SkyScan, Aarselaar, Belgium) with respiratory gating or breathing and heartbeat gating by synchronized acquisition. The X-ray system uses a microfocus tube with a spot size of 5 µm and produces X-rays in a cone-beam geometric formation. The images were acquired at 0.5 Aluminum filter, 50 kVp, 200 µA and 300 ms/frame with 360 views. The image field width was up to 68 mm and the voxel size was 35 × 35 × 35 µm. The estimated shooting time was approximately 24 minutes. The reconstruction image size was 1024 × 1024 pixels and 512 slices were acquired (Fig. 2).
Image Analysis
Two radiologists who were blinded to the pathologic results analyzed the micro-CT findings. All images were stored as the digital imaging and communications in medicine files and were transferred to a picture archiving and communication system (M-View™; Marotech, Seoul, Korea) to evaluate the micro-CT findings. An average of 300 slices per mouse was obtained to analyze the whole mouse lung. Two observers divided the lung into ten levels at regular intervals along the longitudinal axis from the thoracic inlet to the dome of the diaphragm. The right and left lungs were separated at the sternal midline.
The image quality of the micro-CT of each mouse was assessed semiquantitatively on a four-point ranking scale (1): 1 = excellent (no artifacts, unrestricted evaluation); 2 = good (minor artifacts, good diagnostic quality); 3 = adequate (moderate artifacts, still acceptable for diagnostic); and 4 = not assessable (severe artifacts impairing accurate evaluation).
We analyzed the radiological patterns, assessing the ground glass attenuation, reticular opacity, consolidation, bronchial wall thickening with traction bronchiectasis and honeycombing to evaluate the micro-CT findings of the control and experimental groups. A ground glass attenuation (GGA) indicated an increased attenuation without obscured pulmonary vessels. A consolidation indicated an increased attenuation with obscuration of the pulmonary vessels. Reticular opacities were defined as linear interstitial opacities. Traction bronchiectasis was used to describe the dilatation of the bronchial walls or an abnormal bronchial wall contour. Finally, honeycombing was defined as small cystic spaces of less than 5 mm in diameter with thickened walls (7).
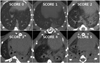
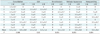
A total of 20 pairs of scores were obtained and abnormal areas on micro-CT imaging were evaluated before and after rosiglitazone administration. Observers gave one point at each level for consolidation, GGA, bronchiectasis, reticular opacity, and honeycombing. The severity of the image findings was semiquantitatively assessed according to the method proposed by Lee et al. (12). GGA, reticular opacity, consolidation, bronchial wall thickening with traction bronchiectasis and honeycombing were scored on a scale from zero to 5 (absent = 0, less than 5% = 1, 5-25% = 2, 25-50% = 3, 50-75% = 4, more than 75% = 5) depending on the involved area (Fig. 3).
Histological Examination
At 6 weeks, the mice were sacrified after the micro-CT imaging was performed and lung samples were taken with an overdose of thiopental sodium (0.08 mL/kg of body weight). Before the lungs were removed, the lungs and trachea were intratracheally filled with 1 mL of fixative (0.8% formalin, 4% acetic acid) using a ligature around the trachea. Lung tissues were fixed with 10% (v/v) neutral buffered formalin. The specimens were dehydrated and embedded in paraffin. For histological examination, 4 µm sections of fixed embedded tissues were cut on a Leica model 2165 rotary microtome (Leica, Nussloch, Germany), placed on glass slides, deparaffinized, and sequentially stained with hematoxylin and eosin (Richard-Allan Scientific, Kalamazoo, MI, USA). All sections were studied using light microscopy (Dialux 22; Leitz, Milan, Italy). The severity of inflammation and fibrosis was semiquantitatively assessed according to the method proposed by Lee et al. (13). The pathological grade of inflammation and fibrosis in the whole lung was evaluated under 25-100 magnifications. The pathological grade was determined according to the following criteria: 0 = normal; 1 = presence of inflammation and fibrosis involving less than 5% of the lung parenchyma; 2 = presence of inflammation and fibrosis involving less than 25% of the lung parenchyma; 3 = lesions involving 25-50% of the lung, moderate thickening of bronchial wall without obvious damage to lung architecture or small fibrous mass; 4 = lesions involving more than 50% of the lung, definite damage to lung structure and formation of fibrous bands or small fibrous mass; and 5 = lesions involving more than 50% of the lung, severe distortion of structure and fibrous obliteration of fields.
Statistics
The Wilcoxon-signed ranked test was conducted to compare the micro-CT images at weeks 3 and 6 (n = 20). We evaluated the lung areas involved in fibrosis and the changes of abnormal findings between 3 and 6 weeks, assessed by the difference of the CT scores and tested by the Wilcoxon-signed ranked test.
All analyses were performed using SPSS 9.0 software (SPSS Inc., Chicago, IL, USA) or GraphPad (GraphPad Prism 6, San Diego, CA, USA). The results are expressed as the mean plus and minus standard deviation and a p value of less than 0.05 was considered as statistically significant.
RESULTS
The interobserver variation of micro-CT findings was measured by kappa statistic (κ = 0.926 and 95% confidence interval; 0.826-1.026). The image qualities of micro-CT were adequate (score 1-3) in most cases (97.5%) except one case only that was non-assessable. Motion artifacts likely underlie the non-assessable image quality. The image qualities of micro-CT at 6 weeks (2.1 ± 0.63) was not significantly different from those at 3 weeks (2.29 ± 0.74) (p = 0.064).
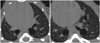
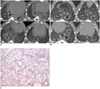
In control mice (n = 10), the micro-CT findings were normal at 3 and 6 weeks post intratracheal saline instillation (Fig. 4). In the experimental mice (n = 20), 11 mice had normal micro-CT findings (55%) at 3 and 6 weeks and nine mice (45%) had abnormal findings on micro-CT imaging performed at 3 weeks. Rosiglitazone was aminstered to these nine mice at 3 weeks and the micro-CT finding scores of the lung fibrosis area before (3 weeks) and after (6 weeks) rosiglitazone administration are shown in Table 1. The mean total micro-CT finding scores of the lung fibrosis area before and after rosiglitazone administration were 2.5 ± 1.4 and 1.7 ± 1.0, respectively (p = 0.006). In terms of consolidation, all cases (100%) showed a marked decrease from 3.1 ± 1.4 at 3 weeks to 0.9 ± 0.9 at 6 weeks, which was statistically significant (p = 0.006) (Fig. 5). However, in terms of GGA on micro-CT, the results were inconsistent: the scores decreased in two mice (22.2%), increased in two mice (22.2%) and were unchanged in five (55.6%). As a result, the difference in GGA scores by rosiglitazone administration was not statistically significant (p = 0.932). In the micro-CT images at 6 weeks appeared bronchiectasis (n = 6, 66.7%), reticular opacity (n = 7, 77.8%) and honeycomb patterns (n = 3, 33.3%).
After the treatment with rosiglitazone, eight of nine (88.9%) mice showed mild fibrosis, but complete improvement on pathology was seen in one out of nine (11.1%) mice. One out of nine mice (11.1%) showed normal findings on micro-CT after rosiglitazone administration at 6 weeks (Fig. 6), and five of nine (55.6%) mice showed no honeycomb pattern at 6 weeks. There was a strong correlation between micro-CT findings and pathologic scores at 6 weeks (r = 0.985, p = 0.031). After rosiglitazone administration, the remaining GGA showed inflammatory cells around the interstitium and partial bronchial wall thickening with interstitial septal thickening was observed on micro-CT. However, mice with worse results on micro-CT despite rosiglitazone treatment showed an extensive inflammatory cell infiltration, bronchial wall thickening with collagen deposition, focal fibrotic nodules and severe interstitial septal thickening with honeycomb appearance on pathology.
DISCUSSION
The effectiveness of rosiglitazone in reducing lung fibrosis has been well established by invasive techniques such as histological examination, immunohistochemical study and myeloperoxidase activity (7, 12, 14). Recently, Jin et al. (7) reported that the therapeutic effect of rosiglitazone on lung fibrosis could be evaluated using micro-CT serial images as a non-invasive technique similar to what is used in humans. Until now, it has been technically difficult to find lung fibrosis on micro-CT images at 3 weeks in a bleomycin-induced mice model without sacrifice. However, several papers reported that micro-CT findings (traction bronchiectasis, reticular opacity, and honeycombing) reflected lung fibrosis at 3 weeks through radiologic-pathologic correlation (7, 12, 13). With increasing technical possibilities, we were able to diagnose the development of pulmonary inflammation through abnormal CT findings such as consolidation and GGA on micro-CT at 3 weeks without sacrificing the mouse. These abnormal CT findings may or may not progress to fibrosis at 6 weeks on micro-CT. In addition, we can conclude that rosiglitazone is effective in treating lung fibrosis based on the improvement of abnormal parenchymal findings using micro-CT.
Research in experimental models of diseases, particularly in vivo, is very crucial to reveal the pathogenesis of diseases and to estimate the potential of agents as therapeutic drugs. In addition, it is also essential to develop optimal assessment tools for the research with animal models. During our review of papers on the effect of rosiglitazone on bleomycin-induced lung fibrosis, most of the researchers reported their results based on the hypothesis that lung fibrosis is induced 3 or 4 weeks after bleomycin instillation (7, 8, 14). The success rate in making bleomycin-induced lung fibrosis model depends on the skill of researchers, the amount and concentration of bleomycin solution and the characteristics of each mouse. In this study, each individual mouse had a different degree of pulmonary inflammation on micro-CT 3 weeks after bleomycin instillation. Fifty-five percent of bleomycin-instilled mice did not show lung fibrosis at 3 weeks or 6 weeks on micro-CT. Also, most of the abnormal micro-CT findings at 3 weeks were consolidation and GGA, and the severity of the abnormal CT findings varied from mouse to mouse. The therapeutic response to rosiglitazone varied according to the degree of inflammation at 3 weeks. Hence, we suggest that it is important to assess the degree of inflammation in the bleomycin-induced lung fibrosis model using micro-CT 3 or 4 weeks before the administration of rosiglitazone to establish a baseline and assess the precise therapeutic results of the rosiglitazone.
It was reported that micro-CT and pathologic findings correlated well in the bleomycin-induced lung fibrosis model (7, 12, 13). In the acute phase (3 to 4 weeks), the microscopy showed a pulmonary inflammation with many acute inflammatory cells accumulated in the alveolar walls and alveolar spaces. Multifocal consolidation and GGA occurred radiologically and was on micro-CT measured by the flow of instilled bleomycin. The pathologic findings were different compared to those of the acute phase in the chronic phase (6 to 8 weeks). The number of acute inflammatory cells reduced, but the number of chronic inflammatory cells with fibroblasts increased. In addition, alveolar septal thickening, interstitial fibrosis, thickened smooth muscle in the stroma, bronchial wall thickening and honeycombing occurred. Reticular opacity, GGA, bronchial wall thickening with dilatation and honeycombing were shown on micro-CT. However, those papers did not show how micro-CT findings in each mouse changed after bleomycin solution instillation. In the present study we could demonstrate that an acute inflammatory phase in the bleomycin-induced fibrosis model showed consolidation or GGA, but the severity of these findings was different. In addition, 2 weeks after rosiglitazone administration, only 10% of the mice in the inflammatory phase were normally recovered at 6 weeks. The remainder showed a variety of changes consistent with a chronic stage (consolidation, GGA, bronchiectasis, reticular opacity, and honeycombing) and we concluded that the rosiglitazone therapy was less effective in these mice. As a result, we found a different therapeutic response to rosiglitazone in each mouse according to the severity of the lung fibrosis at 3 weeks and to the characteristics of the mouse. Hence, it is important to obtain serial micro-CT imaging at the acute and chronic phase in the bleomycin-induced lung fibrosis model to gather the exact experimental data for the assessment of the rosiglitazone effect.
This study has several limitations. First, we investigated a small number of mice using the bleomycin-induced lung fibrosis model, and our study is, therefore, a preliminary report. In the future, our experiment needs to be performed repeatedly with a large number of mice. However, we believe that the experimental costs, time and labor could be reduced as an uncreated lung fibrosis model could be excluded with a micro-CT. Second, a semiquantitative visual scoring was used as method to analyze the imaging, as described in a previous report (12). Hence, we could not overcome minute changes in CT attenuation or pulmonary parenchymal texture. This limitation could be resolved with an improvement in the micro-CT image resolution in the future. Third, it may be difficult to completely exclude the possibility of spontaneous resolution of the bleomycin-induced lung injury between 3 weeks and 6 weeks because our study did not include any cases of natural follow-up without rosiglitazone administration. Also, we did not correlate micro-CT findings and pathologic at 3 weeks since this study was designed to investigate serial micro-CT findings before and after rosiglitazone administration in the same bleomycin-induced lung fibrosis mouse model. However, it has been theoretically established by other previous reports (7, 12). Fourth, micro-CT images in our study showed ring artifacts. The micro-CT used in this study has a compensation mode to reduce ring artifacts. However, it takes four times longer time than the conventional mode. Especially, micro-CT may not prevent ring artifacts in a living mouse despite the compensation mode is applied. A new technology must be developed in the future to obtain micro-CT images without ring artifact in a living mouse.
In conclusion, the micro-CT is a useful tool for a non-invasive study on the therapeutic effect of rosiglitazone in individual lung fibrosis mouse models. Especially, micro-CTs should be performed to evaluate whether or not lung fibrosis is established 3 or 4 weeks before the administration of therapeutic agents in order to obtain accurate experimental data showing the effects of rosiglitazone.
 XML Download