

 PDF
PDF ePub
ePub Citation
 Print
Print


INTRODUCTION
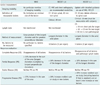
The measurement of solid tumors is generally determined by the use of imaging studies. Change in tumor size after treatment is often, but not invariably, related to patient survival length. Morphologic measurement of change in tumor size helps assess therapeutic effectiveness by the use of the Response Evaluation Criteria in Solid Tumors (RECIST) and their modified criteria (version 1.1) during cytotoxic chemotherapy (Table 1). In contrast, targeted chemotherapy aims for the interference of tumor signaling pathway and thereby the inhibition of tumor cell growth, but does not necessarily aim for tumor cell death. With such new treatments, disruption of tumor progression, over shrinkage of tumor size, is a more appropriate indicator of improvement in patient outcome (1, 2). With the development of new anti-cancer drugs, various diagnostic imaging modalities accompanied by new guidelines are emerging in the assessment of tumor response to treatment.
In recent years there have been dramatic increases in the range and quality of information available from noninvasive imaging methods; therefore, several imaging techniques are now potentially available to quantitatively assess tumor status and predict treatment response.
Computed tomography (CT) scan data can be quantified and processed to provide accurate and reliable anatomic information about not only tumor shrinkage or growth but also progression of disease by identifying either growth in existing lesions or the development of new lesions. However, there are limitations in the evaluation of tumor response when employing conventional response criteria alone. In this new era of molecular-targeted therapy for cancer treatment, the need for more accurate and earlier response-assessment methods is increasing.
In this review, the authors briefly review the currently used tumor response evaluation criteria, morphologic changes occurring after target therapy that are not considered under the current criteria, current issues, and new concepts in the evaluation of tumor response in the era of personalized medicine (targeted chemotherapy).
Anatomic or Morphological Approaches
A variety of new morphological approaches to assess tumor response to anti-tumor treatments have been introduced since the traditional methods of measuring tumor size were developed in the 1980s and 1990s largely for those who undergo cytotoxic chemotherapy.
Tumor Size Measurement
In 1979, the World Health Organization (WHO) established the first standardized approach in order to classify treatment responses of solid tumors, based on imaging studies. WHO categorized responses as complete response (CR), partial response (PR), stable disease (SD), and progressive disease (PD). According to the WHO evaluation scheme, individual tumor size is determined by bidimensional measurements of tumor size in the axial plane (3). However, some problems have emerged while using the WHO criteria: 1) the methods for integrating changes in evaluable lesions into response assessments, as defined by the WHO criteria, vary among research groups, 2) the minimum lesion size and number of lesions to be recorded also vary, 3) definitions of PD are related to change in a single lesion by some and to a change in the overall tumor load (sum of the measurements of all lesions) by others, and 4) the arrival of new technologies has led to some confusion about how to integrate three-dimensional measures into response assessments.
Response Evaluation Criteria in Solid Tumor guidelines were published in 2000 by a task force that comprised the European Organization for Research and Treatment in Oncology, the National Cancer Institute of the United States, and the National Cancer Institute of Canada. The RECIST guidelines defined the minimum size of measurable lesions, the number of lesions to follow, the imaging technique to be used, and the needs for uni-dimensional rather than bi-dimensional measurements for the evaluation of tumor burden (4). However, a number of questions and issues have arisen which have led to the development of a revised RECIST guideline (version 1.1) (5, 6). Major changes from the WHO criteria to RECIST version 1.1 are summarized in Table 1.
Since the publication of the RECIST criteria, several reports have been published regarding the low reliability of RECIST criteria in evaluating response in different types of tumors, such as prostate cancer (7), malignant pleural mesothelioma (MPM) (8-10), soft tissue sarcoma (11), neuroendocrine tumors (12), and disseminated pediatric malignancy (13). The WHO criteria and RECIST are mainly focused on the evaluation of anatomic tumor responses, and thus clinically meaningful responses may be underestimated because new targeted therapies can cause tumor necrosis without marked tumor size reduction.
Tumor Enhancement/Attenuation Evaluation
In 2000, the European Association for the Study of the Liver agreed that estimating the reduction in viable tumor volume (recognized as non-enhanced areas using dynamic CT or magnetic resonance imaging [MRI]) should be considered the optimal method for assessing the local response to treatment in patients with hepatocellular carcinoma (HCC) (14). Therefore, most authors reported on response to locoregional therapy such as arterial chemoembolization or radiofrequency ablation for HCC evaluated tumor response according to this recommendation (15-18). Riaz et al. (19) have shown good correlation between tumor enhancement characteristics and degree of HCC necrosis after radioembolization using yttrium-90 at explants. Thin rim enhancement with a lack of central enhancement on enhanced scans after treatment of the tumor was an imaging characteristic that correlated well with complete pathologic necrosis. Forner et al. (20) addressed that, when applying RECIST criteria, CRs obtained by tumor necrosis are missed and the extent of partial tumor response is underestimated because of attendant tissue necrosis particularly in patients who received percutaneous ablation.
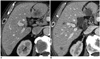
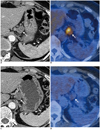
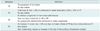
Gastrointestinal stromal tumor (GIST) is the mesenchymal neoplasm of the gastrointestinal tract expressing the c-kit receptor tyrosin kinase which is treated with imatinib mesylate (Gleevec; Novartis, Basel, Switzerland), a tyrosine kinase inhibitor (TKI) (21). In initial tumor response to imatinib in patients with malignant GISTs, dramatic changes were noted in tumor attenuation values, in the extent of enhancing intratumoral nodules, and in the extent of tumor vessels (22) (Fig. 1). RECIST underestimated the effect of imatinib on metastatic GISTs especially at this early stage of treatment, and was a poor predictor of clinical benefit. According to the Choi criteria (Table 2), a decrease in tumor size of more than 10% or a decrease in tumor attenuation of more than 15% on CT correlates well with good response by 18F-fluorodeoxyglucose (FDG) positron emission tomography (PET) (23) and shows excellent prognostic value (24).
Similarly, Chun et al. (25) reported that the morphological change of a colorectal liver metastasis after bevacizumab treatment from a heterogeneously enhancing mass with ill-defined margins to a well-circumscribed homogenously hypoattenuating appearance correlated well with pathologic response and patient survival, whereas RECIST did not correlate with patient survival.
Also, in metastatic renal cell carcinoma (RCC) patients treated with sunitinib, the Choi criteria were helpful to define early metastatic RCC patients who benefit from sunitinib therapy (26). According to RECIST, seven patients had PR, 38 SD, and 10 PD, whereas according to Choi criteria 36 patients had PR, 6 SD, and 13 PD. In patients with PR, Choi criteria had a significantly better predictive value for progression-free survival and overall survival than RECIST. Other response criteria such as size and attenuation CT (SACT) (27) or morphology, attenuation, size and structure (MASS) criteria (28) are more accurate than response assessment by RECIST in the assessment of metastatic RCC.
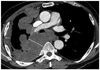
Anti-angiogenic agents sometimes cause intratumoral hemorrhage, necrosis, or cavitation which usually represents a good response to the agents and may actually lead subsequently to the inhibition of tumor growth (29). Among these responses, intratumoral hemorrhage may require particular caution as it might cause error in interpreting the treatment response according to tumor attenuation change. High CT attenuation from acute hemorrhage may be confused with an enhancing solid component or may mask the decreased tumor enhancement due to treatment if unenhanced images are not available. Intratumoral hemorrhage may also cause overestimation of tumor size and, thus, may lead to a misinterpretation of SD or PR as PD with the traditional tumor size-based response criteria (Fig. 2).
Tumor Texture Evaluation
Computed tomography texture analysis is an image processing algorithm that can be used to quantify tissue heterogeneity by assessing the distribution of texture coarseness and irregularity within a lesion. Goh et al. (30) found that CT texture analysis was an independent factor associated with time to progression and had potential as a predictive imaging biomarker after the treatment of metastatic RCC with TKIs. Heterogeneity at relevant scales could be quantified by using a range of parameters including entropy and uniformity. Entropy is a measure of texture irregularity while uniformity reflects the distribution of gray levels within the tumor: higher entropy and lower uniformity represent increased tumor heterogeneity. Tumor entropy decreased by 3-45% and uniformity increased by 5-21% for the different scale values after administration of a TKI. Much of the heterogeneity visible at CT represents photon noise, which can mask any underlying biologic heterogeneity. By using filters that select for image features at larger scales, CT texture analysis can be used to reduce the effect of photon noise while enhancing biologic heterogeneity.
Special Considerations in Lung Cancer
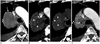
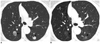
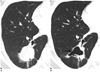
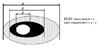
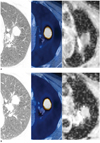
Conventionally, lung cancer size is generally measured on lung window images and includes both ground-glass opacity (GGO) areas and solid components in case of a part-solid nodule. However, the spatial extent of GGO within part-solid lung cancer generally does not vary profoundly (albeit the density may change) with anti-cancer treatments, demonstrating no remarkable size decrease even after effective chemotherapy (Fig. 3). Therefore, size change in only the solid component of a part-solid peripheral lung cancer, excluding the GGO area, may be a more accurate reflection of the actual tumor response to cancer chemotherapy. In addition, cavitation within a tumor caused by hampered angiogenesis and resultant tumor necrosis may constitute a type of tumor response (Fig. 4). Lee et al. (31, 32) proposed that novel CT response criteria devised in consideration of tumor constituents (solid and GGO components), the presence of cavitation and attenuation changes within a target lesion can be used for response evaluation in non-small cell lung cancer (NSCLC) patients who underwent epidermal growth factor receptor (EGFR) TKI therapy (Fig. 5) because the criteria reflecting additional morphological characteristics of target lesions are reproducible and have a statistically significant association with patient overall survival.
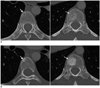
Special Considerations in Bone Metastasis
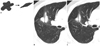
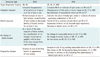
Bone is one of the most common organs of metastatic tumor spread in patients with breast or prostate cancer. Standard treatments for bone metastasis are anti-cancer agents such as chemotherapy and endocrine therapy. Imaging modalities such as radiography, skeletal scintigraphy (SS), CT and MRI, and PET can be used to assess the response of bone lesions to treatment. Accurate response assessment of bone metastases to treatment requires visualizing not only the tumor burden but also structural changes in the bone (Fig. 6). Hamaoka et al. (33) reported that the MDA criteria (University of Texas MD Anderson Cancer Center) (Table 3), which incorporate information obtained from CT scans into that of the WHO criteria (based primarily on SS), are superior to the WHO criteria for predicting progression free survival in patients with bone-only metastatic breast cancer who respond to treatment. The lower correlation between the primarily SS-based WHO criteria and the treatment response of bone metastasis might be a result of several factors including the high false positive rates of SS caused by conditions other than tumors such as fracture, arthritis, infection or 'flare' phenomena. With SS, which reflects osteoblastic activity, it can also take six months or longer to reliably detect a response because of the confounding effect of the flare phenomenon, a spurious increase in radionuclide uptake because of reparative mineralization around healing metastases (34).
On the other hands, Imbriaco et al. (35) reported that changes in bone scan index (BSI, estimating the fraction of the skeleton that is involved by tumor as well as the regional distribution of the metastases in the bones) are a response indicator in androgen-independent prostate cancer. The usefulness of assessing BSI changes on serial SS as a promising response evaluation tool was further supported by the study of Dennis et al. (36) who demonstrated that on-treatment changes in BSI on serial SS are a response indicator in patients who were in treatment for castration-resistant metastatic prostate cancer.
Metabolic, Functional, and Other Nonanatomical Approaches
New functional and metabolic imaging techniques that have the capability to integrate pathological, physiological and morphological changes render a substantial potential as early predictors of therapeutic response. They provide the ability to detect microscopic changes in tumor microenvironment and tissue cytoarchitecture; thus, allowing earlier assessment of therapy response by observing alterations in perfusion, oxygenation and metabolism.
Metabolic Imaging
Anatomic imaging alone has limitations, particularly in assessing the activity of newer cancer drugs that stabilize disease rather than reduce tumor size, whereas 18F-FDG PET appears particularly valuable in such cases (Fig. 7). PET has the ability to assess tissue metabolism by using radiolabelled molecules, most commonly 18F-FDG, a glucose analogue. 18F-FDG PET shows increased glucose uptake in metabolically active cells (and thus in a metabolically active tissue) and is most commonly used to measure glucose metabolism or tumor growth in oncology. The standardized uptake value (SUV) represents a quantitative assessment of uptake in a tumor region of interest. 18F-FDG PET-CT has been shown to be of value in the differentiation of benign and malignant tissues, preoperative staging, recurrent disease detection, and more recently in the identification of early tumor response to therapy. Wahl et al. (37) proposed guidelines for the standardization of response criteria for FDG PET, the so-called PET Response Criteria in Solid Tumors (PERCIST).
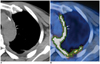
18F-fluorodeoxyglucose positron emission tomography-computed tomography is particularly useful for tumor response evaluation in patients with MPM. In cases of MPM, the limitation of conventional imaging techniques such as CT and MRI in treatment response evaluation is well recognized (38). The imaging findings of MPM are diffuse, diverse, and difficult to differentiate from benign lesion findings. Since the pleura is not a solid organ and the pleural lining has a complex shape, CT and MR may have disadvantages in depicting tumors and in differentiating tumors from adjacent pleural effusion or atelectatic lungs. In determining patient prognosis and response after therapy, the true tumor volume of MPM appears to be a critical factor (39). A measurement protocol specified as "modified RECIST" (9), with tumor thickness measurement taken perpendicularly to the chest wall or mediastinum, has become a standard protocol (Fig. 8). As for the objective measurement of MPM tumor response to a therapy, there have been a few recent trials using semi-automated methods developed by processing CT or MRI datasets and by quantifying MPM tumor thickness (9). However, the use of modified RECIST protocol (both manual and semi-automated methods) did not prove to substantially alter response evaluation efficiency (9). Recently, emphasis is given to the importance of volume-based parameters such as metabolic tumor volume and total lesion glycolysis evaluated at 18F-FDG PET-CT imaging in the prediction of patient prognosis and response to surgery or chemotherapy (40). Owing to difficulties in the radiologic assessment of tumor burden by using CT or MRI alone, the use of 18FDG PET-CT for the prediction of patient outcome appears to be promising (Fig. 9).
The SUV can also represent a quantitative assessment of uptake in a tumor and is based on a ratio between tracer uptake within a tumor and homogeneous distribution of tracer within the patient body. In patients with NSCLC, 18F-FDG PET has been recognized as an adequate staging tool (41, 42), and several studies also suggest that measuring SUVs before and after treatment is related to a prognostic value in patients with NSCLC (43, 44). Additionally, 18F-FDG PET has been shown to help predict response early during the course of chemotherapy (45-47) and molecular-targeted agent therapy such as EGFR-TKIs including erlotinib and gefitinib (48-50). However, interpretation of SUV changes is not straightforward because many factors may affect the values. For example, a reliable drop in SUVs indicating a tumor response is seen only in patients with high initial SUVs (51). Similarly, reduction in PET metabolism as a result of chemotherapy may be dependent, at least in part, on pre-therapy vascular delivery. A relationship was demonstrated between the vascular and metabolic characteristics of primary breast tumors, showing that any assessment of tumor metabolic activity using 18F-FDG PET may be controlled at least in part by delivery of uptake agent due to the vascular characteristics of the tumor (52, 53).
Angiogenic Imaging
Dynamic contrast enhancement (DCE) CT techniques (also known as CT perfusion, CTP) are attractive for clinical practice (54). The techniques enable the analysis of the temporal changes of tumor and vessel attenuation after the intravenous administration of conventional iodinated contrast agents, and the quantification of regional tumor blood flow, regional tumor blood volume, blood flow-extraction product, and permeability-surface area product through standard kinetic models. Several studies have demonstrated changes in CTP parameters in response to different kinds of cancer treatment including targeted agents, standard chemotherapy and radiotherapy. Jiang et al. (55) suggested that CTP is a more sensitive image biomarker in advanced HCC patients treated with a combination of anti-angiogenic (bevacizumab) and conventional chemo- (gemcitabine and oxaliplatin) therapies for monitoring early anti-angiogenic treatment effects as well as for predicting outcome at the end of treatment and progression-free survival compared to RECIST and tumor attenuation. As CT technology has reached maturity, further consideration may be given to the direction of CT perfusion research. Reiner et al. (56) proposed that CTP imaging using dynamic 4D-spiral scanning with variable pitch is feasible and delivers information on the reliable qualitative and quantitative analysis of normal renal cortex and RCC perfusion.
Dynamic contrast enhancement-magnetic resonance imaging (DCE-MRI) also has the ability to yield detailed insight into underlying tumor angiogenesis by way of parameters relating to tumor perfusion and permeability, which can be analyzed by the continuous acquisition of MR images before and after the intravenous injection of a contrast agent (57). The parameters extracted provide information on blood flow, blood volume, microvessel permeability, extraction fraction and on plasma and interstitial volumes. Pharmacokinetic analysis of DCE-MRI is the most widely used method for measuring vessel permeability changes, analyses typically being derived from variations of the Tofts' two-compartment kinetic model which in turn has its roots in Kety's dynamic model. In this model, an injected contrast agent leaks into the extravascular-extracellular space (EES), and the assessment of tissue perfusion and permeability can be derived from the shapes of observed wash-in and wash-out curves. The volume transfer constant Ktrans (often called wash-in rate; unit: min-1) describes the forward leakage rate of the contrast medium. For blood vessels where leakage is rapid (that is when extraction fraction during the first pass of contrast agent is high, as typically found in tumors), perfusion determines the contrast agent distribution and Ktrans approximates to tissue blood flow per unit volume (58). Under flow-limited conditions, Ktrans equals the blood plasma flow per unit volume of tissue; under permeability-limited conditions, Ktrans equals the permeability surface area product per unit volume of tissue (58).
Dynamic contrast enhancement-magnetic resonance imaging has been investigated in various studies including bladder and breast cancers and bone sarcomas as an early indicator of tumor response to therapy (59-62) (Fig. 10). In breast cancer, it has been shown repeatedly that progressive decreases in tumor Ktrans accompany response to chemotherapy and that an increase or absence of change in permeability helps predict non-responsiveness (61, 62). Thus, DCE-MRI remains a promising biomarker for assessing tumor angiogenesis and the effect of anti-angiogenic therapy (63, 64). Liu et al. (65) investigated DCE-MRI as a biomarker in a phase 1 study of axitinib (AG013736), a TKI, involving 26 patients with advanced solid tumors in the liver, lungs and other sites. A linear correlation was found in which the percentage change from baseline to day two in Ktrans and initial area under the curve was inversely proportional to axitinib plasma exposure levels (achieved with various doses, schedules, and administration states). Wedam et al. (66) used a two-compartment pharmacokinetic analysis to measure several DCE-MRI parameters in a pilot study enrolling patients with breast cancer treated with anti-VEGF agent bevacizumab, alone for one cycle and followed by six cycles of bevacizumab in combination with doxorubicin and docetaxel. While there were no significant changes in microvessel density or vascular endothelial growth factor-A expression, all parameters reflecting reduced angiogenesis (DCE-MRI, studied at baseline and after cycles 1, 4, and 7) showed a significant decrease after treatment with bevacizumab (after cycle 1). The decrease continued with the addition of cytotoxic chemotherapy. A greater change was observed from cycle one to cycle 4 than from cycle 4 to cycle 7, implying that the overall tumor rate of change in treatment effect occurred in the earlier course of therapy.
Dual-Energy CT
Estimating the net enhancement of a tumor is crucial for the accurate evaluation of tumor response. In order to calculate net tumor enhancement, both enhanced and nonenhanced scans need to be acquired. However, to obtain both the scans as a routine protocol is worrisome because of the large patient radiation dose. Recent dual-energy CT (DECT) technique enables one to differentiate iodine substance from other materials by the principle of material decomposition (67). The iodine component of lung nodules can be measured on iodine-enhanced images at DECT and this is comparable to the real value (net enhancement) of the extent of net enhancement. Schmid-Bindert et al. (68) suggested that DECT could be a useful functional imaging test for patients with NSCLC because the technique provides information on tumor angiogenesis and its relationship with tumor metabolism by showing a close correlation between the maximum iodine-related attenuation at DECT and SUVmax on 18F-FDG PET-CT. According to Kim et al. (69), DECT may serve as a useful tool for response evaluation after anti-angiogenic treatment in NSCLC patients by rendering information on the net enhancement of target lesions without the need to obtain nonenhanced images.
Diffusion-Weighted MRI
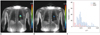
Diffusion-weighted MRI (DWI) allows the analysis of tissue characteristics based on the diffusivity of water molecules within tissue. Water diffusion in tissue reflects the tortuosity of the extracellular space, tissue cellularity, integrity of cell membranes and fluid viscosity. DWI exploits the microscopic random mobility of water protons and helps the characterization of lesions because the Brownian motion of water molecules causes phase dispersion resulting in attenuation of the measured signal intensity on DWI. When used in conjunction with apparent diffusion coefficient (ADC) mapping, DWI provides information about the functional environment of water in tissues, augmenting the morphologic information provided by conventional MRI. Restriction in the diffusion of water molecules is directly proportional to the degree of cellularity of the tissue. This restricted diffusion is observed primarily in malignancies, hypercellular metastases, and fibrosis, where a greater number of cells with intact cell walls were contained than in healthy tissues (70, 71). After successful anti-cancer treatment, decreases in tumor cell density due to necrosis and apoptosis cause substantial increases in water diffusion, and therefore, ADC value increases (Fig. 11).
In a recent the United States National Cancer Institute-sponsored consensus conference report on DWI (72), it was addressed that there is "an extraordinary opportunity for DWI to evolve into a clinically valuable imaging tool, potentially important for drug development." Major advantages of DWI include that no ionizing radiation is administered and that no injection of isotopes or any other contrast medium is necessary for examinations. Data acquisition times are reasonably short in terms of patient comfort, and the method is easily repeated. The information obtained can be quantified and displayed as parametric maps, enabling spatial heterogeneity of tissues or tumors to be analyzed, before and in response to treatment. DWI biomarkers such as ADC are theoretically independent of magnetic field strength (although in practice there may be variations due to technical reasons), and the relative simplicity of data acquisition facilitates multicenter and longitudinal studies.
Both animal tumors and human cancer studies have shown that increases in ADC values can occur rapidly after the first dose of chemotherapy at a time consistent with the onset of apoptosis. Chenevert et al. (73) showed that increased diffusion values are detected shortly after the initiation of brain tumor treatment, well before changes in tumor volume, and that the magnitude of diffusion change correlates positively with clinical outcome. With recent MRI technical advances, there have been progressive improvement in imaging body regions, including the abdomen and musculoskeletal system. There have been a few studies in primary rectal cancer patients that assessed the prognostic value of pretreatment ADC measurements (74-76). Hein et al. (77) used DWI to show substantial radiobiological changes in primary rectal cancers during therapy and detected a correlation between decreased ADC levels and the development of radiotherapy-induced intratumoral fibrosis. Several studies have evaluated ADC changes in patients with primary breast cancer treated with neoadjuvant chemotherapy and radiotherapy (78, 79). Pickels et al. (78) reported increased ADC values before a decrease in tumor size in women undergoing neoadjuvant chemotherapy for breast cancer. Chinnaiyan et al. (80) used DWI to monitor the effects of radiotherapy on breast cancer and reported an increase in ADC values with response to treatment, which histologically correlated with cell death due to apoptosis. Preliminary reports on the use of DWI in other tumors emphasize its potential as a marker of response to therapy for osteosarcoma (81), neuroblastoma (82), NSCLC (83) and prostate cancer (84).
Magnetic Resonance Spectroscopy
Magnetic resonance spectroscopy (MRS) helps detect the resonance spectra of chemical compounds except water, allowing for a true representation of the chemical and molecular composition of tissues. Although initially developed for neurologic applications, MRS has been expanded to be applicable to evaluate various tumors. The biomedical images produced by MRS are the product of an interaction between atomic nuclei and magnetic fields. Nuclei resonate at slightly differing frequencies, allowing the assessment of tissue molecular composition and providing structural information about relevant chemical compounds. Results are displayed on a spectrum which shows a series of peaks corresponding to different metabolites (85).
Previous studies indicated that these methods can be useful for monitoring the metabolic consequences of treatments in patients with malignancy such as breast cancer (86-88), HCC (89) and glioma (90). Manton et al. (86) used MRS to predict tumor response in 34 women receiving neoadjuvant chemotherapy for breast cancer. Imaging was done before the start of treatment and then again after two cycles of chemotherapy. Small/absent decreases in water-to-fat ratios after the two cycles of chemotherapy accurately predicted final volume non-response in 50% of cases (3 of six patients) while maintaining 100% sensitivity and negative predictive value. This level of accuracy might permit clinical application where early, accurate prediction of non-response would permit an early change to second-line treatment.
Many studies are now also focusing on measurements of choline-containing compounds by the use of water-suppressed MRS because choline is thought to be potentially a more sensitive and biochemically relevant marker of cancer-cell viability. In the studies of lymphoma and head and neck tumors, pre-therapy concentrations of phosphocholine and phosphomonoesters correlated with eventual tumor response (85). However, single-metabolite biomarkers are often not specific enough to help predict response to a particular therapy. Once individual metabolic changes are validated through detailed mechanistic studies, a combination of metabolic alterations could be envisaged, which might provide a more specific signature of response than single metabolite biomarker alterations (91).
Multi-Parametric Imaging and Tumor Response Evaluation
Given that each functional imaging technique provides unique insight into a particular aspect of altered pathophysiology in disease, there is now the opportunity to compare and correlate parametric maps derived from more than one imaging technique. Such correlative imaging comparison is not confined to one-imaging-tool-derived information but can be also extended to DECT, MRI, or PET/CT imaging. By combining the information derived from a number of imaging techniques, it is possible to gain a multifaceted insight into the phenotypic expression of diseases (92).
Other Issues in Imaging-Based Tumor Response Evaluation
Variability and Repeatability
When measuring tumor size changes between interval studies, changes include true tumor changes per se and concomitant measurement variations or errors. Variability can be caused by scan-rescan variability and both intra- and inter-observer variability between two repeat readings of the same scan. Oxnard et al. (94) reported that increases and decreases of tumor size less than 10% can be a result of the inherent variability of reimaging in patients with advanced NSCLC. This variability was greatest in the measurement of small tumors and had important implications for the accurate determination of disease progression.
Volumetric Assessment
The standard way to assess the response of solid tumors to chemotherapy is to perform uni-dimensional measurement of tumor size according to the RECIST criteria. Such linear measurements have limitations related to variability in technical factors, tumor morphology, and reader decisions (Fig. 12). The measurements of entire tumor volumes may allow one to overcome some of the limitations, to improve the ability to reliably detect small changes in measurements, and to increase statistical power per subject in trials (95). Neither the RECIST nor the WHO criteria include volume measurement partly because of technical restrictions such as the anisotropic characteristics of past diagnostic imaging techniques and partly because of limitations of the available measurement methods. But with the advent of thin-section CT, it is now possible to obtain image data sets with spatial resolutions adequate to measure tumor volumes (96). Zhao et al. (97) suggested that measuring volumetric changes in tumor dimension may hold the potential to be an earlier or better biomarker of tumor regression or progression. With semiautomated tumor segmentation with thin-section CT images and calculation by the use of computer software, changes in tumor volume may be assessed as early as 3 weeks after the initiation of gefitinib (Iressa) treatment, whereas a lower magnitude of changes in unidimensional and bidimensional measurements was seen during the same time period. The radiological measurement of tumor burden has evolved with the development of imaging technology. Volumetric assessment, by allowing the early identification of tumor dimensional changes, offers significant advantages for more rapid and accurate evaluation of anti-cancer drug efficacy than conventional measurement methods.
New Concepts in Clinical Research of Imaging-Based Tumor Response Evaluation
Independent central review (ICR) is advocated by regulatory authorities as a means of independent verification of clinical trial end-points dependent on medical imaging when the data from trials may be submitted for licensing applications. ICR is the process by which all radiologic examinations and selected clinical data acquired as part of clinical protocol are submitted to central location and reviewed by independent physicians who are not involved in the treatment of the patients. The ICR process can be used prospectively or retrospectively to assess whether patients meet eligibility criteria such as having PD on prior therapy or having measureable disease at baseline. It has been reported that even though eligibility requires measurable disease at baseline, up to 9% of enrolled patients do not have measurable disease as determined by the ICR. (98) ICR is a detailed process that enables the objective, reproducible, and independent evaluation of results when the primary study end-points are driven by medical imaging. The process is used to minimize bias; however, it does not completely elimination all potential sources of bias and, in some cases, may introduce bias of its own. The ICR process facilitates review by regulatory agencies and by accumulating all images in one location and one format. However, operational planning and consideration for the discussion issues that exist is required. The implementation of ICR in clinical trials is a process that will continue to evolve (99).
Traditional chemotherapies are cytotoxic in nature and act primarily by eliminating neoplastic cells (100). Therefore, change in tumor size, which is an indicator of change in the number of neoplastic cells, has evolved into a radiologic biomarker of treatment response (101). In contrast, targeted chemotherapy, which has emerged in the past 15 years, interferes with signaling pathways and thereby inhibits cell growth but does not necessarily lead to cell death unlike cytotoxic drugs. With such newer treatments, lack of progression may be associated with a positive improvement in outcome, even in the absence of major shrinkage of tumors (1, 2). Oncologists have become interested in the length of time that a cancer does not grow or metastasize. Thus, over the past decade, progression-free-survival became the preferred end-point for cancer therapy trials (102). Whether to stop or to continue treatment with molecularly targeted drugs can only be determined if we can define disease progression. Therefore, future clinical trials will need to investigate tissue or biomarker monitoring during treatment and correlate findings with relevant documentation associated with disease progression (103).
CONCLUSION
In conclusion, tumor response may be evaluated basically and readily by the use of RECIST version 1.1. However, the criteria mainly lean on tumor dimensional changes. These criteria do not reflect other morphologic, functional, or metabolic changes that may occur with conventional chemotherapy or targeted chemotherapy. The state-of-the-art multidetector CT is still playing an important role by showing high-quality, high-resolution images that are appropriate enough to measure tumor size and its changes. Additional imaging biomarker devices such as dual energy CT, PET, MRI including DWI shall become more frequently used for tumor response evaluation. Quantitative imaging biomarkers that are appropriate for and most fitted into estimating the response should be selected to evaluate treatment response in each tumor type. In another perspective, multiparametric imaging by integrating all information provided by such diverse imaging modalities may be the future goal in tumor response evaluation.
 XML Download