

 PDF
PDF ePub
ePub Citation
 Print
Print


A computed tomography (CT) is an excellent imaging modality for projecting the three-dimensional anatomy as two-dimensional, cross-sectional images. The primary characteristics that limit the CT image quality are spatial resolution, low contrast resolution, linearity, image noise, and artifacts. Noise and artifacts have been found to have the greatest impact on CT image quality (1).
Since 2004, the Korean Institute for Accreditation of Medical Image (KIAMI) has been the CT accreditation program responsible for the quality control of CT images in Korea (2). The CT phantom image evaluation is one of the several sections in the CT accreditation program. The parameters evaluated for the CT phantom image include the CT number of water, noise, image uniformity, spatial resolution, low contrast resolution, slice thickness, and the types of artifacts present (2, 5). An objective measure is used to evaluate the CT number of water, noise, and image uniformity. Conversely, a subjective measure conducted by radiologist reviewers, is used to evaluate the spatial resolution, low contrast resolution, and any artifacts (2-4). For example, the measurement of noise, an objective value, is a standardized process and will have the same reported value for every reviewer. As a result, there is more confidence in this parameter than the subjective parameters. Consequently, the demonstration of a relationship between the evaluation of the objective and subjective parameters will result in an increase in the overall confidence in the CT phantom image evaluation results.
The aim of this study was to increase the confidence level of CT phantom image results by demonstrating that the results of the subjective parameter CT evaluations correlate with the results of the objective parameter evaluations, especially noise.
MATERIALS AND METHODS
Materials
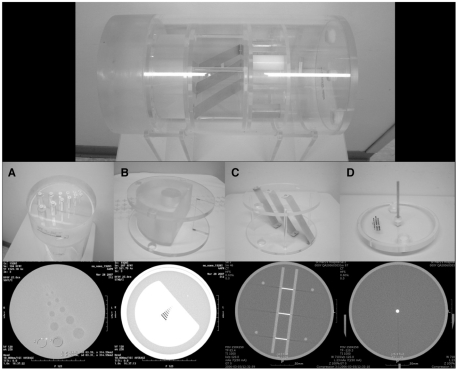
We examined the results of 586 CT phantom image evaluations using the KIAMI in Korea from May to June of 2007. CT Phantom testing was performed using the AAPM (The American Association of Physicists in Medicine) CT performance phantom model 76-410 (Fluke Biomedical, Cleveland, OH) on CT scanners in medical institutions throughout Korea (2-4, 6, 7) (Fig. 1). The specific performance parameters evaluated in the CT phantom testing included the CT number of water, noise, image uniformity, spatial resolution, low contrast resolution, and artifacts (2-4, 7, 8). All the phantom images were acquired using a standard imaging protocol: a 50 cm scan field of view (FOV) and a 25 cm display FOV with a standard reconstruction algorithm. A single slice scan (not a spiral scan) was acquired with a 120 kVp tube voltage and 250 mA tube current. For all of the parameters measured, except for slice thickness, a 10 mm collimation was applied (3, 4).
Standard of the Parameters in the CT Phantom Image Evaluation
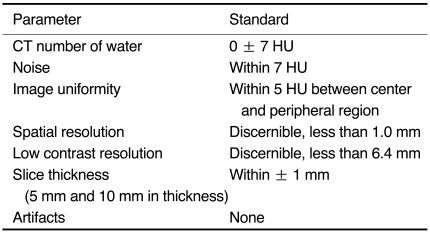
To determine the CT number of water, noise, and image uniformity, the central area of the water-filled CT number calibration block was imaged (Fig. 1D). A 4 × 4 cm2 cursor from the center of the phantom was established in the quadrant at the 6 o'clock position by applying the equipment's region of interest (ROI) analysis function. In addition, the mean CT number and the standard deviation were measured. These values were defined as the CT number of water and noise, respectively (3, 4, 7). The mean CT number of water must have been between -7 and +7 Hounsfield units (HU). The noise value must have been less than 7 HU. In uniform images, the mean CT number difference must be less than 5 HU for each of the three edge positions (4).
An acrylic-equivalent object was used for evaluating spatial resolution. The object has eight sets of air holes, with five holes per set (Fig. 1B). The diameters of the holes in the eight sets are 1.75, 1.5, 1.25, 1.00, 0.75, 0.61, 0.50, and 0.40 mm. To pass the spatial resolution evaluation, all five of the 1.00 mm holes must be clearly visible (4, 7).
To evaluate the low contrast resolution, a solid acrylic-equivalent cylinder with 12 cavities was used (3, 4, 7) (Fig. 1A). Pairs of spheres with diameters of 25.4, 19.1, 12.7, 9.5, 6.4, and 3.2 mm were spaced center-to-center at twice their diameter along a centerline. The spheres were filled through external ports with a solution of distilled water and iodinated contrast. The sphere to background ratio for the CT number of water was about 1% (10 HU). To pass this evaluation, one of the two 6.4 mm spheres must have been clearly visible (3, 4).
To pass the CT phantom image evaluation, there should have been no artifacts in the image. The summary of each standard is shown in Table 1.
The phantom images were independently assessed by at least two KIAMI-trained radiologist reviewers (3, 4, 7). If any disagreement existed for the outcome between the two reviewers, the images were independently evaluated by three more reviewers for arbitration. Based on the results of five reviewers, the final decision was determined by a majority (3, 4).
Methods
The KIAMI evaluations were divided into two groups based on whether the images passed or failed each subjective parameter evaluation for spatial resolution, low contrast resolution, and artifacts. We compared the mean values of the objective parameters for each of the two groups with each subjective parameter. The artifacts were divided into two types; CT scanner-related artifacts (e.g. ring artifacts or beam hardening artifacts) and print-related artifacts. For these two artifact types, we compared the mean values of the objective parameters and the pass or fail status of the low contrast resolution subjective parameter.
The differences in these mean values were assessed using the independent t-test, Mann-Whitney test, and simple correlation analysis. The SPSS software (Version 13.0, Statistical Package for the Social Sciences, Chicago, IL) was used to conduct the statistical analysis. Statistical significance was set at p < 0.05.
RESULTS
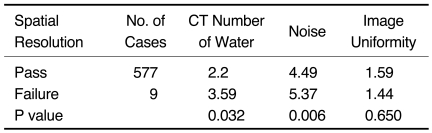
Of the 586 CT phantom images performed, 577 cases passed and nine cases failed the spatial resolution evaluation. The mean CT number of water, noise, and image uniformity were 2.20, 4.49, and 1.59 HU in the passing group, respectively, compared to 3.59, 5.37, and 1.44 HU in the failing group, respectively (Table 2). For the spatial resolution evaluation, the mean value of the CT number of water and noise were significantly higher than in the passing group (p = 0.032 and 0.006, respectively) in the group that failed.
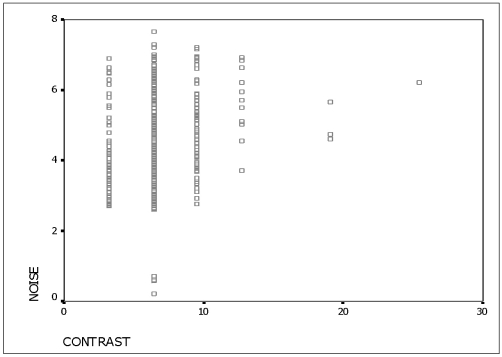
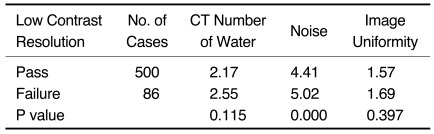
The evaluation for the low contrast resolution indicated that 500 cases passed, while 86 cases failed. The mean CT number of water, noise, and image uniformity were 2.17, 4.41, and 1.57 HU in the passing group, respectively, and 2.55, 5.02, and 1.69 HU in the failing group, respectively (Table 3). The mean noise level was significantly higher for the failing group (p < 0.001). For the group that failed the low contrast resolution evaluation, noise and low contrast resolution were significantly positively correlated (r = 0.183, p < 0.001, r = correlation coefficient) (Fig. 2).
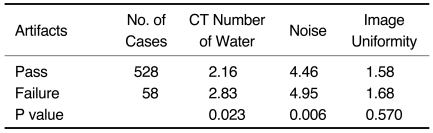
The evaluation for the presence of artifacts indicated that 528 cases passed, while 58 cases failed. The mean CT number of water, noise, and image uniformity were 2.16, 4.46, and 1.58 HU in the passing group, respectively, and 2.83, 4.95, and 1.68 HU in the failing group, respectively (Table 4). In the group that failed the artifacts evaluation, the mean values of the CT number of water and noise were significantly higher than in the group that passed (p = 0.023 and 0.006, respectively).
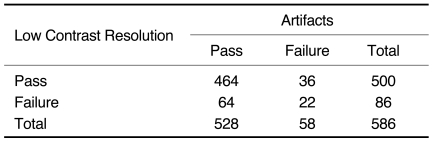
The low contrast resolution evaluation for the cases that failed indicated that, the failure due to artifacts was significantly higher than for cases that passed (p < 0.001) (Table 5).
Of the 58 cases that failed the evaluation for the presence of artifacts, 36 cases had either ring or beam hardening artifacts, whereas 22 cases had printer-related artifacts. There was no statistically significant difference between the mean values of the CT number of water, image noise, or image uniformity with regard to artifact type.
DISCUSSION
In this study we confirmed that the mean value of certain objective parameter evaluations (noise and the CT number of water) was significantly higher in the groups that failed the evaluation of the specific subjectively evaluated parameters (spatial resolution, low contrast resolution, and artifacts). Among the objective parameters, noise levels were found to show the most significant increase in the number of failed subjective parameter evaluations. Image uniformity did not significantly increase significantly for the images that failed the subjective parameter evaluations.
Noise is defined as the standard deviation of the CT results within an ROI in a uniform phantom image. Theoretically, the noise varies as a function of the reciprocal of the square root of the milliamperer seconds (mAs). In other words, when the mA or radiation dose increases, the noise decreases. However, this relationship can be modified by noise-reduction algorithms added to the CT instrument by the manufacturers. (9). Factors affecting noise include the number of detected photons (radiation dose), matrix size, slice thickness, reconstruction algorithm, electronic noise, scattered radiation, and object size. The absolute performance criteria for noise at a given dose level and the corresponding reconstruction algorithm are typically established using the vendor specifications (10). Because the amount of noise is variable in the above mentioned parameters, the acceptance level for noise in the accreditation program of American College of Radiology follows vendor specifications. However, because the CT phantom imaging tests were done under the same imaging protocols, we can evaluate the performance of the CT using the acceptance limits of noise. For example, the higher noise means the deterioration of the CT performance.
Low contrast resolution is the ability to distinguish two lesions with a minor density difference and is the most important parameter affecting the CT image quality (11). It is well known that the radiation dose and the corresponding noise greatly affect low contrast resolution (1, 12). For example, two lesions with minor density differences are relatively well distinguished under the homogeneous background; and, the homogeneity of the background is predominantly determined by noise. Therefore, an increase in noise causes a decrease in low contrast resolution (1, 12).
Spatial resolution is the ability to differentiate closely located small objects (1). In our results, we can confirm that an increased amount of noise shows a significant, weak positive correlation with the failure of low contrast resolution evaluations. However, the noise also increases in the group that failed the spatial resolution evaluations in our study. Poor calibration and obsolete equipment are possible explanations for the increased noise and the CT number of water, which also increases the failure of spatial resolution evaluations.
The Pearson correlation coefficient, r, between noise and low contrast resolution is 0.183. This value suggests that these two parameters have a weak positive correlation. This positive correlation means that if the noise increases, the size of a clearly detectable sphere in the low contrast resolution evaluation also increases. Therefore, if the CT phantom image evaluations are performed under more stringent standards for noise, the failure of low contrast resolution will indirectly be reduced. However, since the correlation coefficient is very low, factors other than noise likely impact the low contrast resolution results.
The correlations between the objective parameters (CT number of water and noise) and other subjective parameters (spatial resolution and artifacts) were not confirmed in our study, so we believe that more stringent standards for the CT number of water or noise would not reduce the failure rate for spatial resolution or artifacts. However, because the CT number of water and noise were significantly higher in the cases that failed the evaluations, we also cannot be sure that there are no correlations between them.
Even though the mean absolute values for noise levels and the CT number of water were high in the cases that failed the evaluations in our study, there were no positive correlations between noise and artifacts. Therefore, the increased value of noise was not primarily affected by artifactual noise; instead, the increased value was likely due to a combination of all types of noise. The evaluation failures due to artifacts were significantly higher for the group that failed the low contrast resolution evaluations. Therefore, we believe that there is a relationship between the artifacts and noise because of the positive correlation between noise and low contrast resolution.
We classified the artifacts into two categories: scanner-related artifacts (ring artifact, or beam-hardening) and printer-related artifacts. In the cases presented in this paper, there are no statistical correlations between the different artifact types and the CT number of water, noise, or image uniformity. However, the objective parameters, such as the CT number of water, could be directly affected by artifacts. The CT numbers of soft tissue imaged with a streak due to beam-hardening or ring artifacts were lower than expected for soft tissue (1). Changes in the attenuation coefficients for the tissue in the ROI could affect the noise measurement. Therefore, all types of artifacts can significantly affect the low contrast resolution. Printer-related artifacts do not directly affect the CT number of water, noise, or image uniformity, but beam-hardening or ring artifacts could significantly affect the CT number of water or amount of noise and consequently cause the failure of low contrast resolution. Decreasing the occurrence of these artifacts should result in the correct measurement of the CT number of water, noise, or image uniformity.
For this study, low contrast resolution, spatial resolution, and artifacts were affected by multiple factors including the amount of noise and the CT number of water. These factors also affected the result of other parameters. A positive correlation was found to exist between the noise level and low contrast resolution.
Since 2007, the acceptance level of noise in the KIAMI accreditation program has been a pixel-to-pixel standard deviation (within 7 HU), which is slightly stricter than the prior KIAMI standard of 8 HU during 2005 and 2006. If we implement a standard stricter than 7 HU, improved evaluation results are expected. Consequently, the strict evaluation of objectively evaluated parameters may result in the reduction in the number of appeals that arise in the failed groups of subjectively evaluated parameters.
In conclusion, we confirmed that the mean value of a few objective parameters (noise and the CT number of water) was significantly higher in the group that failed the evaluation with the subjective parameters (spatial resolution, low contrast resolution, and artifacts). Furthermore, we found that a weak, positive correlation was found between the noise level and low contrast resolution. Therefore, a more stringent evaluation of an objective parameter, using a more stringent acceptance level, especially for noise, may reduce failures due to the subjective parameter and low contrast resolution. We can maintain that a more stringent acceptance level for noise is one of the simple methods for improving CT image quality in the clinical field and consequently, could improve national health.
 XML Download