

 PDF
PDF ePub
ePub Citation
 Print
Print


Diffuse interstitial lung disease (DILD) is a complex group of disorders that affects the lung parenchyma and leads to respiratory failure if the cause is not removed or if therapy fails (1). High-resolution computed tomography (HRCT) has become the imaging modality of choice as demonstrated in studies to detect and to characterize a variety of disorders of the lung parenchyma and airways. Moreover, HRCT is known as useful to determine the extent of DILD, especially for idiopathic interstitial pneumonia (2). In addition, HRCT is useful to predict clinical outcomes for idiopathic pulmonary fibrosis; HRCT scoring of fibrosis correlates well with mortality (3). However, in most studies, the disease extent as depicted on HRCT images has been evaluated subjectively by radiologists. Radiologists analyze a medical image by searching for specific disease patterns. It is well known that there is wide variation in image interpretation among radiologists, and even on a day-to-day basis by an individual radiologist. However, an automated system can always produce the same results after training the system by the use of typical regions-of-interest (ROIs). To evaluate objectively the extent of DILD, several automated classification systems based on specific features of texture or shape within a DILD image have been developed (1, 4-10). Our investigative team has developed an automated classification and quantification system for chronic obstructive pulmonary disease using HRCT (11-13). We thought that the basic algorithm of these studies could be applied for quantitative assessment of HRCT images in patients with diffuse lung diseases. The purpose of this study was to develop an automated system for quantification of various regional disease patterns as depicted on HRCT images of diffuse lung diseases and to compare the performance of the automated system with human readers.
MATERIALS AND METHODS
The Institutional Review Board for Human Investigation of Asan Medical Center approved the study and informed consent was not required as the study was retrospective.
Automatic Classification System
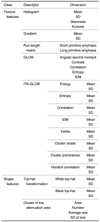
We developed an automatic classification system using the Visual C++ programming language and the use of the Insight ToolKit (ITK). Table 1 shows 37 image features used in this study. A histogram, gradient features, run-length encoding, grey level co-occurrence matrix (GLCM) and ITK-GLCM were used as texture features. For shape analysis, the size and number of low attenuation areas and means with standard deviations (SDs) of white and black Top-Hat transformations of original images were used. Detailed information for each feature has been reported in previous studies (11-13).
To train and to test the automated system, HRCT images were selected retrospectively from a collection of images of 106 patients including 14 healthy subjects, 16 patients with emphysema, 35 patients with cryptogenic organizing pneumonia, 36 patients with usual interstitial pneumonia, four patients with pneumonia and one patient with acute interstitial pneumonia. HRCT scans were obtained using 0.75-mm collimation and a sharp kernel (B70f), employing a 16-channel multi-detector CT scanner (Sensation 16; Siemens, Erlangen, Germany). A thoracic radiologist with 10 years of experience was asked to mark 600 typical ROIs (circular ROIs of 32-pixel diameter) on the following regions. The areas included the normal lung parenchyma (NL, n = 100), ground-glass opacity (GGO, n = 100), reticular opacity (RO, n = 100), honeycombing (HC, n = 100), emphysema (EMPH, n = 100) and consolidation (CONS, n = 100), with an allocation of 100 ROIs for a pattern. Only one ROI was selected in each image to minimize any clustering effect.
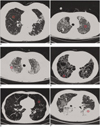
The visual characteristics of each regional pattern as depicted on HRCT images are illustrated in Figure 1. Figure 1A shows the NL. Figure 1B shows GGO, an increased hazy opacity in the lungs that is not associated with obscured underlying vessels. When the underlying vessels are obscured, the feature is termed CONS, as shown in Figure 1F. Thickening of the interstitial fiber network of the lung by fluid, fibrous tissue or cellular infiltration results in an increase in reticular lung opacity, as seen in Figure 1C. EMPH, as depicted in Figure 1E, results in focal areas of very low attenuation that can be easily contrasted with the surrounding higher-attenuation, NL if sufficiently low window levels (≤ - 600 HU) are used. EMPH is usually distinguishable from HC as areas of emphysematous destruction lack a visible wall whereas thick walls of fibrous tissue characterize honeycomb cysts. HC, as depicted in Figure 1D, reflects extensive fibrosis with lung destruction and results in a characteristic cystic, reticular appearance.
Using 600 ROIs for typical sites of local disease patterns, the system was trained using the Support Vector Machine (SVM) classifier and image features were extracted. The performance of the classifier was tested using a 5-fold cross-validation method. This test was performed by first classifying data randomly into five datasets (120 ROIs each) and then by the use of four datasets for model construction, retaining one dataset to test the performance of the model. The performance testing was repeated 20 times and the results were averaged to assess sensitivity and specificity of the system to classify regional disease patterns.
Automatic Quantification System
Based on the use of the developed automated classification system, an automated quantification system was developed. After performing lung segmentation using a manual drawing function, an analysis of the lung parenchyma was performed using a moving ROI function and each pixel was classified into one of six categories. Area fractions of each class were calculated. The trained system was applied to 92 HRCT images selected from 92 patients (one case of bronchioloalveolar carcinoma, ten cases of bronchiolitis obliterans organizing pneumonia, 68 cases of usual interstitial pneumonia, six cases of EMPH, one case of acute interstitial pneumonia, three cases of pneumocystis carinii pneumonia, one case of pneumonia and two cases of scrub typhus). To assess the agreement of the quantification data with the findings of the human readers, two thoracic radiologists with two and 10 years of experience of HRCT interpretation, respectively, were requested to draw area maps of the same HRCT images using dedicated in-house software. Agreements between the system and the two readers were calculated based on matched pixel counts. The comparisons were viewed using color-coded overlays.
RESULTS
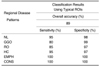
The sensitivity and specificity of the classification system for typical ROIs are shown in Table 2. The overall performance of the classification system was 89%. The class-specific sensitivity and specificity for each pattern was 95% and 98% for NL, 80% and 99% for GGO, 85% and 97% for RO, 95% and 97% for HC, 100% and 100% for EMPH and 100% and 100% for CONS, respectively. Notably, the system showed 100% sensitivity and specificity for EMPH and CONS.
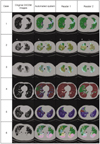
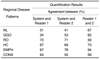
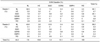
Texture-based and shape-based quantification was successfully performed on all images, and the quantification results were displayed using color-coded overlays of the original DICOM images. Figure 2 illustrates several examples of the quantification findings in comparison with the findings obtained by the human readers. Each case represents a case with a different dominant pattern. The agreement between the quantification findings from the entire set of HRCT images of the system and reader 1 were 51% for NL, 34% for GGO, 72% for RO, 67% for HC, 67% for EMPH and 64% for CONS. When the system outputs and reader 2 opinions were compared, the agreement was 41% for NL, 53% for GGO, 71% for RO, 69% for HC, 78% for EMPH and 55% for CONS. The agreement between the individual readers was 67% for NL, 82% for GGO, 56% for RO, 73% for HC, 94% for EMPH and 56% for CONS (Table 3). Table 4 shows a detailed comparison between the results from the use of the automated system and human readers. The main source of discrepancy between the use of the automated system and readers was erroneous quantification for NL, GGO and RO.
DISCUSSION
We have developed a system for texture-based and shape-based classification of DILD from the use of HRCT images. Unlike previous classification systems that have used only density and texture features (1, 5, 8, 10), we used shape features as well as density and texture features to perform objective classification of DILD. The SVM classifier afforded highly sensitive and specific differentiation among six typical radiological tissue types (Table 2). The results of this study are similar to or better than the findings of a previous study (10).
With advances in CT technology, HRCT is able to provide images of the lung with increasingly improved anatomic resolution. However, visual assessment of such images remains subjective and qualitative. Typically, a correct global diagnosis of parenchymal lung disease can be made 40-70% of the time, and in the study, the two experienced readers agreed on 76-85% of the global diagnoses (14, 15). Such variations have been confirmed in other studies examining lung pattern type, with an interobserver variation of 81% (kappa statistic of 0.48), and a similar level of intraobserver variation (kappa statistic of 0.37 to 0.78) (16). Various other visual scoring systems have been suggested by Remy-Jardin and colleagues (17), although in the previous study, the reproducibility of the scoring systems was not assessed. In general, published studies have reported that visual assessment of HRCT is subjective and qualitative. Thus, the use of an automated classification system is required for objective and reproducible assessment of disease extent.
Even though subjective comparison of color-coded overlays derived from the system and from the two readers showed considerable agreement, the quantitative results obtained by counting matched pixels showed relatively low levels of agreement (Tables 3, 4). There were significant discrepancies between the use of the automated system and the readers for the quantification of NL, GGO and RO. The main source of this disagreement may be due to the nature of GGO and RO. In reality, GGO, RO and HC are all part of the same disease spectrum for DILD and there is no clear threshold to differentiate among these patterns. Therefore, a large variation in the classification of these patterns may be seen, even among readers. Another possible reason for the low agreement is the difference in the quantification methods of the automated system and the readers. Whereas the system assessed a lung area on a pixel basis, readers were requested to draw lines discriminating different disease patterns. In this situation, normal vessels in the lung parenchyma or small areas of local disease patterns could be classified differently. The major advantage of the use of the automated system as compared to subjective assessment is that the system provides complete reproducible results.
Rapid advances in the fields of CT and computer technology over the past decade have led to the wide application of computer-aided diagnosis (CAD) methods to detect pulmonary nodules, pulmonary embolism and DILD (18). With DILD, several trials have evaluated the characteristics and distributions of variable disease patterns, including GGO, RO, NL and HC by computer analysis of texture features (4, 7). Although many studies have proposed objective quantification of DILD, all of the studies have focused on only texture analysis. Ashizawa et al. (19) developed a three-layer, feed-forward, artificial neural network for diagnosis of DILD as depicted on chest radiographs. The artificial neural network evaluated 11 separate DILD classifications based on 10 clinical parameters and 16 radiological findings extracted by radiologists from chest X-rays. The investigators demonstrated that this approach provided a useful second reader. Other studies (6, 20) have applied various attenuation thresholds to CT images or generated histograms reflecting either regional or global gray-level distribution patterns to measure interstitial lung disease. However, various pathological processes that cause a significant increase of the lung density can confound the use of such methods.
Uppaluri et al. (8) developed an objective, reproducible and automated approach (the adaptive multiple feature method) for regional evaluation of pulmonary parenchyma using HRCT images. In this study, the six characterized tissue patterns were HC, GGO, bronchovascular, nodular, EMPH-like and normal. These investigators used a seventh label, termed indeterminate, if confidence in the assignation of any one of the six other tissue patterns was less than 90%. By the use of this method, the quantification of absolute area and relative fraction of a specific disease pattern in patients was difficult as significant portions of the lung could be classified as indeterminate on HRCT images. We, however, classified all pixels of the lung area into one of six patterns and did not use an 'indeterminate' descriptor. It was thus possible to calculate the percentage area and pixel count of each disease pattern over the entire lung. Such assessments may be useful to follow the course of disease or to evaluate outcomes in response to therapy.
There are several limitations to this study. First, the agreement between the system and human readers was lower than the agreement between the individual human readers. The basic logic used to differentiate disease patterns may differ between the system and human readers. The system was trained using ROIs that represented typical disease patterns and the best combination of features and parameter settings were selected by the classifier to discriminate most effectively typical areas. However, as seen on clinical HRCT images of DILD, many lung areas are not composed of such typical representations; there are always transitional zones between disease patterns, as an area can develop from one class to another as disease progresses. Therefore, there is no clear method to discriminate among such borderline patterns. This fundamental problem may be overcome or may be minimized by adjustment of the system using ROIs with relatively atypical or borderline patterns. Another possible reason for the low agreement is the difference in the quantification methods of the system and for the readers. Whereas the system assessed the lung area on a pixel basis, readers were requested to draw lines discriminating different disease patterns. In this situation, normal vessels in the lung parenchyma or small areas of local disease patterns could be classified differently. Therefore, the discrepancy of quantification between the system and readers may be intrinsic. Regarding this intrinsic discrepancy, the usefulness of the automated system should be further evaluated by a comparison with clinical indexes as well as with image interpretation of human readers.
Second, we used only a two-dimensional (2D) model to evaluate the quantification of regional DILD patterns. Volumetric CT data of the whole lung, with isotropic voxel resolution, is now available following the development of multidetector CT technology, so the use of a three-dimensional (3D)-based texture classification system might improve accuracy. Xu et al. (10) used a 3D-adaptive multiple feature method (AMFM) for computer-aided classification of interstitial lung disease. These investigators determined that the use of 2D AMFM was both somewhat less sensitive and less specific for evaluation of HC and nodular patterns as compared with the use of 3D AMFM. CT is a 3D modality and many patterns of lung pathology are inherently 3D; thus, 2D features are less sensitive and specific in the characterization of such pathologies. However, a 3D system will require increased processing time, and thus a high-performance computer. In addition, HRCT images with interrupted intervals are used in clinical practice. Therefore, we decided to develop a 2D-based system that can be more practical for clinical utility.
Third, there was a data clustering limitation. To select typical areas as much as possible, we chose several ROIs from a single patient. Even though only one ROI in each image was chosen for analysis to minimize the clustering effect, this limitation could affect the results, as we could not solve the problem that several ROIs were chosen from a patient.
Finally, there is a limitation derived from the nature of the automatic classification system. Texture-based quantification is largely dependent on the training set (9, 10). In this study, one radiologist selected the typical ROIs based only on HRCT findings. However, the underlying disease patterns selected by the use of the ROIs were not confirmed by pathology. So there may be a selection bias for the use of the data set. Another problem regarding the training data set is that the system is also sensitive to the factors related with image acquisition methods including image resolution, thickness and/or noise pattern. To simplify the task, we used CT images from a single scanner (Siemens unit). However, application of this system to images obtained from different CT machines may yield unreliable data.
In conclusion, we have developed an automated classification and quantification system for various regional disease patterns using HRCT images of DILD patients. The system showed a good ability to classify six typical regional patterns of HRCT findings and a somewhat low agreement with the quantification findings of human readers. In addition to the agreement with that of human readers, reproducibility of image interpretation is also important. Considering this aspect, this system may be used for objective and reproducible assessment of regional disease severity and interval change in cases of various diffuse lung diseases.
 XML Download