

 PDF
PDF ePub
ePub Citation
 Print
Print


The classification of vascular lesions has been confused by the large number of descriptive and histological terms that have been used in the literature. Since Mulliken and Glowacki (1) introduced in 1982 a new classification of vascular birthmarks based on the clinical and histological characteristics of these lesions, two categories have been used to classify these malformations caused by hemangiomas and vascular malformations.
In order to select the optimal form and time of treatment, vascular anomalies are classified according to the vascular dynamics of a lesion as high- or low-flow lesions (2). These radiological terms indicate the speed of flow through the lesion and the rate of shunting between the arterial and venous components. Based on the flow dynamics, high-flow vascular lesions can include hemangiomas and arteriovenous malformations. Low-flow lesions include most venous malformations (3). However, some types of vascular malformation can have mixed components of high- and low-flow lesions, which sometimes make correct diagnosis and management difficult. The distinction is clinically significant as high-flow lesions are predisposed for spontaneous and intraoperative hemorrhage, have higher recurrence rates, and often involve and destroy bone and may therefore require transarterial embolization (4, 5).
As the performance of spiral CT scanning has dramatically improved the scanning repetition rate, multiphase CT is a helpful diagnostic tool that has been widely used to characterize the hemodynamics of hepatic masses or vascular lesions (6-8). In the head and neck area, however, little is known about the diagnostic value of the use of multiphase CT for vascular lesions. We hypothesize that multiphase CT is useful to distinguish high- from low-flow lesions in vascular lesions of the head and neck area.
To determine whether three-phase CT is able to distinguish high- from low-flow vascular lesions, we evaluated vascular lesions in the head and neck using three-phase CT consisting of pre-contrast, vascular (early) and equilibrium (delayed) phase scanning.
MATERIALS AND METHODS
Subjects
The study was performed according to the ethical standards of the Institutional Review Board, and informed consent was obtained from each patient.
Three-phase CT was selectively performed in 33 consecutive patients with a clinical diagnosis of a head and neck vascular lesion who met the following criteria. 1) Subjects included referred patients who were clinically suspected of having a high-flow vascular lesion due to the presence of a pulsatile and compressible mass and patients with a known vascular malformation detected on previous surgery. 2) Subjects included patients who had a head or neck mass who were referred for evaluation of the vascularity of the mass. 3) Subjects included patients who were referred with a clinically suspected venous malformation due to the presence of a compressible, soft mass that enlarged during the Valsalva maneuver or patients with a residual vascular malformation despite surgical resection or ethanol sclerotherapy.
This study included only patients who had been finally diagnosed with vascular lesions based on clinical and radiological evaluations, i.e. clinical presentation and a physical examination in addition to selective arteriogram and/or direct puncture venogram findings and/or from a pathology specimen. Although three-phase CT images were obtained in 33 patients, 12 were excluded from the study. The excluded patients included nine patients with plexiform neurofibromatosis; one patient with a hemangiopericytoma, one patient with a pseudoaneurysm; and one patient where the arterial phase images were lost. The final subjects of this study included 21 patients (eight men and 13 women; age range, 6-55 years; mean age, 22.5 years).
Three-Phase CT
All CT examinations were performed with the helical axial acquisition technique using a spiral CT scanner. The CT scans were planned to cover the entire palpable mass with a 2-3 cm margin of normal tissue. The CT images were reconstructed as axial slices with a 5-mm thickness without an interslice gap. After obtaining pre-contrast CT images, vascular-phase CT acquisition was started within 20-35 seconds after the beginning of contrast media injection (20 seconds was applied to children and 35 seconds was applied to adolescents and adults). A contrast medium bolus was injected by the use of a power injector.
Non-ionic iodinated contrast media (2 ml/kg or 80-90 ml of contrast medium, whichever was less) was injected at a rate of 3 ml/sec in most adult patients and at a rate of 2 ml/sec in children. After vascular-phase CT acquisition, equilibrium phase CT scanning was obtained 3 minutes later.
Imaging Analysis
Two neuroradiologists reviewed the three-phase CT images. The neuroradiologists examined the images together, blinded to patient name and diagnosis, and then reached consensus in cases of disagreement. Dense enhancement was defined as areas within a tumor that showed higher enhancement than on any other tumor portion and was greater than 120 HU on vascular-phase CT images. The size and shape of dense enhancement areas were determined and were documented in each case. The size of dense enhancement was classified as small (less than 1 cm), moderate (1-2 cm) and large (greater than 2 cm) according to the maximum transverse diameter.
The CT number was measured from two areas in a vascular lesion, which was sorted by the enhancement pattern. Dense enhancement as seen on the vascular phase was designated as area 1. When dense enhancement was not demonstrated on the vascular phase, an area that showed a relatively higher attenuation than another portion of the vascular mass was considered as area 1. An area with delayed enhancement on equilibrium-phase CT or an area with the least enhancement in a vascular lesion as seen on vascular-phase CT was designated as area 2. The CT number was measured on the same areas of the pre-contrast, vascular and equilibrium phases. In order to measure CT density, a round region of interest (ROI) with variable size capability according to the size of the enhancing area was placed at the same level of the lesion in all three phases. The ROI was selected when the cursor was not affected by partial volume averaging or by a beam-hardening artifact. A time density curve for areas 1 and 2 was acquired from the data that was used to measure the CT number.
The subjects were classified as having high- and low-flow lesions based on arteriogram and/or direct puncture venogram findings. A transfemoral selective arteriogram and/or a direct puncture venogram were obtained in all 21 patients. An arteriogram was obtained for 12 patients, a venogram was obtained for 15 patients and both images were obtained for six patients. A lesion showing an arteriovenous shunt, enlarged feeding artery, and rapid washout contrast without pooling of contrast media on a direct puncture venogram was defined as a high-flow lesion. A large, dilated venous sac showing contrast pooling with or without normal draining was defined as a low-flow lesion.
For analysis of the enhancing pattern of the vascular lesions, a "filling-in ratio" and "wash-out ratio" of areas 1 and 2 were determined for the vascular lesions using the CT numbers in each phase. These values were calculated using following equation:
[1] Filling-in ratio = (Vd - Pd) / Pd
[2] Wash-out ratio = (Vd - Ed) / Ed
Pd, Vd, and Ed are the CT numbers of the pre-contrast, vascular and equilibrium phases, respectively.
The pattern of the time density curves of area 1 and 2 were analyzed. According to the degree of elevation of the CT number, the slope of the pre-contrast to vascular phase was classified as rapid (filling-in ratio > 1.0) and slow filling-in (filling-in ratio < 1.0). According to the degree of deceleration of the CT number, the slope of the vascular to equilibrium phase was classified as rapid wash-out (washout ratio > 0.5), slow wash-out (0.5 > wash-out ratio > 0.0) and pooling (wash-out ratio < 0).
Therapy included preoperative embolization, direct resection and sclerotherapy. Operative resection was performed in nine patients, transfemoral arterial embolization was performed in six patients and direct puncture alcohol sclerotherapy was performed in 12 patients. Six patients underwent surgery after embolization or sclerotherapy.
Statistical Analysis
Comparison of the CT number of areas 1 and 2 between high- and low-flow lesions was evaluated using the unpaired t-test in which a value of less than 0.05 was considered as statistically significant. The filling-in and wash-out ratios of areas 1 and 2 between the high- and low-flow lesions were compared using the unpaired t-test and a value less than 0.05 was considered as statistically significant.
RESULTS
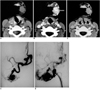
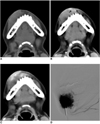
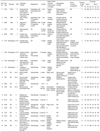
The clinical information, final diagnosis, flow pattern and imaging analysis for each patient are summarized in Table 1. The final diagnosis was an arteriovenous malformation in five patients, a hemangioma in four patients and a venous malformation in 12 patients. According to the findings of a selective arteriogram and/or direct-puncture venogram, nine vascular lesions had a high-flow component (Fig. 1) while the other 12 lesions did not have a high-flow component (Fig. 2). The high-flow lesions included all five arteriovenous malformations, three hemangiomas and one venous malformation. The low-flow lesions included 11 venous malformations and one hemangioma.
In nine patients with high-flow vascular lesions, the size of the dense enhancement as seen on the vascular phase was large in four patients, moderate in two patients and small in three patients. In 12 patients with low-flow lesions, five patients did not have any area categorized as dense enhancement; three patients had small lesions and the other four patients had moderate lesions.
On the vascular phase, the CT number of areas 1 and 2 of high-flow lesions was significantly different from that of low-flow lesions (areas 1 and 2: p < 0.05). However, the CT number of areas 1 and 2 enhancement on the equilibrium phase did not demonstrate a difference between the two areas (area 1: p = 0.4554, area 2: p = 0.2555) (Table 2).
The filling-in and wash-out ratios of high flow lesions in both areas 1 and 2 (4.90 ± 4.16 and 1.15 ± 0.50; 1.23 ± 1.10 and 0.04 ± 0.40, respectively) were significantly higher than for low flow lesions (1.63 ± 1.54 and -0.04 ± 0.40; 0.20 ± 0.16 and -0.48 ± 0.17, respectively) in both areas 1 and 2 (Table 3).
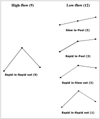
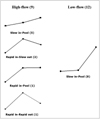
For the time-density curve for area 1, all nine high-flow lesions showed rapid filling-in and rapid wash-out. The curve for area 1 of low-flow lesions showed various patterns, including slow filling-in and pooling (5 of 12), rapid filling-in and slow wash-out (3 of 12), rapid filling-in and pooling (3 of 12) and rapid filling-in and rapid washout (1 of 12) (Fig. 3). For the time-density curve for area 2, all 12 low-flow lesions demonstrated a similar curve pattern, with slow filling-in and pooling. For high-flow lesions, the pattern of the time density curve for area 2 varied, with slow-filling in and pooling (5 of 9), rapid filling-in and slow wash-out (2 of 9), rapid filling-in and pooling (1 of 9) and rapid filling-in and rapid wash-out (1 of 9) (Fig. 4).
DISCUSSION
Vascular malformations can be subdivided into groups depending on the vessel that predominates, i.e. capillary, venous or arterial, and with or without lymphatic anomalies. The term hemangioma should be restrictively used to refer to a vascular tumor that enlarges by rapid cellular proliferation followed by slow involution. However, "hemangioma" has also been used as a term to indicate some type of vascular malformation, in particular a cavernous hemangioma (3). Arteriovenous malformations and hemangiomas in the head and neck area are usually seen as high-flow lesions on arteriography where definite differentiation is difficult. Therefore, in this study, hemangiomas were diagnosed when there was abnormal cavernous malformation as well as abnormal arteries and veins as determined on a pathological specimen or as mixed high- and low-flow components on an imaging study.
Even though the histological classification of Mulliken and Glowacki (1) has been securely established, the differential diagnosis is not always definite and does not always help to determine optimal treatment. The radiological classification used to clarify the dynamics within a lesion should be used to formulate a treatment plan based on the flow characteristics of the vascular lesion. Treatment has been usually sclerotherapy with or without excision for venous malformations, and embolization and excision for high-flow lesions (2). Selective arteriography has been a standard diagnostic method to confirm the presence of high flow in vascular lesions (3) despite its shortcoming of occasionally causing complications (9, 10). When a less invasive diagnostic method is used, the necessity for arteriography is reduced except for some critical indications that require preoperative embolization, determination of lesion extent and circulatory mapping of an arteriovenous malformation and aneurysms (11).
Grey-scale and Doppler ultrasound (US) are alternative modalities to diagnose soft-tissue vascular anomalies (12); however, US has only a limited ability to display the full extent of large lesions and to demonstrate an intra-osseous component (13, 14). Some MRI techniques have been used for classification of peripheral vascular lesions (14-16). Time-of-flight MR angiography can show feeding arteries with high flow; however, this modality has a limitation regarding smaller vessels (15). A previous study by van Rijswijk et al. (16) has demonstrated that with the use of the dynamic contrast-enhancement gradient-echo technique, venous malformations were distinguished from non-venous malformations with high specificity. Another study (14) has demonstrated that time-resolved MR projection angiography was useful for the separation of high- and low-flow vascular malformations. However, these MRI techniques are inadequate to depict adjacent structures as MRI can only accentuate blood vessels. MRI also has disadvantages of a higher cost and examination time as compared with the use of CT. In addition, CT would be a useful alternative modality for patients with a contraindication for undergoing MRI, such as pacemaker, claustrophobia and a dental prosthesis.
Defining the type of venous drainage of vascular lesions is required to predict the relapse risk after sclerotherapy and to minimize the risk of distal embolization and thrombophlebitis (5). However, there has been no way to predict the venous drainage pattern before a direct puncture venogram is performed. Most previous studies of non-invasive dynamic imaging have evaluated only high-flow components within vascular lesions (2, 11, 14, 16), though it is usual for vascular lesions to present as a mixed lesion in the pathological specimen. In contrast to previous studies, we designed this study to evaluate the time-density curves of two different components a high-flow component (area 1) and a low-flow component (area 2) of a single lesion. Based on the results of this study, the patterns of the time-density curves in all patients were consistent for low-flow lesions but varied for high-flow lesions in area 2. However, these patterns were reversed for the two flow lesions in area 1. Therefore, to differentiate between high- and low-flow lesions, an analysis of two different ROIs drawn within high- and low-flow components should be more useful than a single ROI in a high-flow component.
Our study has demonstrated that dense enhancement, which is designated as a "rapid filling-in" lesion with a high CT number as depicted on the vascular phase, correlated with the presence of a high-flow lesion. However, several low-flow lesions showed dense enhancement as seen on vascular phase CT. Only vascular phase CT images were limited to differentiate these lesions from high-flow malformations. The comparison of the wash-out pattern as depicted on the equilibrium phase was useful to differentiate the lesions. It is noteworthy that rapid filling-in does not always correspond to rapid wash-out. Therefore, the analysis of a combined three-phase CT scan may be more predictable for the flow pattern within a vascular malformation than the use of monophasic CT.
Interpretation and therapeutic application of the three-phase CT findings for low-flow lesions would be a prerequisite for a prediction of the effectiveness and risks of a sclerosing agent, such as alcohol, especially in large and/or complicated venous malformations. When there is rapid filling-in of a low-flow lesion, it is expected that there must be a rapid arterial inflow into the venous sac, thereby precluding the sclerosing effect of the alcohol caused by the rapid mixing of alcohol with blood. If there is rapid wash-out along the dilated veins, the injected alcohol can be washed out rapidly and may cause outflow tract sclerosis or a systemic effect. When a vascular malformation does not show any a significant high-flow component on three-phase CT, invasive transfemoral arteriography is necessary to perform.
This study has some limitations. First, arteriography and venography were not performed in all patients because each study was decided based on findings of individual patient physical examinations that included factors such as compressibility, pulsatility and skin color change of lesions. As angiograms were not compared in all patients, some lesions that were classified in a broad category may not have been accurately identified. Second, the scan parameters varied according to the type of CT scanner employed. Several different types of CT scanners with various numbers of detector rows (4, 16, and 64) and different manufacturers of scanning equipment were used in our institution. However, the scan acquisition timing, volume and injection rate of the contrast media and the reconstruction slice thickness were constant for all of the different types of CT scanners that were utilized in the study.
For a multiphase CT examination, a patient is exposed to a radiation dose that is multiplied by the number of scanning phases. The lens of the eye is especially sensitive to radiation delivered by X-ray based imaging modalities. For radiation dose reduction for the use of multiphase CT of the head and neck, we propose to change the protocol by eliminating the use of pre-contrast CT and by acquisition of only vascular and equilibrium phase images. It is also proposed to protect the lens of the eye by the use of bismuth-coated latex shielding (17) and to optimize the Z-axis automatic exposure control for multidetector CT (18).
Our results suggest that the pattern analysis of three phase contrast-enhanced CT would be a valuable support method for the evaluation and differentiation of vascular lesions of the head and neck. In addition, the rapidity and pattern of filling-in and wash-out of a contrast agent for a vascular lesion may be useful to decide the next step of imaging. If a vascular lesion with delayed contrast pooling does not show any early dense enhancing area, an arteriography is not necessary for the evaluation of arterial flow of the vascular lesion. When there are early dense enhancing areas that show contrast wash-out as seen on the equilibrium phase, arterial angiography and/or direct puncture venography are necessary in order to evaluate arterial flow and wash-out of the flow from a lesion.


 XML Download