

 PDF
PDF ePub
ePub Citation
 Print
Print


Since the advent of the new multislice helical CT scanners with their improved spatial and temporal resolution and contrast, coronary CT angiography has been established as a promising noninvasive method for assessing the patients with possible coronary artery disease (1). Owing to a high negative predictive value, coronary CT angiography may be suitable as a primary screening tool for those symptomatic patients with suspected coronary artery disease and it can be used an effective screening modality before performing invasive catheter angiography (2). However, coronary CT angiography has a limitation due to its high radiation dosage (3, 4). There have been many attempts to reduce the radiation dose when performing coronary CT (3-16). There are several heart rate-independent methods that can be applied to reduce the radiation dose (a) anatomy-adapted tube-current modulation (13), (b) reduction of the tube voltage (3, 4, 6), and (c) minimization of the scan coverage. There are also several heart rate-independent methods that can be applied to reduce the radiation dose: (a) decreasing the tube current during the systolic phase of electrocardiogram (ECG) (ECG pulsing) (3, 8), (b) decreasing the tube current to 4% during the nonreconstructed phase (16), (c) using a rate-adaptive pitch (10), and (d) sequential ECG triggering (9, 11, 14, 15), yet these methods are limited by the temporal resolution and the function of the CT machines.
Among them, lowering the X-ray tube voltage reduces the radiation exposure exponentially, while the lower photon energy at lower X-ray tube voltages causes higher attenuation levels of the iodinated contrast media (3, 4, 6, 17-19). In fact, settings of 80 kVp have been successfully used by several thoracic and cardiac studies, and especially for slim patients and children (3, 4, 18). However, there are limitations to apply the setting of 80 kVp for most patients who are undergoing coronary CT due to the degradation of image quality and the limited power of the tube current. On the other hand, using a X-ray tube voltage of 100 kVp may permit a substantial increase in the vessel signal intensity, and so this might compensate for the higher image noise that occurs with employing dose-saving strategies without impairing the image quality for most patients. Several studies on the usefulness of 100 kVp have already been published (4, 6, 17, 19, 20). However, most of these studies focused on abdominal and pulmonary CT angiography (17, 19, 20), or they were not focused on comparing the image quality between using 100-kVp and 120-kVp protocols, but rather, they focused on estimating the reduction of the radiation dose (4, 6). Therefore, the purpose of our study was to investigate the feasibility and benefits of performing 100-kVp ECG-gated coronary CT for adults versus performing 120-kVp ECG-gated coronary CT, and we focused on analyzing the image quality.
MATERIALS AND METHODS
Study Population
Our institutional review board approved this retrospective study and the board waived the requirement for informed consent. We included 185 consecutive subjects for whom contrast-enhanced coronary CT with the use of 100 kVp and 620 effective mAs was performed at the Seoul National University Healthcare System from March 2007 to June 2007 (100 kVp group). There were 40 women and 145 men with a mean age of 56 years (range: 35 to 78 years). The subject's body morphotype was analyzed by recording their height and weight, and we then calculated the body mass index (BMI = weight in kilograms divided by the square of the height [m]). Each subject was classified into one of the following two BMI categories: (a) a BMI of less than 25 (n = 105) or (b) a BMI of 25 or greater (n = 80).
For comparison, a gender-matched and BMI-matched group of 185 subjects who underwent the standard protocol (120 kVp and 500 effective mAs) was also selected from the Seoul National University Healthcare System from August 2006 to February 2007 (the 120 kVp group). BMI matching was performed by using a tight BMI difference limit (mean difference: 0.006 ± 0.245). The mean age of the 120-kVp protocol group was 56 years (range: 28 to 84 years). For all the subjects of the two groups, additional clinical findings that included the waist circumference and body fat mass were recorded. The body fat mass was measured using the InBody 4.0 body fat composition analyzer (Biospace, Seoul, Korea).
Multidetector CT Protocol
All the CT examinations were performed using a sixteen-detector row scanner (Somatom Sensation 16; Siemens Medical Solutions, Forchheim, Germany). All subjects with a pre-scanning heart rate of 65 beats per minute or higher were given 100 mg of oral metoprolol (Betaloc; AstraZeneca, Sweden) 45-60 min prior to the CT examination, unless a subject had a contraindication for taking beta-blocker. The precontrast scanning for calcium scoring was performed using a standard, prospective, ECG-triggered (80% of the R-R interval) protocol (3-mm section thickness and collimation, 120 kVp and a tube current-time of 100 mAs). Scanning for calcium scoring was performed as part of the imaging protocol for coronary CT angiography at our institution.
We administered 0.4 mg of sublingual nitroglycerin (Nitroquick; Ethex, St. Louis, MO) to all the subjects, except to ten subjects who had a contraindication to nitroglycerin, for coronary vasodilation after completion of the calcium scoring scanning. We injected 90 mL of a noniodine contrast medium (Ultravist 370; Schering, Berlin, Germany) into an antecubital vein and this was followed by 40 mL of normal saline, both at a flow rate of 4 mL/sec. A bolus triggering method was used to determine the beginning of CT acquisition by monitoring the signal density of the contrast medium in the midascending aorta. The CT scans were started 5 seconds after a threshold trigger of 100 Hounsfield unit (HU) above the baseline was reached.
A collimation of 0.75 mm, a gantry rotation time of 420 ms and 0.2 pitch were used. The tube current-time that was routinely used was for the 100-kVp protocol was 620 mAs, but for 27 subjects this varied from 600 to 630 mAs. For the 120-kVp protocol, the routine tube current-time we used was 500 mAs, but this varied from 550 to 600 mAs for four subjects. The data sets were reconstructed with retrospective ECG gating with a medium-smooth filter (B30) at the phase showing the least number of motion artifacts by the preview function, and this was usually done in the mid diastole phase.
Assessment of the Image Quality
To evaluate the difference of the baseline noise level between the two groups, the image noise on a precontrast image, which was used for calcium scoring and it was obtained by using the same protocol, was calculated by measuring the standard deviation of the left atrium with a 100 mm2 circular region of interest (ROI).
To obtain objective indices of the image quality, we determined the image noise, the signal-to-noise ratio (SNR) (4) and the contrast-to-noise ratio (CNR) (4) for the different scanning protocols. Image noise was derived from the standard deviation of the density values (in HU) with a 100 mm2 sized ROI located in the left ventricle. The SNR was assessed in the sinus Valsalva with an ROI of 60 mm2 in the area, and it was calculated according to the mean density divided by its standard deviation. The CNR was defined as the difference between the mean density of the contrast-filled left ventricular chamber and the mean density of the left ventricular wall with an ROI of 30 mm2 in the area, and this was then divided by the image noise (4). The image-quality parameters were obtained from the 1-mm thick transverse images. All the measurements and calculations were performed by one author (with 5 years of experience with chest CT).
For the subjective analysis, two experienced radiologists (each with 4 years of experience with the interpretation of coronary CT angiography), who were blinded to the technical parameters that were used, independently evaluated the paired CT images and they were asked to choose one image from each pair of images for less noise, better contrast and their general preference of reading. If there was neither a difference nor a preference between each pair of images, then the readers considered both images as equal. For evaluation of the image contrast, all the images were initially set with a window width and noise level of 1,200 and 300 HU, respectively, and the readers could freely alter the window setting. Subsequently, all the images were randomized and image quality was assessed in blinded fashion during a single consensus reading. A five-point grading scale was used as follows: 5 = clear delineation of the coronary arteries with excellent enhancement and clear, distinct anatomic detail, including the great vessels and the heart, 4 = clear anatomic detail with a mild increase in quantum mottle or a mild decrease in image contrast, 3 = a distinct increase in quantum mottle or a distinct decrease in image contrast with still unaffected diagnostic image quality, 2 = obscured anatomic detail due to deterioration of the image quality, a distinct decrease in image contrast and a distinct increase in quantum mottle leading to an uncertain diagnosis or even resulting in an insufficient evaluation of the diagnosis, and 1 = non-diagnostic (21).
Evaluation of the Effective Radiation Dose
The scan length was documented for every examination. The volume CT dose index (CTDIvol) and the dose length product (DLP), which were provided by the scanner system, were recorded. The effective dose was derived from the DLP and a conversion coefficient that is used for the chest as the investigated anatomic region. This conversion coefficient (k = 0.017 mSv * mGy-1 * cm -1) is averaged between male and female models.
Statistical Analysis
Comparisons of the paired results of the two protocols, according to the BMI, were analyzed using the paired t-test. Determining the correlation between the BMI and the objective measurement parameters was performed by using Pearson's correlation analysis. Graphs for the objective measurements versus the BMI were created using the linear regression model. For the discrete variables of the subjective analysis results, comparisons of the paired data were performed using the Wilcoxon signed rank test. Comparisons of the frequency between the two protocols, according to the overall image quality scores, were assessed by the Chi-square test. Inter-observer agreement for the interpretation of the subjective analysis results was assessed by weighted κ statistics. The κ values were interpreted as follows: 0.80-1.00, excellent agreement; 0.61-0.80, good agreement; 0.41-0.60, moderate agreement; 0.21-0.40, fair agreement; and 0.00-0.20, poor agreement.
All the statistical analyses were performed with statistical packages (SPSS for Windows, version 12.0, SPSS, Chicago, IL; GraphPad Prism, version 3.02, GraphPad Software, San Diego, CA; MedCalc for Windows, version 8.1.0.0, MedCalc Software, Mariakerke, Belgium). Differences were considered significant when the p value was less than 0.05.
RESULTS
Characteristics of the Study Groups
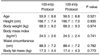
The mean heart rate with standard deviation was 55.9 ± 6.3 bpm for the 100-kVp protocol and it was 56.5 ± 5.9 bpm for the 120-kVp protocol during data acquisition. There were no significant differences between the two protocol groups for all the parameters, including the heart rate during the scanning, age, height, body weight, BMI, waist circumference and body fat mass (Table 1).
Objective Assessment of the Image Quality
The image noise on the pre-contrast images for calcium scoring was 21.9 ± 4.3 HU for the 100-kVp protocol and it was 22 ± 4.6 HU for the 120-kVp protocol. Yet the difference did not reach significance (p = 0.416).
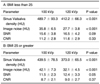
The mean attenuation of the sinus Valsalva with using the 100-kVp protocol (468 ± 90.5 HU) was significantly higher than that of the 120-kVp protocol (395 ± 68.6 HU) (p < 0.0001). On the other hand, the image noise decreased from 38.5 ± 7.5 HU for the 100-kVp protocol to 29.6 ± 4.6 HU for the 120-kVp protocol (p < 0.0001). There were no significant differences in the SNR and the CNR between the groups regardless of the BMI category (Table 2).
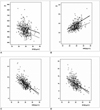
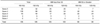
The scatterplots, as shown in Figure 1, illustrate the dependencies between the measurement parameters and the BMI. As the BMI increased, the SNR and CNR decreased in a similar fashion for both images (Fig. 1C, D). For the patients with a BMI of greater than 30, even the 120-kVp images also showed a poor SNR and CNR less than 10, which was similar to those of the 100-kVp images (Fig. 1C, D). All the objective measurement parameters, including attenuation of the sinus Valsalva, image noise, the SNR and the CNR, were significantly correlated with the BMI (all, p < 0.001). The Pearson correlation coefficients were -0.259 for the sinus Valsalva density, 0.610 for the image noise, -0.613 for the SNR and -0.529 for the CNR for the 100-kVp images, and these values were -0.385 for the sinus Valsalva density, 0.616 for the image noise, -0.642 for the SNR and -0.575 for the CNR for the 120-kVp images.
Subjective Assessment of the Image Quality
The weighted κ values for the evaluation of noise and preference indicated good agreement, with κ values of 0.607 and 0.692, respectively. The interobserver agreement for contrast was moderate, with a κ value of 0.539.
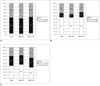
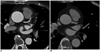
For the overall results of the subjective analysis, images with less noise were more frequent for the 120-kVp images: reader chose 12% of the 100-kVp images, 41% of the 120-kVp images and 46% of both images were equal: reader 2 chose 12% of the 100-kVp images, 28% of the 120-kVp images and 60% of both images as equal (both with p values < 0.0001). Images with better contrast were more frequent for the 100-kVp images: reader 1 chose 57% of the 100-kVp images, 14% of the 120-kVp images and 30% of the images were equal; for reader 2, the values were 52%, 8% and 40%, respectively (both p values were < 0.0001) (Fig. 2). For the preference test, both readers showed a tendency to choose the 100-kVp images: reader 1 chose 40% of the 100-kVp images, 29% of the 120-kVp images and 31% were equal images (p = 0.06); for reader 2, the values were 31%, 18% and 51%, respectively (p = 0.01). There was a stronger trend toward a preference for the 100-kVp images (p = 0.08 for reader 1, p = 0.004 for reader 2) for the category of a BMI less than 25 than that for the category of a BMI of 25 or greater (p = 0.41 for reader 1, p = 0.72 for reader 2) (Fig. 3).
The mean image quality scores, based on a five point scale, were 3.9 for the 100-kVp and 3.8 for the 120-kVp protocol (p = 0.229). In the category of a BMI less than 25, the mean scores were 4.1 and 4.0, respectively (p = 0.259). For the category of a BMI 25 or greater, the mean scores were the same (3.7) for both protocols (p = 0.572). Table 3 also shows that there was no difference in the frequencies according to the score between the 100-kVp and 120-kVp images (all, p = 1.00).
Reduction of the Radiation Dose
The scan distance covered was 136.9 ± 56.5 mm for the 100-kVp protocol and 135.2 ± 11.2 mm for the 120-kVp protocol and the difference didn't reach a statistical significance (p = 0.685). The CTDIvol was 30.5 ± 0.3 mGy with a range of 29.7 to 31.1 mGy for the 100-kVp protocol and 38.75 ± 0.9 mGy with a range of 38.5 to 46.7 mGy for the 120-kVp protocol. The DLP based on the given CTDIvol values showed significantly lower exposure for the 100-kVp protocol (456.4 ± 25.2 mGy * cm) when compared to the 120-kVp protocol (594.3 ± 56.2 mGy * cm) (p < 0.001). The mean effective dose based on the standard conversion factors was 7.8 ± 0.4 mSv for the 100-kVp protocol, resulting in an average 24% reduction of the effective dose for the 120-kVp protocol (10.1 ± 1.0 mSv) (p < 0.001).
DISCUSSION
The benefits of using lower kilovoltage settings for contrast-enhanced CT imaging have already been reported on (18, 19, 22-24). The change of radiation dose is approximately proportional to the square of the tube voltage change, while keeping a constant tube current (23). In order to keep the detector energy fluence constant for a 70 kg adult, the mAs values have to be increased 2.2-fold when the tube voltage is reduced from 120 to 100 kVp and the mAs values have to be increased even five-fold when reducing the tube voltage from 120 to 80 kVp (6, 22). In this study, the mAs values were only increased 1.2-fold for the 100-kVp protocol, compared to the 120-kVp protocol. Therefore, a 24% reduction of the radiation dose, from 10.2 to 7.8 mSv, could be obtained. Furthermore, by adding the ECG pulsing technique to the use of 100 kVp, the radiation exposure is expected to be more effectively reduced.
Another advantage of performing low-kilovoltage CT is that it enhances the iodine-induced contrast. For substantial enhancement of the iodine-induced contrast, low-kilovoltage CT compensates for the higher image noise and it reduces the required amount of iodine-based contrast material in the lower weight subjects (18). Improvement of the attenuation level is possible by approximating the K edge of iodine, which is at 33.2 keV. The commonly used settings of the X-ray tube kilovoltage in CT angiography are in the range of 120-140 kVp. These settings results in a representative photon energy level of approximately 66-72 KeV, and this also depends on the applied ray filtering. With the use of lower tube kilovoltage settings one would get closer to the situation for the maximum attenuation of iodine (i.e., a representative photon energy of 60 KeV for 100 kVp), and an increased signal response from the vessel-distributed iodine (19, 22).
The results of our objective measurements correspond well with those of an earlier study, which found no significant changes in the SNR and CNR while lowering the tube voltage from 120 to 100 kVp (19). Our study protocol that compared the 120-kVp protocol (120 kVp and 500 mAs) and the 100-kVp protocol (100 kVp and 620 mAs) revealed a 30% increase of image noise for the 100-kVp protocol. However, an 18.5% substantial increase of vessel contrast opacification for the 100-kVp protocol overcame the increased image noise, resulting in no significant differences for the SNR and CNR between the two protocols, regardless of the BMI category. According to a previous report by Huda et al, reducing the X-ray tube potential from 120 to 100 kVp would theoretically increase the image contrast relative to water approximately 26% for pure iodine (22), which is higher than that for the vessel-distributed iodine in our study.
Unexpectedly, on the subjective analysis of the paired images, readers showed a tendency to prefer the 100-kVp images and they designated as equal one-third of the paired images, especially for patients with a BMI less than 25, although this effect was diminished for the category of a BMI 25 or greater. These observations indicated that high vessel density not only compensates for high image noise, but it also affects the subjective image quality to a greater extent than does the background image noise level. We found that reducing the tube voltage from 120 to 100 kVp increased the averaged image noise from 30 to 39 HU and it improved the vessel density from 395 to 468 HU. Therefore, the readers did not perceive the difference of a 9 HU increase in image noise in many cases, but they could easily see an improvement of the contrast with a 73 HU increase in vessel density.
There were several limitations of this study. First, although we used gender- and BMI-matched data in order to minimize the confounding factors for obvious ethical reasons, we could not compare the signal and dose parameters in an intra-individual fashion. So, the size of the breasts of the females was not matched and thus, the differences in body habitus may have contributed to variations of the signal and noise measurements. However, we found no differences between the two groups when comparing the noise level on the pre-contrast images for calcium scoring, as well as any differences of the other parameters that represent the body habitus. Second, individual hemodynamic differences may have influenced our study results, even though the bolus tracking method was used for all the subjects in order to optimize the contrast-agent injection. Third, measuring the diagnostic accuracy for the detection of coronary artery disease was not performed. Therefore, we were not able to verify that high vessel density with the 100-kVp protocol would improve the accuracy of detecting coronary artery disease. Fourth, this study was carried out based on the data produced by a 16-slice MDCT, which is rather outdated in current cardiac CT practice. However, this study was not focused on the diagnostic performance for detecting coronary artery disease, but on the image quality analysis based on the interaction between X-rays and materials, and so the influence of the performance of different cardiac CT scanners might not be essential.
In conclusion, reducing the tube kilovoltage from 120 to 100 kVp allows a significant reduction of the radiation dose when adults are undergoing coronary CT, and this occurs without a significant change in the SNR and CNR.
 XML Download