

 PDF
PDF ePub
ePub Citation
 Print
Print


Making the diagnosis of in-stent restenosis by using multislice CT scanners with 16 or fewer detectors (1-7) is limited by such factors as blooming and streak artifacts. Sixty-four-detector row CT has recently been introduced for clinical use with its improved spatial and temporal resolution. The use of 64-detector row CT improves the visualization of the coronary stent lumen and the detection of in-stent stenoses (8-10). However, a considerable part of the stent lumen is not assessable even with 64-detector row CT (8, 9), and making the diagnosis of instent restenosis is difficult for stents with a smaller diameter.
Retrospective ECG-gated helical scans are mainly used for coronary CT angiography. The recent advances in CT scanners make it possible to use prospective ECG-gated axial scans for coronary CT angiography with employing 64-detector row CT, and this technique allows a reduced radiation dose as compared to the conventional retrospective ECG-gated helical scans (11). This mode of scanning will be widely performed on the new-generation multidetector CT scanners that are equipped with 256-320 detectors. On the other hand, helical artifacts and geometric distortion can occur with helical scans (12), and these weak points may reduce the visibility of small lesions such as in-stent restenosis of the coronary artery. Therefore, it is important to compare the image qualities between the prospective and retrospective ECG-gated scans. The hypothesis of the current study is that the prospective ECG-gated axial scans may be superior to the retrospective ECG-gated helical scans for the assessment of coronary stents with using 64-detector row CT. To the best of our knowledge, there has not been any previous research using prospective ECG-gated scans for coronary stent assessment. In this study, we evaluated its performance for the assessment of coronary stents, as compared with retrospective ECG-gated helical scans.
MATERIALS AND METHODS
Phantom Design
We made patent and stenotic vascular models with using three types of balloon expandable stents (Table 1). All the three stents used in the current study were the metallic frames of drug-eluting stents and they have comparatively thick struts. These stents were selected since the diagnosis of in-stent restenosis on CT is difficult for stents having a smaller diameter and thicker struts. For the vascular models, we used tubes made of ethylene-vinyl alcohol copolymer (Soanor; Nippon Synthetic Chemical Industry Co., Ltd., Tokyo, Japan) with an approximately 2.5-mm inner diameter and 0.5-mm thickness. The inner diameters of the tubes were measured ten times with a profile projector (Nikon V-12B; Nikon Co., Tokyo, Japan) to the nearest 100th of a millimeter. The average inner diameter was 2.60 mm. The attenuation value of the tube wall was 76 ± 8 Hounsfield unit (HU) (average ± standard deviation [SD]). The stents with a nominal diameter of 2.5-mm were implanted at the mid portion of the tubes; the stents were implanted using the attached delivery catheters. The stents were expanded by inflating the balloons of the catheters to 12 atm for a few minutes until the stents were fixed inside the tube, and the tubes were not deformed by the inflation.
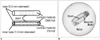
To create three vascular models without stenosis (the patent models) with using the three types of stent, we filled the stented tubes with contrast material (iohexiol [Omnipaque 300]; Daiichi Pharmaceutical Co., Ltd, Tokyo, Japan) diluted to 396 ± 7 HU (average ± SD) with using distilled water, and we closed both ends of the tubes (Fig. 1A).
We made three vascular models with stenosis (the stenotic models) as follows (Fig. 1A): We filled a tube made of ethylene-vinyl alcohol and that had a 1.0-mm inner diameter and a 0.5-mm wall thickness with contrast material diluted to 396 HU, and we fixed it in a stented tube filled with contrast material diluted to 79 HU for the three types of stents. In these models, the wall of the inner tube and the contrast material of 79 HU were regarded as the substances corresponding to neointima.
Each vascular model was fixed in a polypropylene cylinder (diameter: about 2.6 cm) filled with salad oil (CT attenuation: -120 ± 4 HU [average ± SD]), and the vascular model was located in parallel with the central axis of the polypropylene cylinder. We fixed the polypropylene container in a water-filled styrol spherical container (diameter: about 12 cm) with overlapping their central axes (Fig. 1B).
CT Scanning and Reconstruction
We placed the phantom in the scanner gantry with setting the vascular model parallel to the z-axis of the scanner on the horizontal plane. We used a 64-channel row CT scanner (Brilliance CT 64, Philips Medical Systems, Cleveland, OH). We used two types of cardiac scans with a simulated ECG of 60 beats per minute, and these scans were retrospective ECG-gated helical scans and a modified version of the calcium scoring prospective ECG-gated axial scans. For the prospective ECG-gated axial scans, the center of the data acquisition window was set at 70% of the R-R interval. The parameters were 64 × 0.625-mm collimation, 0.42-second per gantry rotation, a 50-cm diameter scan field of view (FOV) and 120-kV tube voltage. For the helical scans, a pitch of 0.2 was employed along with a tube current of 214 mA (resulting in a pitch-normalized value of 450 mAseff). The CT dose index was 26.5 mGy. For the axial scans, the calcium scoring protocol was modified as follows. We used a tube current of 500 mA resulting in an effective tube current-time product of 140 mAs. The CT dose index was 8.2 mGy. Additionally, slice reconstructions (slice thickness: 0.625 mm, slice interval: 0.625 mm) were obtained to make this approach suitable for stent assessment.
To compare image noise, we scanned a water-filled spherical phantom with a 12-cm diameter with using the two types of scans. We measured the attenuation values of water at the center of the spherical phantom by using a region-of-interest (ROI) technique. The diameter of the round ROI was 40 mm. The standard deviations of the attenuation values were 8.0 HU and 8.2 HU for the helical scan and the axial scan, respectively.
For reconstruction, we used two types of FOV (9 and 18 cm) for each type of CT scan, and the raw data were reconstructed with CD (bone) as the convolution kernel in a 512 × 512 pixel matrix. The 18-cm FOV reflects the clinical setting, and the pixel size of a 512 × 512 pixel matrix with a 9-cm FOV is equal to the size of a 1,024 × 1,024 pixel matrix with an 18-cm FOV. For the helical scans, the reconstructed slice thickness was 0.67 mm and the interval was 0.33 mm. The reconstructed images were transferred to a workstation (Virtual Place Advance, Version 2.0318; AZE Co., Ltd, Tokyo, Japan).
Visual Evaluation of In-Stent Stenosis
To assess the visibility of in-stent stenosis, a total of 24 stent images were evaluated in random order by one "blinded", experienced radiologist and two "blinded", experienced cardiologists. The vertical longitudinal reformations including the centerline of the stents, and cross-sectional reformations were used for the evaluation in a window width of 1,400 HU and a center of 500 HU, as compared with the unstented portion of the patent model. We have used this window setting clinically for stent evaluation. The thickness of the reformation images was 0.7 mm.
Stent patency was evaluated based on the visibility of the luminal low attenuation area that corresponded to the neointima. Each stent was evaluated as patent, possibly stenotic or definitely stenotic.
Diameter Measurement of the Stent Lumen
We measured the diameter of the stent lumen of the three types of patent vascular models for both scan types and both display FOVs. We used 20 cross-sectional reformation images with a 0.7-mm thickness and a 0.7-mm interval in a window width of 1,400 HU and a center of 500 HU. The diameter of the stent lumen was measured manually by using electronic calipers that measured to 0.01 mm. The measurement was done on the line parallel to the x-axis on each image. The measurement error was defined using the following equation: ME = DCT - (Dact-Dstr × 2), where ME is the measurement error, DCT is the inner diameter of the stent as measured on the CT image, Dact is the actual inner diameter of the tube as measured on the model and Dstr is the strut diameter of the stent. The artificial lumen narrowing was calculated using the following equation: ALN = (Dact-Dstr × 2-DCT) / (Dact-Dstr × 2), where ALN is the artificial lumen narrowing, DCT is the inner diameter of the stent as measured on the CT image, Dact is the actual inner diameter of the tube as measured on the model and Dstr is the strut diameter of the stent.
Average of the Attenuation Values Inside the Stents
We assessed the average attenuation values inside the three types of patent vascular models for both scan types and both display FOVs. We used the vertical longitudinal reformations that included the centerline of the stents for the evaluation.
We measured the attenuation values inside the visible stent lumen using an ROI technique. The size of the rectangular ROI was 1.0 × 15 mm. The thickness of the reformation images was one voxel width.
CT Attenuation Profile on Cross Section
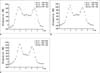
To assess the effects of blooming artifacts on the luminal CT attenuation, we assessed the CT attenuation profiles on the cross section of the stenotic vascular models with the three types of stent by using an axial scan with an 18-cm FOV, and by using axial and helical scans with a 9-cm FOV. For each stent, we selected one cross section in which the stent struts were most clearly visible. On the cross section, we measured the CT attenuation on the line passing the centers of the lumen and one strut. The thickness of the cross section images was one voxel width.
Statistical Analyses
For both the diameter measurement and the attenuation measurement of the stent lumen, we used two-way analysis of variance with repeated measures to assess the effects of the scan type and the size of the FOV on the measurement error for each kind of stent. To compare parameters, Scheffe tests were used as the post tests following the analyses of variance with repeated measures. A p value < 0.05 was considered to represent a statistically significant result.
RESULTS
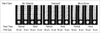
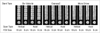
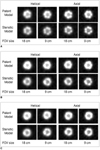
Figures 2 and 3 show the longitudinal and cross-sectional reformations of the patent and stenotic vascular models, respectively. Fig. 4A-C show the magnified views of the cross-sectional reformations of the patent and stenotic models.
Visual Evaluation of In-Stent Stenosis
The results of evaluating the stenosis for the vascular models by the three readers are summarized in Table 2. All the patent models were correctly diagnosed with the two types of scan methods with using each FOV. For all the stenotic models, a luminal low attenuation area corresponding to the neointima was definitely visible with using an axial scan with a 9-cm FOV. Using an axial scan with an 18-cm FOV, stenosis was definitely visible for two of the stenotic models, while it was equivocal for the other stenotic model. With using the helical scans, the luminal low attenuation area could not be detected for almost any of the stents.
Diameter Measurement of the Stent Lumen
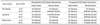
The inner diameters of the vascular models were underestimated by CT angiography with mean measurement errors of -1.10 to -1.36 mm (Table 3). For each type of stent, the mean measurement error for the axial scan was less than that for the helical scan, and the mean measurement error for the 9-cm FOV was less than that for the 18-cm FOV.
No interactions were found among the combinations of the factors for each type of stent (Bx-Velocity, p = 0.8058; Express2, p = 0.2442; Micro Driver, p = 0.4505), according to two-way analysis of variance. There were significant differences in the measurement errors between the two types of scans (Bx-Velocity, p < 0.0001; Express2, p < 0.0001; Micro Driver, p = 0.0004) and the two sizes of the FOV (all stents: p < 0.0001), according to the Scheffe tests.
Average of the Attenuation Values Inside the Stents
We summarized the effects of the types of scan and the size of the FOV on the CT attenuation inside the stents of the patent vascular models in Table 4. The luminal attenuation values were overestimated by CT angiography.
For each type of stent, the mean luminal attenuation value for the axial scan was smaller than that for the helical scan, while the mean luminal attenuation values for the 9-cm FOV tended to be smaller than those for the 18-cm FOV.
No interactions were found among the combination of the factors for each type of stent (Bx-Velocity, p = 0.6929; Express2, p = 0.1306; Micro Driver, p = 0.0919) by the two-way analysis of variance. There were significant differences in the luminal attenuation values between the two types of scan (all stents: p < 0.0001) by the Scheffe tests. There were significant differences in the luminal attenuation values between the two sizes of the FOV for Express2 (p = 0.0286) and Micro Driver (p < 0.0001) by the Scheffe tests, while there was no significant difference for Bx-Velocity (p = 0.8737).
CT Attenuation Profile on the Cross Section
On the profile curves of the stenotic models, the slopes of the profile curves corresponding to the boundary of the stent and the lumen were steeper with using axial scans, as compared with using the helical scan (Fig. 5). A peak corresponding to the patent lumen was seen at the center of the stent lumen and this was surrounded by the lower attenuation corresponding to intimal hyperplasia with using the axial scan with a 9-cm FOV, while such a peak was not seen with using a axial scan with an 18-cm FOV and a helical scan with a 9-cm FOV.
DISCUSSION
Recent studies have demonstrated that 64-detector row CT performs well for the detection of coronary stent stenosis. Carbone et al. (13) evaluated the ability of 64-detector row CT to assess the coronary artery stent patency, and the sensitivity, specificity, positive predictive value and negative predictive value were 75, 86, 71 and 89%, respectively. However, nine of the 12 stented segments of 2.5-mm diameter and 10 of the 23 stented segments of 2.75-mm diameter were excluded from the analysis since these segments were considered as non-evaluable due to blooming artifact. In another recent study, Oncel et al. (14) also showed good performance of 64-detector row CT for the detection of coronary stent stenosis, and the sensitivity, specificity, positive predictive value and negative predictive value were 89, 95, 94 and 90%, respectively. However, the stents with a diameter ≤ 2.5 mm were excluded from their analyses and the average stent diameter was 3.1 ± 0.4 mm. In their study, all the nine occluded stents were correctly demonstrated, while only eight of the 10 non-occlusive stenotic stents were correctly diagnosed on CT. In another recent study by Rist et al. (15), both of the two occluded coronary stents were correctly identified, while two of the six stents with non-occlusive stenoses were misdiagnosed as patent. The diameters of these two misdiagnosed stents were 2.5 and 3.0 mm, respectively. These findings indicated that non-occlusive in-stent stenoses were undetected in some cases, and especially for stents with a smaller diameter, even with using 64-detector row CT. That agrees with our findings that the luminal low attenuation area could not be detected with retrospective ECG-gated helical scans.
Blooming from high-attenuation material, such as stent struts, causes artificial lumen narrowing (1-10, 16-18). Seifarth et al. (8) reported that the artificial lumen narrowing due to blooming artifact was about 40% for stents with a 3-mm diameter and with using 64-detector row CT. Another study by Mahnken et al. (9) showed that the average visible lumen was about 53% for stents with a 3-mm diameter and with using 64-detector row CT. In addition, the blooming artifacts can mask the intimal hyperplasia, as shown in our study, on the CT attenuation profile with using a helical scans, since the blooming artifacts from the stent struts raise the luminal CT attenuations of several adjacent pixels. However, the slope of the profile curve corresponding to the boundary of the stent and the lumen was steeper with using the axial scans that had a 9-cm FOV, and the less blooming artifacts did not mask the darker rim between the stent and the patent lumen.
Retrospective ECG-gated helical scans are mainly used for coronary CT angiography. The recent advances in controlling X-ray generation and the movements of the patient's table and real-time ECG signal monitoring make it possible to use prospective ECG-gated axial scans for coronary CT angiography (11). Prospective gating automatically triggers axial scan acquisitions by using the patient's ECG signal. This technique allows a significant reduction in the radiation dose as compared to the conventional retrospective ECG-gated helical scans. Using prospectively-gated axial scans, we were able to obtain nearly a 70% reduction in the radiation dose, while at the same time, we improving the visualization of coronary stents via the reduced blooming artifacts. Furthermore, visual detection of the non-occlusive stenoses was possible for stents with a diameter of 2.5 mm. This would expand the indication of CT angiography for making the diagnosis of in-stent restenosis since the non-occlusive stenoses inside the stents of this size were sometimes undetected even with using 64-detector row CT and retrospective ECG-gated helical scans, as was mentioned above.
Several factors contribute to the reduction of blooming artifacts by the use of prospective ECG-gated axial scans. First, the data obtained on the axial scan uses real data acquired at the actual position of the slice versus interpolated data, as is used on the spatial acquisition. This is especially important for smaller objects that can be approximated due the interpolation of data. Second, the prospective axial scan uses a 180-degree fan beam angle, so the sampling has higher resolution as compared to the retrospective helical scans that uses interpolated 180-degree data.
The use of a 9-cm FOV is also effective to improve the visualization of the stent lumen and the accuracy of the diameter measurement as compared to the use of an 18-cm FOV. The spatial resolution increases when using a smaller FOV. With the increased spatial resolution in a 9-cm FOV, the inner diameter is delineated relatively better as compared to an 18-cm FOV, and so this provides better visibility and thus less measurement error.
CT attenuation profiles are useful to assess the visibility of small structures such as stented coronary arteries since the profiles are not affected by the window setting (4). The slope of the profile curve corresponding to the boundary of an object is steep, which means that the margin of the object is distinct. On the CT attenuation profile, we can also recognize the range and strength of the blooming artifact from a structure with high attenuation by the degree of the increase in the CT attenuation values of the pixels adjacent to the structure. In the current study, the luminal attenuation profiles showed that the luminal CT attenuation values were higher than the expected values even at the luminal center. This meant that the blooming artifact spreads over the entire lumen inside the 2.5-mm stents. However, the increase in luminal CT attenuation values did not necessarily mask the in-stent stenosis. As shown on the profile curves of the stenotic vascular models, a peak corresponding to the patent lumen was seen at the center of the stent lumen and this was surrounded by the lower attenuation corresponding to intimal hyperplasia with using an axial scan with a 9-cm FOV, while such a peak was not seen with using an axial scan with an 18-cm FOV.
This study has some limitations. First, we used only three kinds of stents. However, the small number of stents was sufficient to present the performance of the prospective ECG-gated axial scans for the assessment of coronary stents. All the three stents in this study are metallic frames of drug-eluting stents, with comparatively thick struts. Since the blooming artifacts are correlated to the strut diameter (6), the blooming artifacts will be stronger for these stents. In an in vitro study of 68 different stents by Maintz et al. (18), the median strut thickness was 0.1 mm. Thus, these results will be also applicable to many kinds of stent.
Second, we used static vascular models. The image quality of the stents is very sensitive to the cardiac motion (19, 20), and the temporal resolution of the prospective ECG-gated axial scans is as long as half of the gantry rotation time. Therefore, appropriate patient selection by heart rate is needed for clinical use of prospective ECG-gated axial scans. Further studies are required to evaluate the effects of noise, heart rate, the density of the contrast medium, the FOV and the window setting on the accuracy of evaluating in-stent stenosis.
Third, we used a window setting of 1,400-HU width and 500-HU center, the window setting affects the visualization of the stent lumen. However, the current study includes assessment based on the CT attenuation profile, which is not affected by the window setting.
Fourth, we used a modified calcium scoring protocol, where thin-slice reconstructions were obtained through simple parallel beam approximations. Dedicated step and shoot protocols with thin-slice imaging are now being developed, and these protocols that take into account the cone-beam geometry of the x-rays, resulting in an improvement in image quality.
In conclusion, the visualization of coronary stents may be improved by the use of prospective ECG-gated axial scans and using a small FOV with reduced blooming artifacts and increased spatial resolution.


 XML Download