Journal List > Korean J Radiol > v.1(4) > 1026283

Kim, Kim, Han, Kim, Lee, Park, Kim, and Choi: Hepatic Hemangiomas: Spectrum of US Appearances on Gray-scale, Power Doppler, and Contrast-Enhanced US

Abstract

Because US plays a key role in the initial evaluation of hepatic hemangiomas, knowledge of the entire spectrum of US appearances of these tumors is important. Most hemangiomas have a distinctive US appearance, and even with those with atypical appearances on conventional gray-scale US, specific diagnoses can be made using pulse-inversion harmonic US with contrast agents. In this essay, we review the spectrum of US appearances of hepatic hemangiomas on conventional gray-scale, power Doppler, and pulse-inversion harmonic US with contrast agents.

Cavernous hemangiomas are the most common benign tumor of the liver, and are not infrequently encountered incidentally during US screening. Because the vast majority of hepatic hemangiomas are asymptomatic and require no treatment, they must be differentiated from hepatic malignancies. Most have a distinctive US appearance (1-4) but some, known as atypical hemangiomas, show various US patterns (5-8). For the differentiation of the atypical variety, dynamic contrast-enhanced studies have been widely employed. Using microbubble contrast agents, it has been shown that pulse-inversion harmonic US can effectively depict the typical enhancement patterns of hepatic hemangiomas (9), enabling specific diagnosis. In this essay, we review the spectrum of US appearances of these hemangiomas as seen on conventional gray-scale, power Doppler, and pulse-inversion harmonic US with contrast agents.

Conventional Gray-Scale US

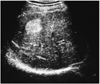
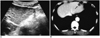
The most common and generally accepted 'typical' US features of hepatic hemangiomas are their small size, uniform hyperechogenicity, well-defined margin, and posterior echo enhancement (1-3) (Fig. 1). In addition, follow-up scanning only rarely shows a change in size, appearance, or detectability (4). Their distinctive appearances at US are considered to be due to histological characteristics. They are usually composed of large blood-filled cavernous spaces, lined by a single layer of flat endothelial cells and separated by fibrous septa; multiple interfaces between the walls of the sinuses and the blood within them account for the typical hyperechogenicity seen at US (4). The enhanced through-transmission observed in many cases reflects the low acoustic impedance of blood-filled spaces and tends to occur in hemangiomas larger than 25 mm (2).
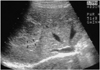
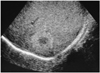
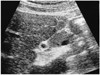
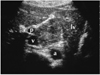
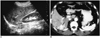
Because hemangiomas may undergo various changes including internal hemorrhage with necrosis, thrombosis, myxomatous change, fibrosis, and- rarely- calcification as they become larger (1, 4), 'atypical' US features are frequently seen in larger ones. Unlike a typical hemangioma, one that is atypical has an internal echo pattern at least partially hypoechoic; a hyperechoic mass with a hypoechoic central portion or decreased echogenicity can be seen throughout the entire lesion (Figs. 2, 3, 4, 5, 6, 7). The most suggestive US feature of this type of hemangioma is an echogenic border, seen as a thick echogenic rind or thin rim around a tumor (4) (Figs. 2 and 6). Although the prevalence of atypical hemangioma has not been precisely determined, it seems that approximately 20-40% of hemangiomas are of this kind (4, 5).
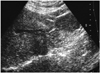
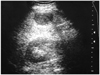
The echogenicity of hepatic parenchyma influences the US appearance of a hemangioma. Because of the increased echogenicity of attenuating fatty liver parenchyma, diffuse fatty infiltration may lead to an atypical echo-poor appearance (6) (Fig. 8). If a 'typical' hemangioma is present in a liver in which fatty infiltration has occurred, its US appearance will be altered. The lesion will initially appear less hyperechoic than isoechoic, and finally hypoechoic relative to infiltrated liver. Fatty infiltration of the liver may also cause obscuration of the echogenic border around the tumor (5).
It has recently been shown that the speed of contrast enhancement occurring during incremental dynamic CT or multiphase dynamic MR imaging provides a basis for predicting the echo pattern at US, and vice versa. On dynamic CT or MR images, sonographically hypoechoic hemangiomas tend to show rapid enhancement, but if hyperechoic, they tend to enhance slowly (7, 8) (Figs. 9 and 10).

Power Doppler US

As techniques for evaluating the vascularity of various organs and diseases, color and power Doppler US have recently shown promise. Since power Doppler US is superior to color Doppler US in detecting slow flow, it has been used in atempts to diagnose hepatic hemangiomas specifically on the basis of their typical hemodynamic features. Though it was initially believed that power Doppler is able to depict slow flow within hemangiomas (10), it has been suggested that homogeneous noise from highly reflective interfaces can be misinterpreted as true flow (11). To avoid these false signals, power Doppler parameters must therefore be optimized. A recent study in which a Doppler phantom/flow control system and a 2-4 MHz transducer were used found that for determining the vascularity of hyperechoic tissue, a pulse repetition frequency of 1,000 Hz and a medium wall filter were adequate. Using these optimized parameters, the majority of hepatic hemangiomas produced either no power Doppler signal or one that was minimal (12) (Fig. 11A).

Power Doppler US with a Contrast Agent

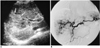
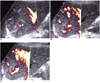
The majority of hepatic hemangiomas show a typical enhancement pattern: peripheral nodular or globular enhancement during the bolus dynamic phase and centripetal fill-in and persistent enhancement during the delayed phase, and for this reason, dynamic contrast-enhanced CT or MR imaging has been widely used for diagnosis. Since microbubble contrast agents for US have become available, the efficacy of these for the characterization of focal hepatic lesions has been the subject of numerous investigations (9, 13-15). In hepatocellular carcinoma, the use of contrast agents greatly increases intratumoral Doppler signals (13, 14), but in hemangiomas, the use of power Doppler US with microbubble agents reveals either no internal vascularity or sparse peripheral flow (13, 15) (Fig. 11). Due to its lack of sensitivity in detecting slow flow in hemangiomas, power Doppler US can not therefore, be used for the specific diagnosis of hepatic hemangioma, even with the use of microbubble agents (15).

Pulse-Inversion Harmonic US with a Contrast Agent

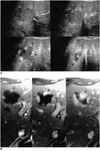
Pulse-inversion harmonic US is a newly introduced technique for displaying the amplitude of second harmonic signals resulting from non-linear echoes. In contrast to power Doppler US, pulse-inversion harmonic US with interval delay scanning can provide strong gray-scale enhancement by microbubble contrast agents and detect signals from microbubbles in very slow flow without Doppler-related artifacts. It has recently been shown that this technique can depict the typical enhancement patterns of three different types of liver lesions: hemangiomas, metastases, and hepatocellular carcinomas. While most hemangiomas (95%) show peripheral globular or rim-like enhancement with progressive centripetal fill-in, malignant tumors do not show this pattern (9) (Fig. 12). Pulse-inversion harmonic US with interval delay scanning using a contrast agent is therefore believed to be potentially useful for the specific diagnosis of hepatic hemangiomas by demonstrating their characteristic enhancement features.

CONCLUSION

In the diagnosis of hepatic hemangiomas, the most important aspect is non-invasive differentiation from other tumors. Since US plays a key role in the initial evaluation of these hemangiomas, knowledge of the spectrum of those that are atypical is important and can help avoid most diagnostic errors. At the same time, however, in most cases of hemangioma with atypical sonographic features a specific diagnosis can be established by means of dynamic contrast-enhanced studies such as CT or MR imaging. Because pulse-inversion harmonic US with interval delay scanning using a contrast agent is also believed to be potentially useful for the specific diagnosis of hepatic hemangiomas by demonstrating their characteristic enhancement features, simple and immediate characterization of a focal hepatic lesion newly detected by initial US examination is possible.

Figures and Tables

Fig. 1
A 36-year-old man with a hepatic hemangioma showing typical US features including uniform hyperechogenicity, well-defined margins and posterior sonic enhancement (arrows).
kjr-1-191-g001
Fig. 2
A 46-year-old man with a hepatic hemangioma in the right lobe. Transverse US shows a well-defined large mass of heterogeneous echogenecity with hypoechoic foci. A thin echogenic rim seen around the tumor (arrowheads) suggests hepatic hemangioma.
kjr-1-191-g002
Fig. 3
A 42-year-old man with a hepatic hemangioma in the right lobe. Oblique sagittal US shows a well-defined hyperechoic lesion with a hypoechoic central portion.
kjr-1-191-g003
Fig. 4
A 60-year-old woman with a hepatic hemangioma in the left lobe. Transverse US demonstrates contour bulging; the mass is subtly hypoechoic (arrows) relative to normal liver parenchyma and lacks an echogenic border.
kjr-1-191-g004
Fig. 5
A 66-year-old man with a diffuse hemangioma in the right lobe.
A. Transverse US shows a large heterogeneous mass (arrows). The major portion of the lesion shows hyperechogenicity, especially in the periphery, and within it scattered hypoechoic foci are noted (arrowheads). Although the lesion abuts the right portal vein, there is no evidence of invasion of this vessel.
B. Celiac angiogram shows diffuse enhancement with scattered foci of contrast material puddling.
kjr-1-191-g005
Fig. 6
A 49-year-old man with a hepatic hemangioma in the left lobe. Sagittal US shows a small isoechoic mass detectable only by its echogenic border (arrows) and subtle contour bulging.
kjr-1-191-g006
Fig. 7
A 34-year-old woman with an exophytic hepatic hemangioma in the caudate lobe. Transverse US shows a large square-shaped mass surrounded by the left lobe of the liver (lv), aorta (a), inferior vena cava (v), and right portal vein (p). The lesion shows heterogeneous echogenicity and has a multiple internal hypoechoic portion.
kjr-1-191-g007
Fig. 8
A 51-year-old man with a hepatic hemangioma in the right lobe. Transverse US shows increased liver echogenicity, suggestive of diffuse fatty infiltration, and an atypical echo-poor hemangioma. There is no discernable echogenic border.
kjr-1-191-g008
Fig. 9
A 51-year-old man with a hepatic hemangioma in the left lobe.
A. Transverse US shows a slightly hyperchoic mass with a well-defined margin (arrow).
B. Enhanced CT of the liver during the portal venous phase shows bright dot-like enhancement (arrow) in the periphery of the lesion.
kjr-1-191-g009
Fig. 10
A 55-year-old woman with a hepatic hemangioma in the right lobe.
A. Sagittal US shows a well-defined hypoechoic mass (arrow).
B. Enhanced CT scan of the liver obtained during the hepatic arterial phase shows diffuse rapid enhancement of the tumor (arrow) with peritumoral wedge-shaped parenchymal enhancement (arrowheads), suggesting associated arterioportal shunt.
kjr-1-191-g010
Fig. 11
A 54-year-old woman with a hepatic hemangioma in the right lobe.
A. Unenhanced power Doppler US shows a hypoechoic mass with an echogenic border (arrows). The lesion shows minimal power Doppler signal in its periphery (open arrow) and optimized parameters (a pulse repetition frequency of 1,000 Hz and a medium wall filter).
B, C. Dynamic contrast-enhanced power Doppler US scans obtained 30 seconds (B) and 90 seconds (C) after the initiation of contrast injection show dot-like enhancement (small arrows) at the periphery of the mass. However, unlike centripetal fill-in enhancement, characteristic of hemangioma, the enhanced area revealed by power Doppler US is smaller 90 seconds after enhancement than at 30. Even with the use of microbubble agents, power Doppler US is, therefore, due to its insensitivity to slow flow, able to characterize hepatic hemangiomas to only a limited extent.
kjr-1-191-g011
Fig. 12
A 52-year-old man with two hepatic hemangiomas in the left lobe.
A. Pulse-inversion harmonic US scans obtained prior to contrast injection show a hypoechogenic hepatic hemangioma (arrow) in the medial segment of the left lobe. Serial contrast-enhanced US scans obtained 14, 62, and 139 seconds after injection show peripheral globular enhancement with progressive centripetal fill-in (arrowheads).
B. Serial dynamic contrast-enhanced T1-weighted MR images obtained immediately, 60, and 180 seconds after the administration of gadolinium-DTPA depict early peripheral nodular and globular enhancement with progressive centripetal fill-in (arrowheads), characteristic of hepatic hemangiomas. The enhanced areas seen on MR images are nearly identical to those seen on serial contrast-enhanced pulse-inversion harmonic US scans.
kjr-1-191-g012

References

1. Mirk P, Rubaltelli L, Bazzocchi M, et al. Ultrasonographic patterns in hepatic hemangiomas. J Clin Ultrasound. 1982. 10:373–378.
2. Taboury J, Porcel A, Tubiana JM, Monnier JP. Cavernous hemangiomas of the liver studied by ultrasound: enhancement posterior to a hyperechoic mass as a sign of hypervascularity. Radiology. 1983. 149:781–785.
3. Friedman AC, Frazier S, Hendrix TM, Ros PR. Friedman AC, Dachman AH, editors. Focal disease. Radiology of the liver, biliary tract and pancreas. 1994. St. Louis: Mosby;169–327.
4. Gibney RG, Hendin AP, Cooperberg PL. Sonographically detected hepatic hemangiomas: absence of change over time. AJR. 1987. 149:953–957.
5. Moody AR, Wilson SR. Atypical hepatic hemangioma: a suggestive sonographic morphology. Radiology. 1993. 188:413–417.
6. Marsh JI, Gibney RG, Li DKB. Hepatic hemangioma in the presence of fatty infiltration: an atypical sonographic appearance. Gastrointest Radiol. 1989. 14:262–264.
7. Chang J, Han K. Relation of internal echo patterns and hemodynamics by incremental dynamic CT in hepatic cavernous hemangioma. J Korean Radiol Soc. 1993. 29:775–782.
8. Yu JS, Kim MJ, Kim KW, et al. Hepatic cavernous hemangioma: sonographic patterns and speed of contrast enhancement on multiphase dynamic MR imaging. AJR. 1998. 171:1021–1025.
9. Kim TK, Choi BI, Han JK, Hong HS, Park SH, Moon SK. Hepatic tumors: contrast agent enhancement patterns with pulse-inversion harmonic US. Radiology. 2000. 216:411–417.
10. Choi BI, Kim TK, Han JK, Chung JW, Park JH, Han MC. Power versus conventional color Doppler sonography: comparison in the depiction of vasculature in liver tumors. Radiology. 1996. 200:55–58.
11. Young LK, Yang WT, Chan KW, Metreweli C. Hepatic hemangiomas: quantitative color power US angiography-facts and fallacies. Radiology. 1998. 207:51–57.
12. Kim TK, Han JK, Kim AY, Park SJ, Choi BI. Signal from hepatic hemangiomas on power Doppler US: real or artefactual? Ultrasound in Med and Biol. 1999. 25:1055–1061.
13. Lopez-Ben R, Robbin ML, Weber TM, Smith JK, Needleman L, Berland LL. Doppler sonographic enhancement of hepatic hemangiomas and hepatocellular carcinomas after perflenapent emulsion: preliminary study. J Ultrasound Med. 1999. 18:109–116.
14. Kim AY, Choi BI, Kim TK, et al. Hepatocellular carcinoma: power Doppler US with a contrast agent-preliminary results. Radiology. 1998. 209:135–140.
15. Kim TK, Han JK, Kim AY, Choi BI. Limitations of characterization of hepatic hemangiomas using a sonographic contrast agent (Levovist) and power Doppler ultrasonography. J Ultrasound Med. 1999. 18:737–743.
TOOLS
Similar articles