

 PDF
PDF ePub
ePub Citation
 Print
Print


The many advantages of contrast-enhanced magnetic resonance (MR) angiography over the conventional flow-related type include shorter acquisition time, less in-plane spin saturation, the fact that choice of acquisition plane dose not depend on flow, and the absence of flow or susceptibility artifacts (1-7). Along with the development of higher performance gradients which can acquire three-dimensional images within 40 seconds, the procedure has been improved (4, 5), and good results have been obtained at various anatomical locations including the cerebral vasculature, aorta, portal vein, and extremities (8-12). In order to improve image quality still further, acquisition protocols which address the variables of scanning sequences, post-processing techniques, dose and injection techniques, acquisition time, and scan timing are still being developed (1-5, 13-17).
Several methods have been developed for acquiring the middle of image acquisition during arterial peak enhancement time, using a contrast bolus. In these techniques, a bolus injection of test-dose is used to measure arterial peak enhancement time. In order to compensate for the potential mismatch of peak enhancement times between the longer main bolus and shorter test bolus, seconds are added to the arterial arrival time of the test bolus by way of the constant or variable dependent on the duration of injection (1, 4, 14). In methods using the injection duration-dependent variable, it is a precondition that the duration of injection equals the time-length of the contrast bolus (1, 4). There is, however, some doubt about whether this duration and the span of the main bolus are equal (1). Our experience has shown that it is difficult to predict main bolus length by the injection duration method. Spans of either a test or main bolus in systemic arteries have been much longer than injection durations, and the ratios between length of bolus and injection duration have been subject to great individual variation. Consequently, in order to optimally calculate scan delay time, the need for a method more effective than that of injection duration has arisen.
We hypothesize that because it can be accurately measured and is patient-specific according to the test bolus administered, arteriovenous circulation time is a more useful factor for determining exact scan timing than bolus length or injection duration. Because it can eliminate the effects of venous enhancement, the use of MR angiography during arteriovenous circulation time permits the acquisition of pure arterial phase images. Furthermore, a knowledge of venous over-projection time enables us to set acquisition time in such a way that image resolution can be improved. In the method using the injection duration-dependent variable, on the other hand, the shortest acquisition time compatible with good resolution should be chosen, thus avoiding venous over-projection. As far as we know, no scan timing method based on arteriovenous circulation time has yet been reported in the literature.
The purposes of this study were to test a new acquisition timing scheme and to evaluate it by retrospective comparison with the traditional timing method using injection duration as a parameter.
MATERIALS AND METHODS
Timing Methods
The most commonly used traditional timing method for MR angiography utilizes a formula based on arterial peak-enhancement time and injection duration (4). With this method, the midpoint of acquisition occurs when half the duration of the main bolus injection has elapsed after arterial peak enhancement time of the test-bolus, thus coinciding with the time of peak arterial enhancement of the main bolus, as described by the formula:

where Td = scan delay time, Tp = arterial peak enhancement time, Ti = duration of contrast injection, Ta = acquisition time
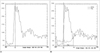
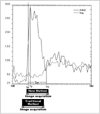
Using this formula, all parameters are variables specific to each patient and the scanning protocol used, and arterial peak enhancement time can be determined from the time-intensity curve by test-bolus study (Fig. 1A). The duration of contrast injection and the acquisition time can be obtained from the scanning parameters.
The formulae used for the new timing method utilized in this study were as follows:

where Tae = arterial enhancement time, Tav = arteriovenous circulation time, Tve = venous enhancement time
This method is based on the arteriovenous circulation time rather than the duration of contrast injection. Arteriovenous circulation time was defined as the span of the arterial enhancement period before the subsequent venous enhancement, and arterial or venous enhancement time was arbitrarily defined as the time at which the artery or vein shows its half-maximum intensity. The safe window, occurring during arteriovenous circulation time, was considered to be the best time for acquiring arteriographic data. This new method thus centers the midpoint of acquisition time at the midpoint of the safe window, as defined above. The time up to the midpoint of the safe window (scan delay time) equals arterial enhancement time plus half arteriovenous circulation time, both of which can be measured on time-intensity curves by means of a test-bolus study (Fig. 1B).
Subjects
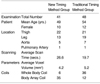
The results of 89 contrast-enhanced MR angiographic examinations performed in 47 patients were retrospectively analyzed. These included MR angiograms of the thigh (n = 43), the leg (n = 32), the aorta (n = 12), and the pulmonary artery (n = 2); the patients comprised 38 men and 12 women aged between 17 and 91 (mean, 53) years. In all cases the findings were used for the diagnosis, surgical planning, or postoperative follow-up of obliterative vascular disease. Major surgery performed for the treatment of vascular disease involved vascularized fibular graft for osteonecrosis of the femoral head, and bypass graft or intraluminal stent graft for obstructive vascular disease. Thirty-three patients underwent more than one examination, namely multiple station angiography during the same session (n = 29) or follow-up angiography (n = 5). One patient underwent both procedures. All multiple station angiography involved the lower extremities in order to cover the area between the abdominal aorta and the distal tibial arteries, 25 angiograms were performed in two stations and four in three stations. Forty-eight examinations utilized the traditional timing method using equation [1], and 41 the new arteriovenous circulation time method using equation [2]. With regard to examination sites and demography of patients, there were no significant differences between the two groups (Table 1).
MR Imaging
To determine scan starting time, a test-bolus injection study was performed. Two milliliters of gadodiamide (Omniscan, Nycomed Imaging AS, Oslo, Norway) was administered by a power injector (Medrad, Indianola, Pa., U.S.A.) at a rate of 3 mL / sec, followed by 20 mL of normal saline flushed at the same rate. Repeated single slice acquisitions were performed at or near the target site, and coincided with the start of contrast injection. For image acquisition, a 1.5T MR scanner (Magnetom Vision Plus, Siemens, Erlangen, Germany) was used, with a two-dimensional turbo fast low angle shot (FLASH) sequence (TR = 8.5 msec, TE = 4.0 msec, FA = 10°, and NEX = 1). Temporal resolution was one second and acquisition continued for 120 seconds (two subsequent 60-second acquisitions without intermission). Except for pulmonary vascular examinations, breath holding was not required during acquisition. For pulmonary arteriovenous time-intensity analysis, respiration was interrupted for the first 30 seconds, and for the remaining 30 seconds normal breathing was resumed. In our study, pulmonary arterial and venous enhancement occurred within the initial 60-second period, and for this reason, no further acquisition was performed. This test-bolus study protocol was used for both the traditional and the new timing methods.
For MR angiography, image acquisition involved the use of a 1.5T MR scanner, with a three-dimensional turbo FLASH sequence. The imaging parameters used were TR = 4.0 msec, TE = 1.6 msec, FA = 30°, and NEX = 1. In all cases, the frequency encoding number was 256, while that of phase encoding varied from 100 to 250, according to the field of view. Slice thickness ranged from 0.9 to 3.0 (average, 1.6) mm, and the range of voxel volume was 1.6 to 9.0 (average, 4.6) mm3. Image acquisition time was 10 to 36 (average, 22) seconds. The number of RF coils used varied according to FOV desired. Where examinations involved a lower extremity and aorta, either a body array or whole body coil was selected. The former was chosen if a higher signal-to-noise ratio (SNR) was required, although its length of coverage was shorter than that of the whole body coil. In the new method, a surface coil was used more frequently than a whole body coil, and the reduced voxel volume resulted in increased scan time (Table 1). During MR angiography of each station, 0.1 mmol / Kg of contrast medium was administered. Using a power injector (Medrad, Indianola, Pa.), this was injected into a superficial vein of the upper extremity at a rate of 3 mL / sec. To push the tail of the contrast bolus, 20 mL saline was then injected at the same rate.
After the acquisition of non-enhanced mask images, contrast-enhanced images were obtained by two- or three-phasic study (two consecutive arterial phases with or without a 50-second delayed venous phase). The first phase began at the calculated delay time for visualization of arterial enhancement, while the second was acquired subsequent to the first, with no interscan delay. A third image, 50 seconds after completion of the second phase, was sometimes acquired. This third phase was added when the venous phase was needed in spite of the decreased resolution which resulted from the limited numbers of matrix and partitions available for the third phase.
In the case of a lower extremity, a two- or three-station study was needed in order to acquire images from the ankle up to the iliac bifurcation or infrarenal abdominal aorta. Generally, after the acquisition of the first station at the leg, the second station, for the thigh, was acquired 10 to 20 minutes later. The third station, for the abdominal aorta, was acquired in the same way as the second.
In 24 cases, regardless of the timing method used and in order to avoid a possible decrease in arterial signal intensity by subtraction non-enhanced mask images were acquired prior to test-bolus injection. After subtraction of these images, however, there was no qualitative improvement in image quality. Additionally, more background enhancement was seen than in the studies in which mask images were acquired after test-bolus study, and in subsequent cases, mask images were therefore acquired after such a study had been conducted.
Postprocessing and verification
After reconstruction of the acquired raw data, subtraction images were obtained from contrast-enhanced images subtracted by non-enhanced mask images. Maximum intensity projection (MIP) was subsequently performed. This post-processing was performed during both the first and second arterial imaging phase. The two images were compared and the better one from the viewpoint of arterial enhancement was selected as the arterial-phase image. We counted the number of examinations in which the first-phase image was considered to be suboptimal because of insufficient arterial enhancement, and these mismatched cases were classified as the "early timing" group. Cases showing optimal arterial enhancement during the first phase were, on the other hand, assigned to the "good timing" group, and the number of "early timing" cases was compared between the traditional and new timing methods. In this study, because a calculated delay time was used for the first-phase acquisition, without an earlier phase, delayed acquisition of the first arterial phase could not be controlled. Only the earlier acquisition of the first phase was, therefore, regarded as a mismatched error.
In the 41 cases studied by the new method, traditional scan delay time could also be calculated using the arterial component of the time-intensity curve. The new and traditional scan delay times were later compared mathematically during each examination.
RESULTS
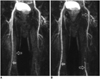
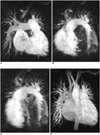
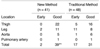
Among the 48 studies performed using the traditional timing method, 17 cases demonstrated an insufficiently enhanced first arterial-phase image due to the early timing of data acquisition (Table 2, Fig. 2). In these cases, second phase images were, therefore, used as arterial-phase images, despite the presence of some venous over-projection. In contrast, among the 41 studies performed using the new timing method, only two first-phase images could not be used as arterial phase images. First-phase images with good timing were obtained in 31 of 48 studies using the traditional method (65%), and 39 of 41 using the new method (95%), and using Fisher's exact test, these results showed significant differences between the two methods (p < .001) (Table 2, Fig. 3).
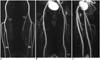
In 10 of the 17 inadequate first phase images obtained by the traditional method, target vessels during test-bolus study and MR angiography were not identical. In ten MR angiographic examinations of the leg, test-bolus studies were performed at a remote area such as the common iliac vessels or infrarenal abdominal aorta. Likewise, both of the two mismatched cases studied using the new method were angiographic studies of the legs with time-intensity curves drawn at the infrarenal abdominal aorta. In patients with obstructive diseases of the artery, these cases might have shown errors caused by the difference in arterial arrival times between different vessels targeted during test-bolus study and MR angiography (Table 2). If these cases were excluded to eliminate possible bias by delayed enhancement due to non-timing causes, seven of the 48 cases examined by the traditional method but no case examined by the new method showed insufficient arterial enhancement during first-phase imaging. The venous enhancement seen on the first-phase image, and thus implying delayed acquisition, was noted in three cases examined by the new method. Arteries, however, showed much stronger enhancement than veins, and in no case was arterial depiction hampered by venous enhancement (Fig. 4). On MR angiograms examined by the traditional method, no venous over-projection occurred during first-phase imaging.
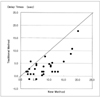
A mathematical comparison of new and traditional scan delay times showed that the new method needed longer delay times than the traditional. Differences in delay time between the two methods ranged from 2.3 to 11.3 seconds, with a mean±standard deviation of 5.4±3.5 seconds (Fig. 5).
DISCUSSION
The timing of image acquisition is one of the most important factors influencing the quality of contrast-enhanced MR angiograms (4-7). A scan obtained too early demonstrates insufficient arterial enhancement, with a central signal void, while one obtained too late shows venous and parenchymal enhancement which potentially obscures the artery. The result of this is poor contrast-to-noise ratio (14). Central low-frequency data found at the center of k-space are primarily responsible for image quality, and to maximize arterial signal and obtain an optimal image, the central portion of this space should thus be filled with maximally enhanced arterial signal (1, 2, 4).
The injection of dehydrocholic acid, saccharin, or magnesium sulfate has previously been used to check circulation time from a peripheral superficial vein to the systemic artery (18-21). This is an approach which detects only the arrival time at the systemic artery, however, and is not reliable in patients with cardiac or vascular disease. In contrast-enhanced MR angiography, time-intensity curve analysis by a test-bolus study is, for these reasons, particularly important. The success rate of arterial phase acquisition has been reported as 100% after such a study, compared to 80% in cases in which no study was performed (1). To accurately determine scan delay time, several methods based on time-intensity curve analysis have been used (1, 4, 14, 15). Equation 1, suggested by Prince et al. (4), has been widely accepted. In this method, a delay time dependent not only on arterial peak enhancement and acquisition time, but also on the duration of contrast-injection, is a feature of each examination.
The present study showed that in 17 of 48 cases, the timing method using equation 1 resulted in insufficient examinations, a result which underscores the need for another acquisition timing method utilizing equation 2. We surmised that arterial peak enhancement time during test-bolus injection should be dependent on the starting point of the main bolus, and that the length of the contrast bolus within the systemic artery would not be equal to the duration of injection at the superficial vein. We considered that due to bolus segmentation by cardiac pulsatility, pulmonary circulation, and limited carrying capability of the superficial vein where contrast media was injected, bolus length should be increased. This idea had previously been suggested in a study in which a 0.5-sec bolus injection had led to six to eight-second aortic enhancement. According to our unpublished data, bolus duration in the infrarenal abdominal aorta increased about 26 times after the injection of 2 ml of contrast medium into an antecubital vein at a rate of a 3 ml / sec, and we therefore regarded injection duration as a less important parameter. We believe that if the duration of the main bolus were greater than venous enhancement time, arteriovenous circulation time would be the main parameter. Although some reports have suggested possibly insufficient coverage of K-space during a rapid short bolus injection (17, 22-24), we assumed that the standard dose of 0.1 mmol / kg during an injection lasting 3 - 5 seconds would more than cover the total length of arteriovenous circulation and image acquisition time. All second arterial-phase images and some 50-second delayed venous-phase images in our study revealed that arteries were still strongly enhanced, thus demonstrating that the extent by which arterial bolus length exceeded arteriovenous circulation time was sufficiently great. For these reasons, we formulated a new timing method on the basis of arteriovenous circulation time.
In the new method, the center of K-space was adjusted to the midpoint of the arteriovenous circulation time, which was determined from the test-dose time-intensity curve. By adding half of the injection duration, the traditional method using equation 1 placed the center of K-space at a slightly later point than arterial peak enhancement time. The result of this was that during the arterial phase, more unenhanced and fewer enhanced portions were revealed by the traditional method than by the new method using equation 2. This was especially true in cases in which a contrast bolus was rapidly injected (Fig. 6). As shown by our results, the traditional method using arterial peak enhancement time resulted in earlier acquisitions, and when compared with the new method, this was manifested as insufficient arterial enhancement.
In certain ways, the new method was somewhat inconvenient. During the test-dose study, for example, venous enhancement could not be easily determined, especially in small veins, and because of this, the exact determination of time of venous enhancement was difficult. In addition, because the graphic scale was designed to fit arterial signal intensity, the slope of the venous enhancement curve decreased, and for this reason, simultaneous graphic demonstration of both arterial and venous time-intensity curves was problematic. In cases of weak venous enhancement, however, venous half-maximum intensity could be measured on a sole venous time-intensity curve acquired by automatically fitting the maximal scale to maximal venous intensity.
In small vessels such as those in the tibia, measurement of the time-intensity curve was difficult, particularly where a whole body coil was utilized. In these cases, for examination of the lower extremity, it was necessary to check the time-intensity curve at the common iliac vessels or infrarenal abdominal aorta and inferior vena cava. Some differences in arterial rising times might occur between the target artery and a remote vessel such as the tibial artery or infrarenal abdominal aorta. The one mismatched case in the equation 2 group and the two cases in the equation 1 group, in which images were acquired at the legs, showed markedly delayed arterial flow due to complete obstruction, with poor collaterals between the lower abdominal aorta and tibial arteries. With a surface coil, however, the smaller vessel could be a candidate for test-dose study. In addition, further improvement of scanning protocols for test-bolus study would eliminate this bias of sampling error by determining the time-intensity curve at the target artery itself. Differences in arteriovenous circulation time between the aorto-caval area and the femoral or tibial vessels might also affect scan timing. Although longer arteriovenous circulation time in target vessels would not be harmful, a shorter circulation time could result in more venous contamination. Despite this possibility, no severe venous contamination was demonstrated in this study, implying that circulation time has little influence on end results.
In multi-station angiography performed with a whole body coil, non-enhanced mask images of all stations were acquired first, and enhanced images were then obtained at each station. In these cases, although the second station image showed mild background enhancement, the quality was in all cases sufficient to identify small branches such as the femoral circumflex arteries. In this study, because venous contamination would be a greater hindrance to arterial depiction of the leg than of the thigh, the distal arteries were examined prior to the proximal. Although the appropriate duration of intermission was not determined, in order to minimize any remaining venous enhancement this was as long as possible. In multi-station studies using surface coils, mask images should be obtained after the completion of angiography at the prior station. In these cases, although more complete background subtraction was expected, diminished arterial signal intensity caused by remaining intra-arterial enhancement of the mask image was also a concern. After subtraction and MIP reconstruction, the arterial signal intensity seen on final images was not severely diminished, however, and this was probably due to the high signal-to-noise ratio achieved by the use of a surface coil.
In some cases, in spite of the properly enhanced greater arteries seen on first-phase images, second-phase images were better than first for the evaluation of smaller branches. For more accurate interpretation, both phases were therefore evaluated. For venogram study, a 50-second delayed phase was acquired. Because variable degrees of arterial enhancement persisted throughout delayed imaging, venograms were obtained by subtraction of arterial-phased images from delayed venous-phase images.
For data analysis, we counted the number of insufficiently enhanced first phase images, every one of which was included in the failed group regardless of the reason for delay (e.g. severe occlusive disease between target artery and the artery used in test-bolus study). Our results showed that the numbers of failed first phase images varied between the two groups: 17 / 48 (35%) for the traditional method, compared with 2 / 41 (5%) for the new method. As for venous contamination of the first phase, we found that this occurred in only three cases, presumably because of a non-timing problem. The cause of venous contamination in these cases was thought to be the excessively prolonged acquisition time as compared with arteriovenous circulation time. In these cases, the maximal ratio of acquisition and arteriovenous circulation times was 2.3. In the new method group, in order to achieve higher spatial resolution, average acquisition time was increased to 26.6 seconds, whereas average acquisition time in the traditional method group was 19.7 seconds. This prolonged acquisition time was thought to cover more of the venous phase, making venous contamination more likely. In the above cases, however, the first-phase images showed strong arterial enhancement, and appropriate arteriovenous-phase images were displayed during the second phase. Slight venous enhancement occurring in these cases did not impede the depiction of arteries. A limitation of this study was that acquisition time was fixed rather than tailored according to the subject, and slight venous enhancement thus occurred. If acquisition time were optimized according to arteriovenous circulation time, this kind of bias, which would be more obvious in organs with fast arteriovenous circulation, such as the brain, could be eliminated. To clarify the usefulness of this new method as applied to the brain, further study is therefore needed.
The shorter acquisition time used in the traditional method might increase the sensitivity of timing error and in this study, this could be a major bias factor. If acquisition time in the traditional method were increased to the level of that in the new method, the results would show less discrepancy. Because the elongation of acquisition time should permit a larger portion of k-space to receive data from unenhanced images, increased acquisition time in the conservative method would, however, enhance the likelihood of producing images of low signal-to-noise ratio. Furthermore, without a knowledge of venous enhancement time, the chance of venous contamination would also increase. We therefore believe that in the traditional method group, the shortest acquisition time possible is the best choice, though in the new method group, this might not be required. In order to achieve higher resolution images, acquisition time could be tailored according to the length of arteriovenous circulation time.
Optimization of scan timing using the new method, which is based on arteriovenous circulation time, produced better contrast-enhanced MR angiographic images than the traditional timing method using injection duration and arterial peak enhancement time as parameters. With sufficient acquisition time, determined according to the arteriovenous circulation time of each patient, the new method can provide high-resolution images.
 XML Download