

 PDF
PDF ePub
ePub Citation
 Print
Print


INTRODUCTION
Sepsis is caused by the influx of bacteria into the blood [1]. The immune system reacts against the influx of bacteria [2]. In addition, blood clot occurs due to the immune response to the whole body [3]. The blood clot interferes with blood and oxygen supply and then causes tissue damage and hypoperfusion [4]. In addition, hypoglycemia occurs because of the hepatic hypoperfusion. Sepsis usually alters glucose regulation in whole-body and tissue [5]. For example, hyperglycemia which occurs during the early phase of sepsis may be due to an increase of hepatic gluconeogenesis by the activation of acute immune response [678]. However, during the late phase of sepsis, organ dysfunction is usually occurred [9]. Furthermore, hypotension and hypoglycemia are produced eventually [10]. Hypoglycemia is in 16.3% of sepsis patients [11]. The severe or prolonged hypoglycemia may cause coma, seizures or irreversible cerebral damage [121314]. In addition, hypoglycemia occurred by certain infectious diseases is usually associated with the limited glycogen stores [15].
A recent study has demonstrated that clonidine administered systemically reduces sepsis-induced fatality in a rat model [16]. Asano et al. [17] found that α2-adrenergic receptors are located in the dorsal and ventral horn areas of the spinal cord. Especially, α2-adrenergic receptors are densely expressed in dorsal and ventral horns of the spinal cord. The activation of spinal α2-adrenergic receptors exerts several pharmacological profiles such as hypotension, hypothermia, hypnosis, analgesia and sedation [181920212223]. We recently found that the activation of α2-adrenergic receptors located in the spinal cord elevates the blood glucose level [24]. However, the role of spinal α2-adrenergic receptor activation in sepsis-induced mortality has not been characterized yet. Thus, in the present study, the effects of clonidine, an α2-adrenergic receptor agonist, administered spinally on mortality induced by LPS/GaLN treatment were examined.
TNF-α is one of pro-inflammatory cytokines. TNF-α is known one of critical factors for sepsis-induced mortality [25]. Mammals respond to LPS infection by producing a variety of immune cell mediators that have been shown to cause tissue damage to TNF-α [26]. Hofer et al. [16] have previously reported that clonidine administered systemically reduces sepsis-induced fatality by reducing TNF-α. However, the effect of clonidine administered spinally on TNF-α level induced by sepsis has not been clarified yet.
Recent studies have demonstrated that some of signaling molecules such as adenosine monophosphate-activated protein kinase (AMPK) play important roles in the production of sepsis pathogenesis. For example, metformin, which has been known as AMPK activator, can exert a protective effect against lipopolysaccharide-induced sepsis [27]. Moreover, 5-aminoimidazole-4-carboxamide ribonucleotide, an AMPK activator, also protects against sepsis-induced organ injury [28]. Furthermore, AMPK activation inhibits the signaling of mammalian target of rapamycin (mTOR). The mTOR was reported to modulate a variety of immune cell defense mechanisms, including proliferation and survival, phagocytosis, motility, and cytokine production [29]. Recent studies have demonstrated that mTOR pathway plays a major role in sepsis induced by lipopolysaccharide [3031]. However, the exact role of AMPK/mTOR signaling in clonidine-induced protective effect against sepsis has not been well defined. In addition, recent studies have demonstrated that tyrosine kinase 2 (Tyk2) may play a critical factor in the pathogenesis of sepsis. Karaghiosoff et al. [32] have previously reported that the mice lacking Tyk2 show a resistant to shock induced by lipopolysaccharide. In support of this finding, Bosmann et al. [33] recently demonstrated that Tyk2 plays a significant role in sepsis-induced lethality. However, the roles of Tyk2 in clonidine-induced protective effect against sepsis-induced mortality have not been characterized yet.
Pertussis toxin (PTX), an exotoxin produced by Bordetella pertussiss, covalently modifies the α-subunit of Gi proteins [34]. PTX inhibits glucose transport in perfused skeletal muscle [35], and also the treatment with PTX results in an inhibition of both insulin binding and glucose transport [36]. In addition, we and others have previously reported that PTX produces a long-term hypoglycemic effect [373839]. However, the roles of spinally located PTX-sensitive G-proteins in the regulation of protective effect by clonidine against sepsis-induced mortality were examined in the present study.
METHODS
The experiments were approved by the Hallym University Animal Care and Use Committee (Registration Number: Hallym 2015-68). All procedures were conducted by the ‘Guide for Care and Use of Laboratory Animals’ published by the National Institutes of Health and the ethical guidelines of the International Association for the Study of Pain.
Experimental animals
Male Institute for Cancer Research (ICR) mice (M.J. LTD., Seoul, Korea) weighing 23~25 g were used for all the experiments. Animals were housed five per cage in a room maintained at 22±0.5℃ with an alternating 12 h light/dark cycle. Food and water were available ad libitum. The animals were allowed to adapt to the laboratory for at least 2 h before testing and were only used once. Experiments were performed during the light phase of the cycle (10:00~17:00 h). These experiments were approved by the University of Hallym Animal Care and Use Committee.
Intraperitoneal (i.p.) and intrathecal (i.t.) administration
Intraperitoneal (i.p.) injection was performed in a volume of 250 µl. The i.t. administration was performed following the method of Hylden and Wilcox [4041] using a 30-gauge needle connected to a 25 µl Hamilton syringe with polyethylene tubing. The i.t. injection volume was 5 µl, and the injection site was verified by injecting a similar volume of 1% methylene blue solution and determining the distribution of the injected dye in the spinal cord. The dye injected i.t. was distributed both rostrally and caudally but with short distance (about 0.5 cm from the injection site) and no dye was found visually in the brain. The success rate for the injections was consistently found to be over 95% before the experiments were done.
Blood glucose measurement
The blood was collected shortly as much as possible with a minimum volume (1 µl) from the tail-vein. The glucose level was measured using Accu-Chek Performa blood glucose monitoring system (glucometer) (Roche Diagnostics, USA). The blood glucose level was measured at 0.5, 1, 3, 6, 12, 24, 36, 48, 72, 96 h after i.t. administration of clonidine. In the groups of pre- and post-treatment sepsis models, blood was collected at 30 min after i.t. clonidine injection.
Insulin ELISA assay
In Mouse Insulin ELISA (Shibayagi Co., Ltd., Japan), biotin-conjugated anti-insulin, and standard or sample are incubated in monoclonal anti-insulin-coated wells to capture insulin bound with biotin conjugated anti-insulin. After 2 h incubation and washing, HRP (horseradish peroxidase) conjugated streptavidin is added, and incubated for 30 min. After washing, HRP conjugated streptavidin remaining in wells reacted with a substrate chromogen reagent (TMB) for 20 min, and the reaction is stopped by addition of acidic solution, and the absorbance of the yellow product is measured spectrophotometrically at 450 nm. The absorbance is proportional to the insulin concentration. The standard curve is prepared by plotting absorbance against standard insulin concentrations. Insulin concentrations in unknown samples are determined using this standard curve.
Corticosterone assay and blood sampling
The plasma corticosterone level was determined by the fluorometric determination (Glick et al., 1964). Five hundred microliters of blood were collected by puncturing the retro-orbital venous plexus. Plasma was separated by centrifugation for 15 min at 3000 rpm and stored at –80℃ until assayed.
Protein extraction and western blot
The liver of mice was dissected 1 h and 3 h after sepsis induction. After dissection from hippocampus and liver, tissue was lysis with SDS lysis buffer containing 0.1 mM Na3VO4, and 20 mM NaF. After brief sonication to shear DNA and reduce viscosity, the concentration of protein was determined with the detergent-compatible protein assay reagent (Bio-Rad Laboratories, USA) using bovine serum albumin as the standard. The western blot analysis was performed according to our previous study [3842]. The membranes were then exposed to a Luminescent Image Analyzer (LAS-4000, Fuji Film Co., Japan) for the detection of light emission. Specific signals were quantified with the Multi-Gauge Version 3.1 (Fuji Film) and expressed as a percentage of the control.
Tumor necrosis factor (TNF)-α measurement
For TNF-α measurement, blood was collected at 1 h and 3 h after sepsis induction. Plasma was separated by centrifugation for 15 min at 3000 rpm and stored at –80℃ until assayed. Plasma levels of TNF-α was measured with an enzyme-linked immunoassay kit according to the manufacturer's directions.
Drugs and Materials
D-Galactosamine, Lipopolysaccharide, and clonidine were purchased from Sigma Chemical Co. (St. Louis, MO, USA). Pertussis toxin was purchased from Research Biomedicals (Natick, MA, USA). P-AMPKα1 antibody and p-Tyk2 antibody were purchased from (Santa Cruz biotech., Santa Cruz, CA, USA). P-AMPKα2 antibody and p-mTOR antibody were purchased from Abcam (Cambridge, MA, USA). All drugs used for injection were dissolved in sterile saline (0.9% NaClwith saline or test drugs. The pretreatment time was the same solution). All drugs were prepared just before use. Blood glucose meter, lancing device and strips were purchased from Roche Diagnostics (Accu-Chek Performa, Germany).
Statistical analysis
Statistical analysis was carried out by students-test Graph Pad Prism Version 4.0 for Windows (Graph Pad Software, San Diego, CA, USA). p-values less than 0.05 were considered to indicate statistical significance. All values were expressed as the mean±S.E.M. In our study; we established the mean blood glucose value of the control group through many experiments under matching conditions. Selected mice of established blood glucose level were then used in replication experiments.
RESULTS
Effect of clonidine pretreated spinally on sepsis-induced mortality and blood glucose level
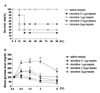
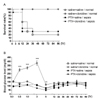
To produce sepsis, the mixture of D-galactosamine (0.6 g/10 ml) and LPS (27 µg/27 µl) was treated i.p. To assess the possible protective effect of clonidine against sepsis-induced mortality, clonidine (from 0.1 to 5 µg/5 µl) was pre-treated i.t. 10 minutes prior to GaLN/LPS administration. As shown in Fig. 1A, the mortality rate in GaLN/LPS-induced sepsis group, was 50% at 12 h, 70% at 24 h up to 96 h after GaLN/LPS administration. Although clonidine at the lowest dose (0.1 µg) used did not affect sepsis-induced mortality, clonidine at higher doses (1, 2.5 and 5 µg) reduced mortality rate in a dose-dependent manner. The sepsis-induced blood glucose level began to fall at 1hr and further down-regulated up to 6 h after sepsis production. As shown in Fig. 1B, clonidine at the dose of 0.1 µg did not affect the blood glucose level. However, higher doses (from 1 to 5 µg) of clonidine increased the blood glucose level in a dose-dependent manner. At the highest dose (5 µg) of clonidine, the blood glucose level reached at its highest level at 30 minutes and maintained up to 3 h and began to return toward the control level 4 h after i.t. administration.
Effect of clonidine on plasma insulin and corticosterone levels in control and sepsis groups
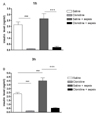
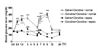
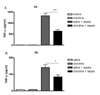
Insulin and glucocorticoid system are regarded as important regulators in the regulation of the blood glucose level. To examine if the insulin and glucocorticoid systems are involved in clonidine-induced hyperglycemia, the effect of clonidine administered i.t. on plasma, insulin and corticosterone levels were examined. The blood corticosterone and insulin levels were measured 1 to 3 h after GaLN/LPS administration. As shown in Figs. 2A and 2B, the spinal administration of clonidine significantly attenuated the plasma insulin level at 1 and 3 h. In contrast, the plasma insulin level was increased at 1 and 3 h.in sepsis model. In addition, the up-regulated plasma insulin level induced in sepsis model was attenuated by i.t. clonidine administration. As shown in Figs. 3A and 3B, i.t. administration of clonidine significantly increased the plasma corticosterone level 1 to 3 h. In addition, the plasma corticosterone level was significantly increased at 1h and 3h after GaLN/LPS administration. Furthermore, the up-regulation of plasma corticosterone level induced in sepsis was further increased 1 and 3 h after i.t. clonidine administration. The elevated plasma corticosterone level reached to the highest level 3 h after i.t. injection with clonidine.
Effect of clonidine post-treated spinally on sepsis-induced mortality and blood glucose level
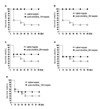
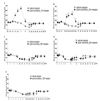
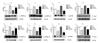
Since pretreatment of clonidine was effective in protecting against sepsis-induced mortality, first, clonidine at a dose of 5 µg was post-treated i.t. at 1, 3, 6, 9, and 12 h after GaLN/LPS administration and its effect on sepsis-induced mortality and blood glucose profile was observed. As revealed in Figs. 4A and 4B, clonidine post-treated 1 and 3 h after GaLN/LPS administration completely protected sepsis-induced mortality. However, the protective effect of clonidine against the sepsis-induced mortality was reduced in 6, 9, or 12 h clonidine post-treatment group (Figs. 4C, 4D, and 4E). As shown in Figs. 5A and 5B, clonidine post-treated 1 and 3 h after GaLN/LPS administration was significantly increased the blood glucose level. However, 6, 9, or 12 h post-treatment with clonidine have shown a slight elevation of the blood glucose level in the sepsis group (Figs. 5C, 5D, and 5E).
Effect of D-glucose feeding on clonidine-induced responses in sepsis model
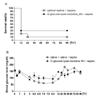
To examine if the shortness of glucose is primarily responsible for lack of pharmacological protective effect of 6 h post-treatment of clonidine against sepsis-induced mortality, D-glucose (8 g/kg) was orally post-treated at 5.5 h, and clonidine was post-treated at 6 h after sepsis induction. Although the blood glucose level was slightly increased in the clonidine-treated group as revealed in Fig. 6B, clonidine could not show the protective effect against sepsis-induced mortality in D-glucose feeding group (Fig. 6A).
The blood glucose level changes profiles of clonidine administered i.t. repeatedly in control and sepsis groups
Since i.t. post-treatment (6 h) with clonidine was not effective in elevation of the blood glucose, the experiment was designed to compare the blood glucose level changes in control and sepsis groups with repeated clonidine administration. As shown in Fig. 7, the blood glucose levels in both control and sepsis groups were increased up to 1 h in a similar pattern after the first administration with i.t. clonidine. However, the blood glucose level induced by the first i.t. injection with clonidine returned almost to basal level in sepsis group, whereas, the blood glucose level was remained at a high level up to 4 h after the first injection with clonidine in the saline-treated group. Whereas the second i.t. injection with clonidine at 6 h in the saline-treated group was able to increase the blood glucose level in a similar pattern to that observed after the first injection with clonidine, the second injection of clonidine at 6 h after sepsis induction could not cause a hyperglycemic effect in sepsis group.
Effect of i.t. pretreatment with pertussis toxin on pharmacological responses to clonidine in sepsis model
To examine if spinal PTX-sensitive inhibitory G proteins are involved in clonidine-induced survival and hyperglycemic effects in sepsis model, the effect of PTX pretreated i.t. on clonidine-induced hyperglycemia and survival effects in sepsis model was investigated. PTX (0.1 µg/0.5 µl) was pretreated i.t. once before 6 days and clonidine (5 µg/5 µl) was administered i.t. 10 minutes prior to the GaLN/LPS administration. As revealed in Fig. 8A, i.t. pretreatment with PTX caused a reversal of the protective effect of clonidine against sepsis-induced mortality. The i.t. treatment with PTX alone caused a slight hypoglycemic effect as shown in Fig. 8B. Furthermore, i.t. pretreatment with PTX almost abolished clonidine-induced hyperglycemic effect.
Effect of clonidine on plasma TNF-α level in control and sepsis groups
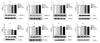
The plasma TNF-α level was measured 1 to 3 h after D-galactosamine (0.6 g/10 ml) and LPS (27 µg/27 µl) administration. As shown in Figs. 9A and 9B, the i.t. injection of clonidine did not affect the plasma TNF-α level at 1 and 3 h. However, the TNF-α level was increased at 1 and 3 h in GaLN model. The up-regulated TNF-α level induced by sepsis was attenuated by i.t. pretreatment with clonidine.
Effect of i.t. or i.p. pretreatment with clonidine on liver p-AMPKα1, p-AMPKα2, p-mTOR and p-Tyk2 protein expressions in control and sepsis groups
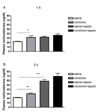
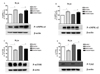
To examine if AMPK, mTOR, Tyk2 system are involved in clonidine-induced protective effect against sepsis-induced mortality, the possible alteration of p-AMPKα1, p-AMPKα2, pmTOR and p-Tyk2 expression after i.t. injection of clonidine in sepsis model was investigated. All signal pathways were measured at 1 and 3 h after clonidine administration. As shown in Figs. 10A, 10B, 10C and 10D, i.t. injection with clonidine increased p-AMPKα1 and p-AMPKα2 expression at 1 and 3 h in the liver. In addition, clonidine-induced increase of p-AMPKα1 and p-AMPKα2 expression was maintained up to 3 h in sepsis model. In addition, i.t. treatment with clonidine caused a reduction of pmTOR and p-Tyk2 in the liver as shown in Figs. 10 (E~H). The down-regulations of p-Tyk2 and p-mTOR expression by clonidine were maintained at the same level up to 3 h after the induction of sepsis. We further examined the effects of clonidine on the total AMPKa1, AMPKa2, mTOR and Tyk2 expressions at 1 and 3 h after sepsis induced by GaLN/LPS. AMPKa1, AMPKa2, mTOR and Tyk2 expressions were not affected by clonidine administration (Fig. 11A, 11B, 11C, 11D, 11E, 11F, 11G, 11H). We further tried to characterize the expressions of p-AMPKα1, p-AMPKα2, p-mTOR and p-Tyk2 protein in the liver after i.p. administration with clonidine. The expressions of p-AMPKα1, p-AMPKα2, p-mTOR and p-Tyk2 were measured at 3 h after clonidine administration. Intraperitoneal treatment with clonidine caused an elevation of p-AMPKα1 and p-AMPKα2 in the liver in both control and sepsis groups as shown in Figs. 12A and 12B. In addition, p-mTOR and p-Tyk2 expression were down-regulated in both control and sepsis groups by clonidine pretreated i.p. (Figs. 12C and 12D).
DISCUSSION
The activation of spinal α2-adrenergic receptors produces several pharmacological effects such as analgesia, changes in cardiovascular effects and sedative effects [212223]. The present study clearly demonstrates that clonidine pretreated spinally dose-dependently increases the blood glucose level and exerts a protective effect against the GaLN/LPS sepsis-induced mortality. In addition, clonidine post-treated up to 3 h after sepsis induction significantly reduces the sepsis-induced mortality rate. The results of the present study suggest that the activation of α2-adrenergic receptors located in the spinal cord may play a significant role in the protection against sepsis-induced mortality. However, spinal post-treatment of clonidine at 6, 9, and 12 h after sepsis induction was not significantly effective against sepsis-induced mortality. This finding suggests that the critical time period of clonidine-induced protection appears to be effective between 3 and 6 h after sepsis induction. The ameliorative effect of clonidine against sepsis-induced mortality found in the present study is similar to that of a previous study, in that the systemic injection of clonidine is also effective to reduce the mortality rate observed in cecum ligation and perforate (CLP)-induced sepsis model [164344]. Thus, it can be speculated that the protective effect of clonidine administered systemically against sepsis-induced mortality might be attributed to, in part, the activation of spinal α2-adrenergic receptors after absorption into the spinal cord.
Several lines of evidence have previously demonstrated that clonidine increases the blood glucose level by suppressing insulin secretion in pancreatic β-cells via the activation of α2-adrenergic receptors [4546]. We have recently observed that clonidine administered spinally increases the blood glucose level [24]. The upregulation of the blood glucose level induced by spinally administered clonidine is mediated by activating α2-adrenergic receptors, since spinal treatment with yohimbine, an α2-adrenergic receptor antagonist, completely blocks spinally administered clonidine-induced hyperglycemia [2442]. In the present study, we also measured the plasma corticosterone and plasma insulin levels after i.t. injection with clonidine in sepsis group. We found that spinal administration of clonidine in sepsis model causes decrease of the plasma insulin level and increase of corticosterone level, suggesting that spinally administered clonidine-induced hyperglycemia in sepsis model appears to be due to a reduction of the plasma insulin and an increase of the plasma corticosterone levels.
Furthermore, numerous studies have demonstrated that the hypoglycemia is usually produced during the sepsis [4748]. Taken together these observations, we propose a hypothesis that clonidine administered spinally may produce the protective effect against sepsis-induced mortality by counteracting the hypoglycemic effect induced by sepsis. To examine this hypothesis, we investigated the effect of clonidine on the blood glucose level in a sepsis model. We found that clonidine pre-treated spinally or post-treated up to 3 h produces a hyperglycemia in sepsis group. However, spinal post-treatment of clonidine at 6, 9, and 12 h after sepsis induction causes an only slight elevation of blood glucose level in sepsis group. These findings clearly suggest that the critical time of period for the hyperglycemic effect of clonidine appears to be located between 3 and 6 h after sepsis induction. When the organs are able to function for the blood glucose level increase up to 3 h after sepsis induction, clonidine-induced survival rate is increased. On the other hand, when the organs began to lose their functions in regulating the blood glucose level after 6 h after sepsis induction, clonidine-induced survival rate is reduced. This finding strongly supports our hypothesis that the upregulation of the blood glucose up to 3 h may play a major role in clonidine-induced protection against sepsis-induced mortality. Our results are partially in line with previous studies in that ghrelin, which produces hyperglycemia, is able to reduce the mortality found in cecum ligation and perforate (CLP)- or endotoxin-induced sepsis models [4950]. In support of our hypothesis further, we previously reported that the oral feeding of D-glucose reduces sepsis-induced mortality [51].
We found in the present study clonidine post-treated at 6 h after sepsis induction was not able to exert the protective effect against sepsis-induced mortality. At the same time, clonidine was not able to cause an increase of the blood glucose level after 6 h sepsis induction. To examine if the shortness of glucose is primarily responsible for lack of protective effect of 6 hr post-treatment with clonidine-against sepsis-induced mortality, D-glucose was orally post-treated at 51/2 h, and clonidine was post-treated at 6 h after sepsis induction. We found in the present study that spinal post-treatment (6 hr) with clonidine was still not able to cause an increase of the blood glucose level in D-gluocose-fed sepsis group and could not save the sepsis-induced mortality. This finding suggests that multiple organs failure or depletion of glucose from various organs is being occurred, at least, 6 h after sepsis was induced.
Although we observed the blood glucose level profile after spinal administration of clonidine in sepsis model, clonidine-induced blood glucose level profile in saline treated group has not been characterized. We found that spinally administered clonidine in control group causes an elevation of the blood glucose level in a similar pattern to that of sepsis group up to 1 h, remained at a high level up to 3 h after clonidine administration. On the other hand, clonidine-induced blood glucose level in sepsis group was significantly lowered compared to that in the control group at 3 h after clonidine administration. In addition, the second injection of clonidine in the control group at 6 h after sepsis induction caused a hyperglycemic effect to a similar extent as to the first injection. However, as expected, the second injection of clonidine at 6 h after the first injection in sepsis group did not cause a hyperglycemic effect. Our results suggest that the organs function normally up to 1 h. However, abnormal functions in regulating the blood glucose level is manifested at 3 h after sepsis induction. These abnormal functions are aggravated at 6 h after sepsis induction.
Several lines of evidence have previously demonstrated that PTX-sensitive G-proteins are involved in the production of hypoglycemia. For example, PTX administered systemically produces hypoglycemic effect in in vivo study [5253]. Furthermore, in in vitro study, PTX appears to increase the secretion of insulin [54]. We found in the present study that spinally pretreated PTX attenuates the hyperglycemic and protective effects induced by clonidine in sepsis group. These results suggest that inhibitory G-protein located at the spinal cord appear to be involved in the production of hyperglycemia and protective effect by activations of α2-adrenergic receptors located in the spinal cord against sepsis+induced mortality. The inhibitory effect of PTX against clonidine-induced hyperglycemia is in line with our previous study [38]. It is suggested that blocking the effect of PTX against the hyperglycemic effect induced by clonidine appears to be responsible for antagonizing clonidine-induced protective effect against sepsis-induced mortality.
TNF-α is a major mediator for the production of inflammation and mortality associated with sepsis. Leon et al. [55] found that, in TNF-α KO mice model, the mortality is reduced in sepsis model. Similarly, we found in the present study that clonidine administered spinally causes a reduction of increased plasma TNF-α level obsered in sepsis group. Our finding is further supported by a previous study that clonidine administered systemically also attenuates sepsis-induced plasma TNF-α level [25]. Taken together, the down-regulation of TNF-α level by clonidine appears to be one of important mechanisms involved in clonidine-induced protective effect against sepsis-induced mortality.
It has been well known that AMPK plays as an important regulatory pathway in the metabolic system [56]. We found in the present study that p-AMPKα1 and p-AMPKα2 expression were increased by clonidine administered spinally or systemically in the liver up to 3 h after clonidine administration. Based on these findings, it can be speculated that the clonidine causes the release of glucose from inside to the outside of the cells, resulting in hyperglycemia, then AMPK system is activated by the depletion of the energy source inside the cell. In addition, our finding is partially in line with previous studies in that the activation of AMPK system by AMPK activators such as metformin or AICAR exerts a protective effect against sepsis-induced mortality [2728]. Although the liver p-AMPKα1 and p-AMPKα2 expressions are not altered in sepsis group, the elevations of p-AMPKα1 and p-AMPKα2 expression by clonidine treatment are still maintained in sepsis group, suggesting that the elevation of liver p-AMPK expression may play important roles in the protective effect of clonidine against sepsis-induced mortality. Moreover, the activation of AMPK in general causes an inhibition of mTOR signaling pathway [57]. We found in the present study that p-mTOR expression in the liver is reduced at 1 and 3 h after spinal or systemic pretreatment with clonidine in both normal and sepsis groups, suggesting that the down-regulation of liver p-mTOR expression may play a major role in the protective effect of clonidine against sepsis-induced mortality. Taken together, is suggested that AMPK/mTOR signaling pathway is essential for the protective effect of clonidine against sepsis-induced mortality.
Several previous studies have reported that Tyk2 protein might be responsible for detrimental effect in sepsis-induced mortality. For example, in Tyk2 KO mice model, the sepsis-induced lethality is reduced [32]. Furthermore, the importance of Tyk2 in the pathogenesis of sepsis was further supported by a study by Bosmann et al. [33]. In support of these findings, we found in the present study that p-Tyk2 expression in the liver was decreased by spinally and systemically administered clonidine up to 3 h after clonidine administration. Although the liver p-Tyk2 expression is not altered in sepsis group, the decreased p-Tyk2 expression by clonidine treatment is still maintained in sepsis group, suggesting that the decrease of liver p-Tyk2 expression may play an important role in the protective effect of clonidine against sepsis-induced mortality.
We also examined the effect of clonidine on total amounts of liver AMPKα1, AMPKα2, mTOR, and Tyk2 proteins in both control and sepsis groups. We found that the total form of AMPKα1, AMPKα2, mTOR, and Tyk2 were not changed by clonidine in both control and sepsis groups, suggesting that the increased phosphorylation level of AMPKα1, AMPKα2, mTOR and Tyk2 by clonidine are not due to reduction of the total amount of those proteins.
Futhermore, the changes in phosphorylation of AMPKα1, AMPKα2, mTOR, Tyk2 levels by clonidine administerd spinally might be due to the activation of the spinal nerves. We have previously demonstrated that i.p administration with hexamethonium or 6-hydroxydopamine attenuates spinally administered clonidine-induced hyperglycemia, suggesting the blood glucose up-regulation by clonidine may be associated with the activation of the peripheral spinal nerve systems [24].
 XML Download