

 PDF
PDF ePub
ePub Citation
 Print
Print


INTRODUCTION
The retina is a specialized organ for vision where the conversion of light energy into neural activity happens. Among many retinal diseases, retinitis pigmentosa (RP) and age-related macular degeneration (AMD) are leading causes of blindness in adults [1,2]. A variety of treatment modalities have been attempted to restore vision in these patients. Among them, retinal prosthesis is being developed and regarded as the most feasible method to restore vision [3,4,5].
While a lot of effort has been devoted to the development of electrodes, circuits, packaging, and surgical techniques [6], less attention has been paid to the electrical stimulation parameters that would permit reliable retinal stimulation. Finding optimal parameters for electrical stimulation is one of the most important elements for the development of a viable retinal prosthesis.
Due to the advantage of large number of recording and stimulation channels, multielectrode array (MEA) electrodes have been used to record from a wide variety of neuronal preparations including the isolated retina [7,8,9,10,11,12,13].
When designing electrical stimulation protocols, many things should be considered, even after deciding electrode, like whether to use voltage or current control, whether to use monopolar stimuli or bipolar stimuli, what pulse shapes to use (monophasic, biphasic, multiphasic or asymmetric), etc. The efficacy of the stimulus to evoke spikes and the safety of the stimulus to the electrode itself and tissue are issues that warrant careful consideration. Generally, the current stimulation method is preferred over the voltage stimulation method in the retinal prostheses because the current stimulation can accurately control the delivered amount of charge. The current stimulation, however, can generate quite high electrode voltages that may harm the tissues or damage the electrodes [14]. Several studies have shown that monophasic pulse stimuli are more tissue-damaging than charge-balanced biphasic pulses [15,16,17,18,19].
Therefore, we have investigated optimal electrical stimulation parameters for retinal prostheses. Previously, we used both voltage-controlled and current-controlled pulses and proposed the optimal stimulus range for normal retina (wild-type mice) and degenerated retina (rd1) mice [11]. In our previous study, we only used anodic phase-1st followed by cathodic phase-2nd pulse to satisfy charge balance [11]. There have been long debates on which pulse waveforms are better regarding efficacious spike initiation, tissue damage, corrosion, etc [20,21,22]. Understanding the response of retinal ganglion cells to different stimulus waveforms has potential clinical implications.
METHODS
Animals
Seventeen rd1 (C3H/HeJ-Pde6brd1) mice of postnatal 8~9 weeks were used for these experiments. At this postnatal age, the retinas are no longer responsive to light, but extensive remodeling of the inner retina has not yet occurred. Instead, functional stability of RGCs are well preserved up to postnatal day 210 [26]. All mice were purchased from the Jackson Laboratories (Bar Harbor, ME, USA) and were maintained on a 12 hour light/dark cycle. All experimental methods and animal care procedures were approved by the institutional animal care committee of Chungbuk National University (approval number: CBNURA-042-0902-1).
Retinal preparation
The rd1 mice were anesthetized with an intraperitoneal injection of 1 ml/kg of a solution containing tiletamine-zolazepam hydroxide (25 mg/ml, Zoletil 50; Vervac, Sao Paulo, Brazil), xylazine hydrochloride (23.32 mg/ml, Rompun; Bayer Korea) and heparin sodium (5,000 I.U). After anesthesia, the retinal patches were prepared following the method of Stett et al. [8]. Briefly, the eye was enucleated, and then the retina was isolated and cut to patches of ~3×3 mm. The retinal patches were prepared under moderate illumination in an artificial cerebrospinal fluid (ACSF) solution (124 mM NaCl, 10 mM Glucose, 1.15 mM KH2PO4, 25 mM NaHCO3, 1.15 mM MgSO4, 2.5 mM CaCl2 and 5 mM KCl) bubbled with 95% O2+5% CO2 to maintain a pH of 7.3~7.4 and a temperature of 32℃. Patches were then mounted onto a planar microelectrode array (MEA) ganglion cell layer down onto the MEA.
In-vitro MEA Recording system
The data acquisition system (MEA60 system; Multi Channel Systems GmbH, Reutlingen, Germany) included planar MEA, stimulator (STG1004), amplifier (MEA1060), temperature control units, data acquisition hardware (Mc_Card) and software (Mc_Rack). The MEA contained 64 circular-shaped electrodes in an 8×8 grid layout with electrode diameters of 30 µm and inter-electrode distances of 200 µm. The electrodes are coated with porous titanium nitride (TiN) to minimize electrical impedance. The four electrodes at the vertices were inactive. Multi-electrode recordings of the retinal activity were obtained from 60 electrode channels with a bandwidth ranging from 10 to 3000 Hz at a gain of 1200. The data sampling rate was 25 kHz/channel. From the raw waveform of retinal recording, retinal ganglion cell (RGC) spikes and local field potentials were isolated by using 100 Hz high-pass filter and 20 Hz low-pass filter respectively, since the rd1 retina is known to have the oscillatory local field potential with ~10 Hz rhythm [9,26,27].
Electrical stimulation
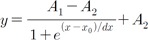
Using a stimulus generator (STG 1004, Multichannel systems GmbH, Germany), current pulse trains were delivered to the retinal preparation via one of the 60 channels (mostly channel 44 in the middle of the MEA). The remaining channels of the MEA were used to record the responses of the RGCs (see Fig. 1B). The stimuli consisted of symmetric and asymmetric, anodic phase-1st biphasic pulses and cathodic phase-1st biphasic pulses (Fig. 1A). For the symmetric pulse, 1st and 2nd phase of pulse are exactly same amplitude and duration without any interphase delay. For the asymmetric pulse, 1st phase of the pulse is the same with symmetric pulse but the amplitude of 2nd phase of the pulse is less than 10 µA and charge balanced condition is satisfied by lengthening the pulse duration. Because we had previously found that 30 µA/500 µs stimuli evoked the most RGC spikes, we fixed pulse width at 500 µs for amplitude modulation and pulse amplitude at 30 µA for amplitude modulation. For amplitude modulation, the intensities of the pulse used ranged from 2 to 60 µA. For duration modulation, the pulse widths used ranged from 60 to 1000 µs. Biphasic current pulses were applied once per second (1 Hz, ×50 times).
Calculation of threshold charge density
By using injected current, we can calculate the threshold charge density as follows when current stimuli were applied:
Where D is the charge density, I is the injected current, T is the threshold duration of stimulation extracted by curve fitting (see details below - data analysis section), and r is the radius of the electrode (15 µm).
Threshold current and threshold charge density always refer to the 1st phase of the biphasic, charge-balanced stimulus pulse.
Data analysis
Stored data were processed off-line by the spike sorting software (Offline Sorter™, Plexon Inc., TX ) to transform the waveforms containing multiunit activities into multiple single unit spike trains using principal component analysis (PCA) method [7,28,29,30,31,32]. From spike trains, all the data were processed with Neuroexplorer™ or Matlab™.
The temporal structure of RGC responses to electrical stimulus was investigated by Post-stimulus time histogram (PSTH), which shows multiple (3~4) peaks within 400 ms. When there were 3 (or 4) distinctive peaks in the PSTHs, usually the number of spikes for post-stimulus 400 ms was 30% more than that for pre-stimulus 400 ms. Therefore, we identified RGC as response positive cell when above mentioned criteria were satisfied [11]. RGC response strength was quantified by counting the number of evoked RGC spikes per pulse, which is the difference between the number of spikes for post-stimulus 400 ms and pre-stimulus 400 ms.
The curves of RGC response versus current pulse amplitude
or pulse duration were plotted. By curve fitting of RGC
response curve with Boltzman equation,
We identified threshold amplitude or threshold duration when the number of evoked RGC spikes per pulse was 0.5. Fit quality was assessed by goodness of fit (R2>0.99).
RESULTS
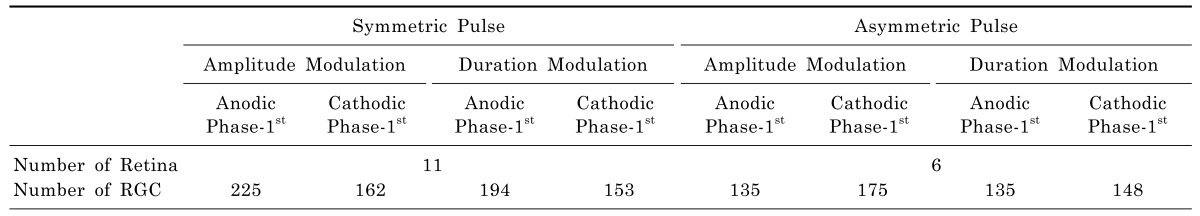
RGC responses were well modulated by both symmetric and asymmetric pulse protocols. In the symmetric pulse experiments, we compared the average response of the retinas (n=11). For the analysis of amplitude modulation effect, 225 RGCs were used in the anodic phase-1st pulse and 162 RGCs were used in the cathodic phase-1st pulse. In duration modulation, 194 RGCs were used in the anodic phase-1st and 153 RGCs were used in the cathodic phase-1st pulse. In the asymmetric pulse experiments, we compared the average response of the retinas (n=6). 135 RGCs were used in the anodic phase-1st amplitude modulation and 175 RGCs were used in the cathodic phase-1st amplitude modulation. In duration modulation, 135 RGCs were used in the anodic phase-1st and 148 RGCs were used in the cathodic phase-1st pulse (Table 1). The usage of the terms cathodic or anodic, henceforth refer to the 1st phase of the biphasic, charge-balanced stimulus pulse.
Amplitude modulation
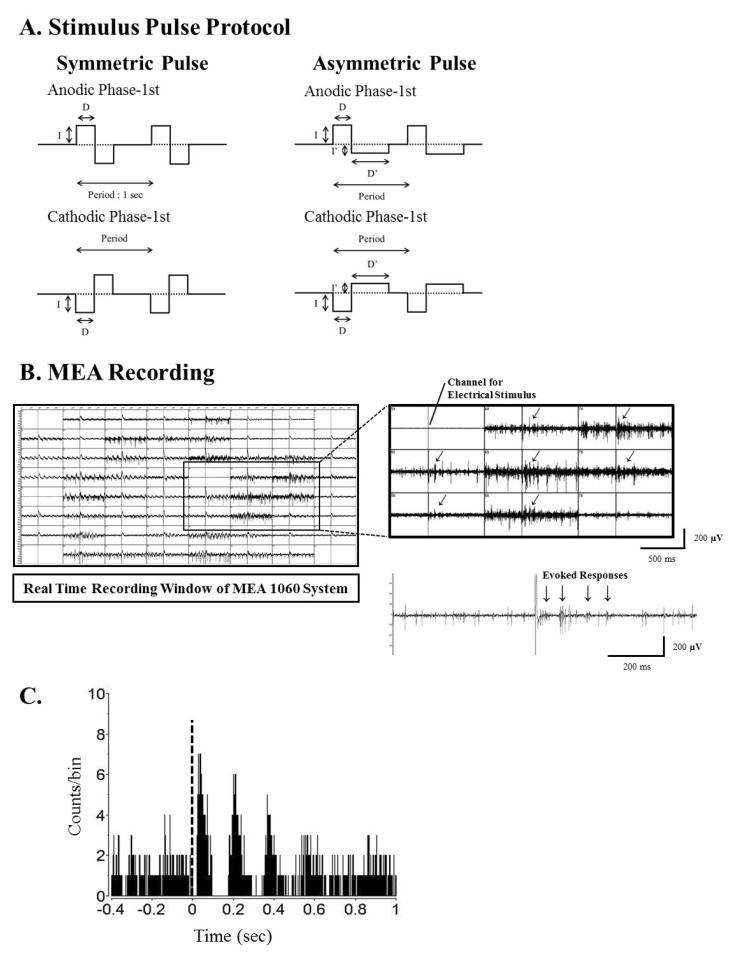
With amplitude increment, evoked RGC spike number increased both with symmetric and asymmetric pulse (Fig. 2). With the symmetric pulse protocol, cathodic pulses evoked significantly more RGC spikes than anodic pulses. At 20 and 30 µA amplitude there is a significant difference in evoked RGC spike numbers between cathodic and anodic pulse stimuli (p<0.001).
With the asymmetric pulse protocol, cathodic pulses also evoked more RGC spikes than anodic pulses (between 10 to 50 µA: at 20 µA: p<0.01, at other amplitudes: p<0.05).
Duration modulation
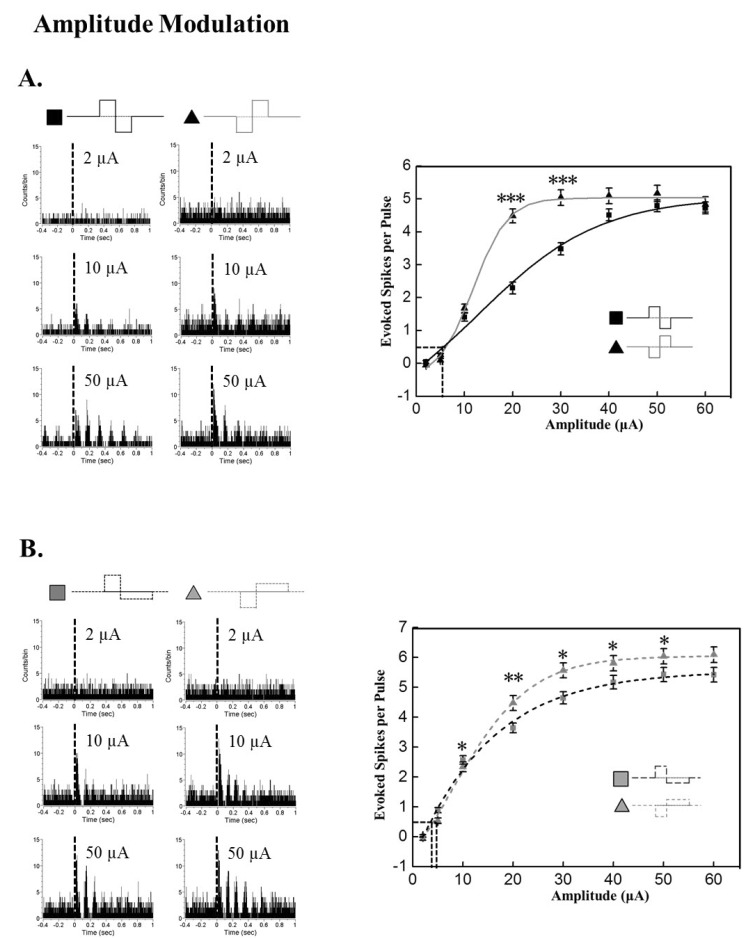
Similar to the results from amplitude modulation, evoked RGC spike number increased with duration increment of both symmetric and asymmetric pulses (Fig. 3). With the symmetric pulse protocol, cathodic pulses evoked significantly more RGC spikes than anodic pulse at 200, 300, and 500 µs duration (p<0.001).
With the asymmetric pulse protocol, cathodic pulses evoked significantly more RGC spikes from 100 to 500 µs (100 µs, 500 µs: p<0.05; 200 µs, 300 µs: p<0.001).
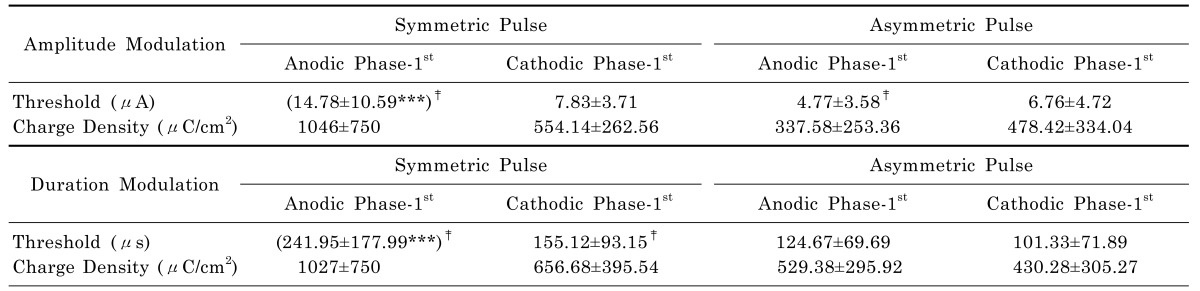
Threshold charge density
The calculated charge densities are summarized in Table 2. From each RGC modulation curve, we curve-fitted and extracted the threshold current. Then we calculated threshold charge density using equation 1. The mean±S.D. is shown under each pulse shape. Symmetric anodic pulses consistently exhibit the highest thresholds among different pulse shapes (***p<0.001 with ANOVA). With asymmetric pulses, anodic pulses exhibit lower thresholds than cathodic symmetric pulses for amplitude modulation.
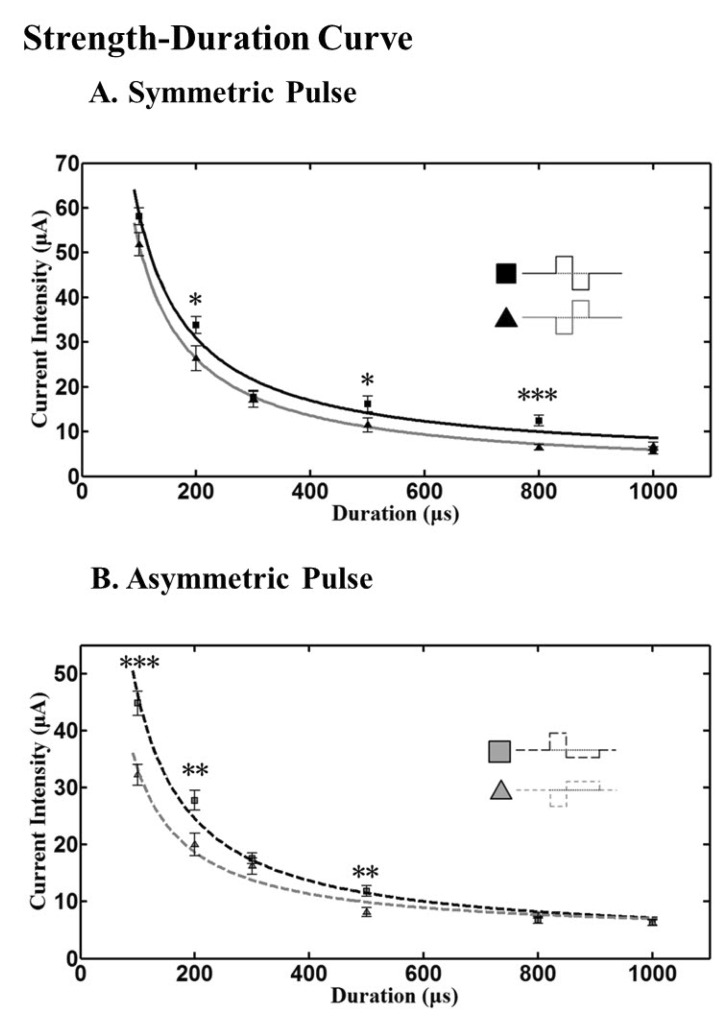
Strength-Duration curve
The relationship between the strength of an applied current pulse required to initiate a spike and the duration of the pulse, known as the strength-duration curve is shown in Fig. 4. Higher currents were required to evoke a spike when shorter pulses were applied.
To characterize each strength-duration (SD) curve by a time constant and an asymptote, power functions were fit to our data. The current required to elicit a spike depended strongly on pulse duration. The threshold current decreases with increasing pulse duration. At very long pulse duration, the current is a minimum, called the rheobase. Rheobase is defined as the asymptote of the fit curve [35,36] and chronaxie, the classical measure of responsiveness of a neuron, as the duration at which the threshold current is twice the rheobase [34]. By using the power function of y=a/x+b, extracted rheobase was 0.89, 3.07, 4.10, 2.83 µA for symmetric cathodic, symmetric anodic, asymmetric cathodic, and asymmetric anodic pulse respectively. The chronaxie of each different pulse shape (above mentioned order) was 5.66, 1.81, 0.71, and 1.54 ms respectively. These results were obtained from 46 RGCs (2 retinal patches for each different pulse shape).
Our SD curves show that with anodic pulses, higher current is needed to elicit RGC spikes both in symmetric and asymmetric pulse stimuli.
DISCUSSION
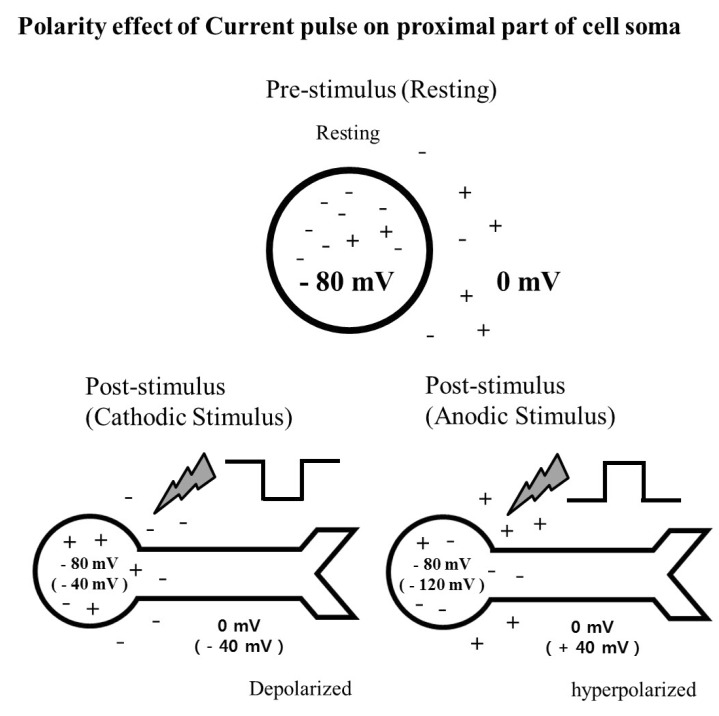
Anodic phase-1st pulse vs. Cathodic phase-1st pulse
Cathodic (negative) pulses lower the potential of the medium near the electrode. Therefore, the proximal part of the cell soma including the axon hillock with its high density of sodium [37] is relatively depolarized, resulting lower threshold for generating spikes. On the other hand, with anodic (positive) pulses the proximal part of the cell soma is relatively hyperpolarized. The schematic diagram (Fig. 5), illustrates the effect of switching stimulus waveform on the membrane potential of the proximal part of cell soma. Although the second phase of the pulse is needed for charge balance, it contributes little to activation of the cell since by the time of the second phase (0.2~1 ms), the RGC, having just fired a spike, is in a refractory state. Thus, only the effect of the first phase of the pulse on RGC firing is taken into consideration.
There are some reports showing that cathodic stimulation provides better result for eliciting RGC spikes. Jensen et al. [38] showed different response patterns with anodal and cathodal stimulation. Cathodal stimulation was associated with lower thresholds, making more localized stimulation possible. However, they used single needle platinum-iridium microelectrodes. Since we used planar disk microelectrode arrays, we are able to record the responses of several RGCs in the vicinity of stimulus channel, which is a major advantage of using MEA over single microelectrode. Moreover, since the configuration of MEA is similar to those used in current epiretinal prosthetics, we believe that our results are more applicable to retinal prostheses.
Using dissociated cerebral cortical neurons Wagenaar et al. [24] showed that pulse shape efficacy is best with biphasic negative then positive (equivalent to our biphasic cathodic phase-1st pulse).
Recently, Boinagrov et al. [39] also showed that cathodic epiretinal stimulation exhibit the lowest threshold for direct RGC responses and the highest direct selectivity (network/direct thresholds ratio) with pulse durations below 0.5 ms. But for network-mediated stimulation, the lowest threshold was obtained with anodic pulses in the outer plexiform layer (OPL) position, and its network selectivity (direct/network thresholds ratio) increased with pulse duration.
Since we used multichannel recording with iridium oxide electrodes, after applying electrical stimulus through one channel (mostly channel number 44 in the center), we calculated the differences of spike numbers during 400 ms time period before and after the stimulus in each channel and we averaged evoked spike number throughout all the channels which satisfied the selection criteria (refer to method section). All our RGC response curves were drawn with average evoked spike number (Fig. 2). We extracted threshold current level by curve fitting when the evoked spike number per pulse was 0.5, which is a similar idea with typical threshold definition. Many groups define threshold current as the level when 50% of trial pulses evoke spikes at that level. We could not use typical threshold definition because big stimulus artifact obscured the short latency-direct RGC response within 10 ms. With different threshold definition, threshold charge density might be different in each different electrode setting [40], but all our calculated threshold charge densities were within 0.5 mC/cm2, well within the safety limits of iridium oxide electrodes (1~4 mC/cm2, [23]).
In our MEA experiments, asymmetric pulses with longer 2nd phase duration provided lower threshold irrespective of amplitude modulation or duration modulation (Fig. 3). This appears to be due to the fact that the larger stimulus artifacts in our MEA60 system make it more stable when the charge is balanced for longer time periods with asymmetric pulse.
Strength-Duration curve
Pulses significantly longer than chronaxie contribute little to the evoked spike, thus pulse durations smaller than chronaxie should be used to ensure that most of the applied charge contributes to evoking a response [41]. From our chronaxie values (5.66, 1.81, 0.71, and 1.54 ms), we suggest that optimal pulse duration should not exceed these values.
Because cell bodies and dendrites have chronaxies of 1-10 ms [33,36], we think cell bodies not the axons are most likely excited by electrical stimulus. The initial axon segment near the cell somas has exceptionally high density of sodium channels [42], the chronaxie for activation of axon should be lower.
Limitation of our study and future study
With electrical stimulation, the electrical signals applied to activate neurons are sensed by all electrodes of MEA as stimulus-related artifacts, with amplitudes several orders of magnitude large than the amplitudes of the recorded spikes. This can result in saturation of the recording amplifier and makes detection of the spike very difficult. The stimulus-related artifacts can be reduced by optimization of the stimulation circuitry [43,44] as well as by using artifact subtraction algorithm such as SALPA (subtraction of artifact by local polynomial approximation) during data analysis [40,45]. Since we are using commercially available MEA 64 systems, if we use the blank circuit for stimulus, we lose recording for substantial time period (102 ms range) depending on stimulus amplitude. Therefore, we did not use blank circuit, resulting in large stimulus artifact. Due to the afore-mentioned technical reason, we have not dissected direct and indirect RGC responses, separately in this study.
The other limitation of our study is we did not consider spatial resolution. The RGC response curves we have shown in this study were drawn with averaged RGC spike number throughout all the channels with electrical stimulus. The MEA electrode we have been using has 200 µm inter-electrode distance. If we separate the channels with the distance from the stimulation channel, we can have preliminary data about spatial resolution with electrical stimulus.
A retinal prosthesis must be capable of delivering pulses and evoke spikes at a wide range of stimulation frequencies to mimic natural spike trains. Comparing the amplitude modulation and frequency modulation on percept size in RP patients with retinal prosthesis implanted, frequency modulation improves the encoding of a wide range of brightness levels without a loss of spatial resolution [46]. Since we have been using 1 Hz stimulus in this study, our next step will be frequency modulation.
 XML Download