

 PDF
PDF ePub
ePub Citation
 Print
Print


INTRODUCTION
Calcium levels are tightly regulated in the body. In adequate calcium homeostasis, ionized calcium concentrations ([Ca2+]) are maintained within a narrow range (1.1~1.35 mmol/L) [1], and any derangement from it causes serious health problems. Parathyroid hormone (PTH), synthesized and secreted by the chief cells of the parathyroid glands, is one of the key endocrine regulators of extracellular calcium concentrations [2,3]. Calcium-sensing receptors, located on parathyroid cells, are activated by either increases or decreases in [Ca2+], which result in the inhibition or stimulation of PTH secretion, respectively [2,3]. In turn, serum PTH acts on bone formation/resorption, and Ca2+ absorption and excretion from the bone, kidney, and intestine to maintain [Ca2+] at the normal physiological range [2,3].
In order to evaluate the safety and calcium absorption of Geumjin Thermal Water, a randomized, parallel clinical study was conducted. Due to Ca2+ homeostasis, it is challenging to quantify oral calcium absorption unless a more sophisticated approach is used, such as tracer methods (i.e., the use of a suitable calcium isotope). However, such methods are not readily applicable to most marketed calcium products.
In this study, it was hypothesized that PTH levels would carry more information about calcium absorption than the Ca2+ concentration itself, as any increment in plasma [Ca2+] after the intake of calcium would have resulted in a change in PTH levels, which is not prone to be tightly regulated. In order to utilize all of the information included in the PTH responses that are changed by time, more sophisticated, model-based approaches are preferred to a simple statistical test. K-PD (K for kinetic instead of PK for pharmacokinetic, and PD for pharmacodynamic) modeling [4] is currently used to model PD response-time profiles when the drug concentrations are not available. Similar to the rationale for K-PD modeling, the PTH response was also modeled without noticeable changes in observed calcium levels. Specifically, the goals of this analysis were to develop a mechanistic model for PTH and to compare the degree of calcium absorption after ingestion of thermal spring water or a calcium carbonate supplement using the PTH response.
METHODS
Study design
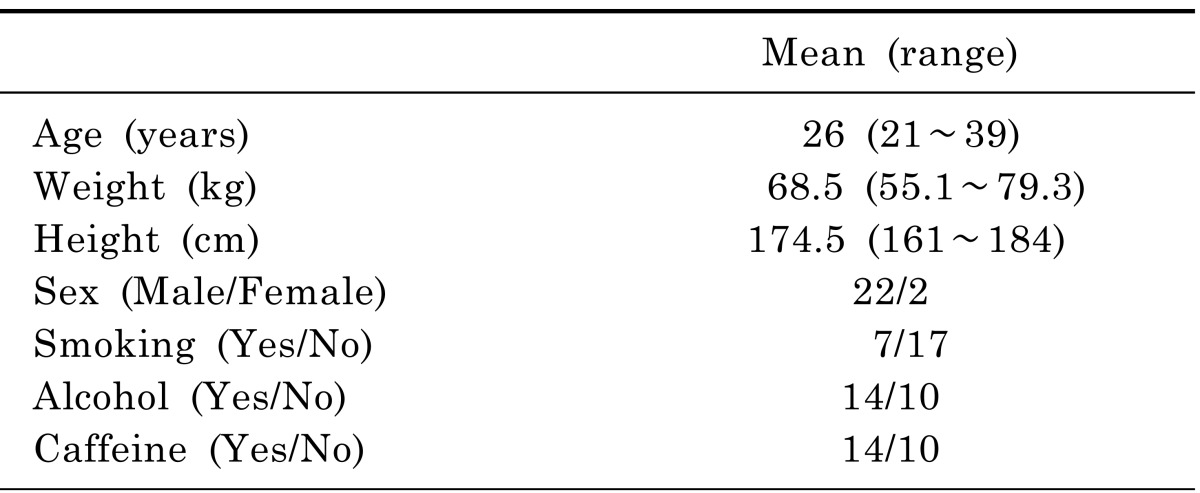
This was a randomized, parallel clinical trial of Geumjin Thermal Water (thermal spring water hereinafter) to evaluate its safety and calcium absorption in healthy Korean subjects. The safety and the extent of calcium absorption of thermal spring water were compared with that of a calcium carbonate supplement. The inclusion criteria included: 1) healthy adults between 20 and 50 years of age at screening, 2) male and female subjects whose weights were greater than or equal to 55 kg and 45 kg, respectively, and within±20% of ideal body weight, calculated as (height in cm-100)×0.9, and 3) subjects must be willing and able to comply with scheduled visits, treatment plan, laboratory tests, and other trial procedures after being informed about the study and agree to provide a written consent. Subjects allergic to calcium supplements, whose 25(OH) Vitamin D3 levels were outside the range of 4.8~52.8 ng/mL at screening, whose calcium levels were outside 8.0~10.0 mg/dL, or otherwise were considered unhealthy according to the study protocol were excluded from the study. The demographic summary of the study population is provided in Table 1.
Twenty-four subjects were randomized to one of three treatments (2:1:1 ratio). During the mornings of days 1 and 7, 12 subjects received 240 mL of Geumjin thermal spring water that contains 400 mg of elemental calcium, followed by 100 mL of purified water; 6 subjects received 500 mg of calcium carbonate (CaCO3) (two tablets containing 200 mg calcium each) with 240 mL of normal saline plus 100 mL of purified water; and 6 subjects received 500 mg CaCO3 with 340 mL of purified water. On days 2 through 6, the morning (daily) doses described above were split into two doses and administered twice daily. Blood samples were collected before and up to 8 hours (0, 0.5, 1, 1.5, 2, 3, 4, 6, and 8 hours) after the calcium intake.
Model development
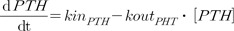
While the PTH-Ca2+ system is very complex, it was simplified with the following assumptions: 1) the net absorbed calcium from each calcium supplement is positive but not observed due to the Ca2+ homeostasis; 2) the drop in the PTH response is only due to the increased but unobserved Ca2+, as a negative feedback; and 3) no circadian rhythm nor systemic differences in baseline PTH levels on days 1 and 7 were present, other than random variability. The schematic of the model is presented in Fig. 1. Indirect response models with zero-order input and first-order output rates were fitted to the observed Ca2+ and PTH data, respectively, as follows.
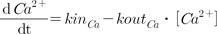
Where kinCa represents the zero-order input rate for Ca2+, koutCa represents the first-order output rate for Ca2+, kinPTH represents the zero-order input rate for PTH, and koutPTH represents the first-order output rate for PTH.
Increased Ca2+ levels due to the intake of thermal spring water or the calcium supplement were believed to decrease the secretion of PTH, which was incorporated into the model as an inhibitory Emax model as follows.
Where  is the net absorbed but unobserved Ca2+, ka represents the first-order absorption rate constant, Emax represents the maximum effect of [], on PTH secretion (fixed to 1),
is the net absorbed but unobserved Ca2+, ka represents the first-order absorption rate constant, Emax represents the maximum effect of [], on PTH secretion (fixed to 1),
EC50 represents the concentration of [] to achieve half of Emax, while other terms are as defined previously. [ ] at
t=0 was assumed to be 1.
] at
t=0 was assumed to be 1.
] to achieve half of Emax, while other terms are as defined previously. [] at
t=0 was assumed to be 1.The bioavailability of calcium carbonate was estimated relative to that of thermal spring water. The type I error rate (α) for covariate testing was set as 0.05. Since the number of subjects was small and the main interest was the difference between thermal spring water compared with calcium carbonate, the 12 subjects that received calcium carbonate tablets were combined and treated as one treatment (i.e., calcium carbonate). No other covariates than the formulation of calcium were tested. Model development was guided by the objective function value, goodness of fit, and the physiological plausibility of the model and parameter estimates.
Model evaluation
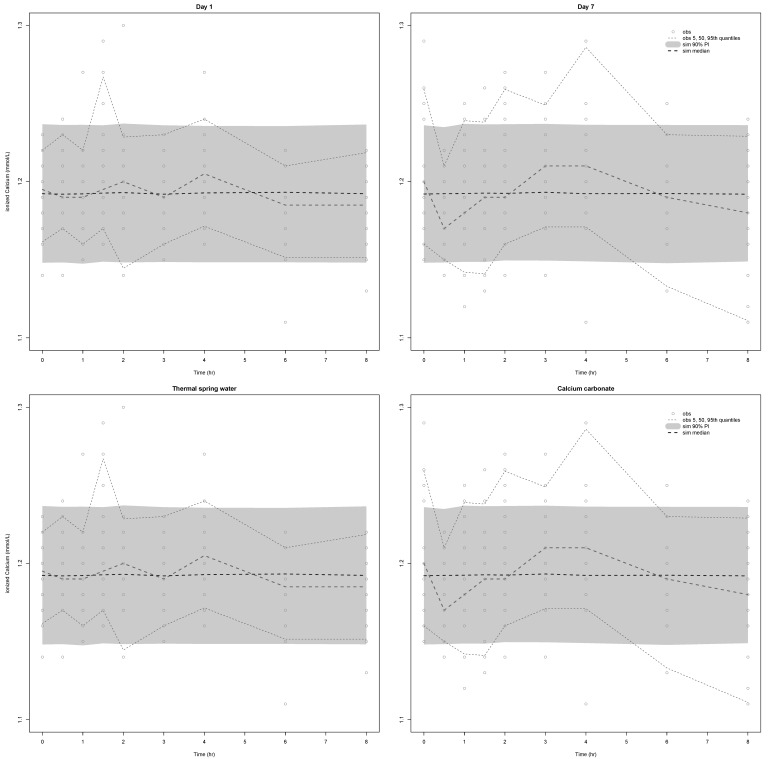
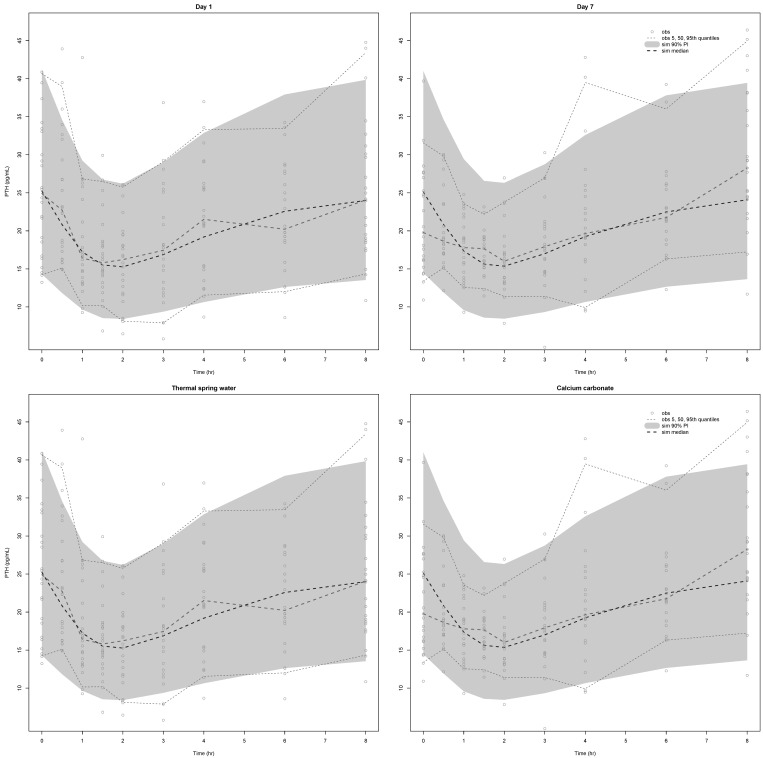
A basic set of diagnostic plots was generated for both Ca2+ and PTH. For a visual predictive check, 500 data sets with the same study design of the observed data set were simulated using the final model and parameter estimates, and the 5-50-95th percentiles were compared with those observed in this study. For bootstrap, 500 data sets were sampled with replacement and nonparametric 95% confidence intervals (2.5~97.5 percentiles), and the median values were assessed using the runs with successful minimization.
Software/platform
The analysis was performed using NONMEM 7.2.0 (ICON Development Solutions, MD) in the Pirana 2.6.1 platform [5]. R 2.15.1 (www.r-project.org) with R studio version 0.96.330 (http://www.rstudio.com/) was used for data formatting and plotting. Perl-Speaks-NONMEM 3.5.3 was used for bootstrapping. The estimation method used was the first-order conditional (FOCE) with interaction, while ADVAN13 was used to solve differential equations.
RESULTS
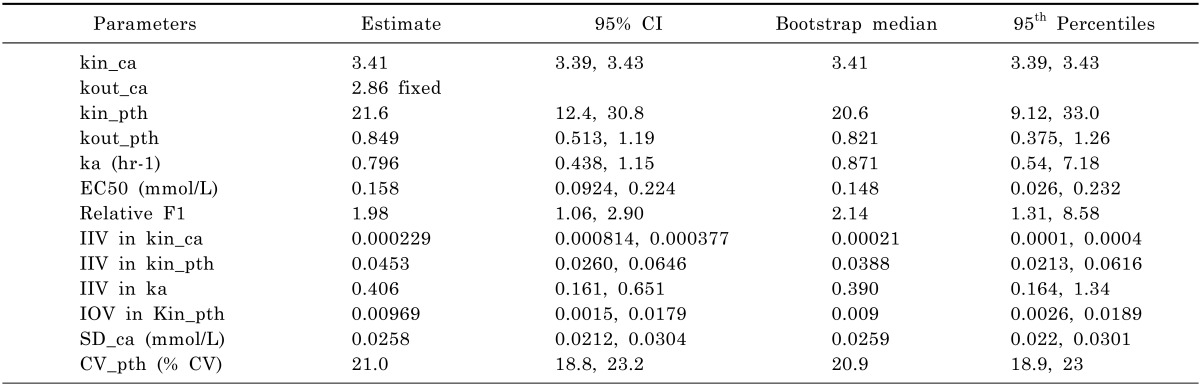
A total of 423 PTH and 423 Ca2+ concentrations, collected from 24 subjects, were included in the analysis. The final parameter estimates and 95% confidence intervals are provided in Table 2. The elimination rate constant for Ca2+ was fixed to the literature value [6] of 2.862 hr-1, as both the calcium turnover rate and the fractional rate of elimination might not be identifiable unless some extreme change (such as chelation of extracellular calcium by EGTA, ethylene glycol tetraacetic acid) is introduced into the system. The same constant was used for the rate of elimination for unobserved calcium in the model (Fig. 1). The first-order elimination rate constant for PTH was estimated to be 0.849 hr-1, which was smaller than the values found in the literature (as a half-life, less than several minutes [6,7]). The first-order rate constant for calcium absorption was estimated to be 0.796 hr-1, which could have been influenced by the rate of calcium absorption as well as the change in the PTH response in this type of model. It was also necessary to fix the Emax to 1, as the maximal calcium effect on PTH was unlikely to be observed with the calcium amount evaluated in this study; yet it was assumed that 100% suppression in PTH secretion can be achieved if the maximal calcium dose is introduced.
In order to account for the difference in baseline PTH level, inter-occasion variability (IOV) was included into the zero-order input rate constant for PTH. In addition to the random individual difference of 21.4%, 9.84% IOV was estimated in this study (Table 2).
The relative bioavailability of calcium carbonate was estimated to be 1.98 (RSE 24%) times higher than that of thermal spring water (p<0.05). The treatment effects on the calcium absorption rate constant (ka) or on EC50 were not significant (α=0.05).
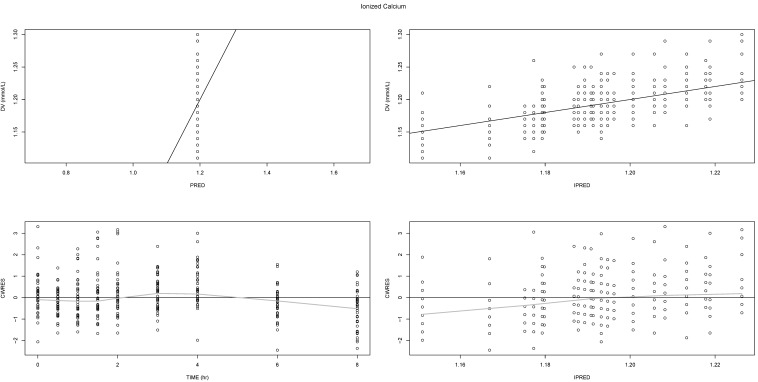
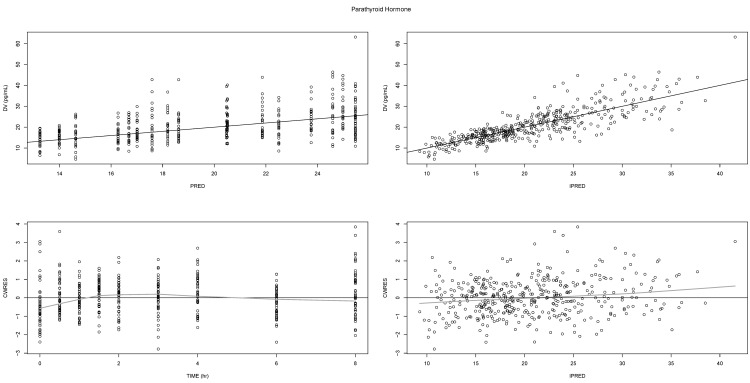
Basic diagnostic plots, such as observed (DV) versus (individual) predicted values (I/PRED), showed that the final model described well both the observed Ca2+ and PTH levels (Figs. 2 and 3, respectively, upper panel). As supported by the even scattering in the conditional weighted residual (CWRES) plots versus time or individual predicted values (Figs. 2 and 3, lower panel), no apparent bias or systematic trend seemed to exist.
DISCUSSION
From a clinical trial to evaluate the safety and calcium absorption of Geumjin thermal spring water in comparison with calcium carbonate tablets, the PTH and Ca2+ levels were measured for 8 hours after oral administration. Daily doses of thermal spring water or calcium carbonate tablets (either with normal saline or drinking water) contained 400 mg of elemental calcium. When the raw data were visually inspected (not shown), it was clear that the PTH response was a more sensible indicator than Ca2+ itself; therefore, the PTH response was used to evaluate calcium absorption in this analysis with the assumptions described in the Method section. The rationale was that the net absorbed calcium from oral intake could have inhibited the secretion of PTH, but the calcium itself is not noticeable due to calcium homeostasis. If the bioavailability of calcium was similar between thermal spring water and calcium carbonate tablets, it was assumed that the change in PTH would have also been similar. When the treatments - thermal spring water versus calcium carbonate tablet - were tested for relative bioavailability, it appeared that calcium carbonate had an approximately two times higher bioavailability than thermal spring water. However, the finding needs to be carefully interpreted, as the test was performed on hypothetical calcium levels, not the actual observations. Because baseline PTH changes by circadian rhythm were not incorporated into the model, the exact pattern of PTH change by calcium absorption is not known in this study.
It is worthwhile to mention previous efforts to model the PTH-Ca2+ system. Abraham et al. [6] also used indirect response models, but they were able to distinguish the synthesis of preproparathyroid hormone and the secretion of PTH by integrating human data and rat experiments where EGTA was infused to chelate plasma Ca2+. Shrestha et al. [8] developed a mathematical model for the PTH response to acute changes in Ca2+. They characterized the short-term dynamic of PTH response and Ca2+ concentrations as the reverse sigmoid relation and estimated parameters using clinical data collected from three subjects who underwent hypocalcemic clamp tests [8]. On the other hand, our study focused on estimating the relative degree of calcium absorption rather than developing sophisticated feedback models. Although the mild condition in our study would limit the implementation of more complex and mechanistic models, we believe a step was taken forward by fully utilizing the time course of PTH responses, rather than only the change from the baseline. Heaney [9] calculated the area under the curve (AUC) of Ca2+ over 9 h by measuring radioactivity after giving radiolabelled calcium carbonate formulations. His report is unique in that the change in the serum Ca2+ concentration was directly measured; however, radiolabeling is not easily applied to human studies due to the cost and time involved.
In this study, semi-mechanistic modeling was performed to characterize the Ca2+-PTH system after intake of thermal spring water containing calcium or calcium carbonate tablets. Without noticeable differences in the plasma Ca2+ levels, the changes in the PTH responses were used as a surrogate marker for calcium absorption. With a more enhanced study design, it is believed that our approach can be applied to evaluate calcium absorption, as determined by PTH-time responses.
 XML Download