

 PDF
PDF ePub
ePub Citation
 Print
Print


ABBREVIATIONS
n-AS
n-(9-anthroyloxy)stearic acid
BSA
bovine serum albumin
DPH
1,6-diphenyl-1,3,5-hexatriene
PBS
phosphate-buffered saline
Py-3-Py
1,3-di(1-pyrenyl)propane
RET
radiationless energy transfer
SPMV
synaptosomal plasma membrane vesicles isolated from bovine cerebral cortex
TNBS
2,4,6-trinitrobenzenesulfonic acid
INTRODUCTION
A number of theories propose perturbations of bulk physical properties of the lipids of cell membranes as the primary event leading to inebriation or anesthesia. The molecular mechanism of action of ethnaol involved in producing ethanol intoxication, tolerance and general anesthesia are not well understood. An understanding of the behavior of ethanol at the molecular level is complicated by the fact that ethanol has a multi-faceted effect on cells in contrast to a localized site of action on a specific cellular target. The nonspecific effects of ethanol resulted in a large body of work that examined how ethanol affected bulk membrane lipid structure. One hypothesis was that ethanol fluidized the bulk membrane lipid and that the increased in fluidity was involved in general anesthesia and intoxication [1-5]. Most of the accumulated results for the analysis of ethanol's effect on the cell membrane fluidity used a single molecular probe for estimations of bulk membrane fluidity, and thus obtained information about one region (or average). However the membrane fluidity may vary at different positions. In most studies, effects of ethanol on membrane fluidity have examined the bulk bilayer's rotational mobility, not on the individual monolayer's rotational mobility (asymmetric mobility). Furthermore with few exceptions work has not focused on the bulk lateral [6-10] and individual monolayers' mobility [8-10] and annular lipid fluidity and protein distribution [8-10].
Opinions have been divided as to whether ethanol interfered with membrane protein function by directly binding to the proteins [11-13] or whether the main modes of action occurred indirectly through a change in the physicochemical properties of the lipid membranes into which the ethanol readily diffused [14,15]. Because biological membranes are of highly complex composition, it has not been feasible to monitor changes in the local lipid environment and to determine its effect on the membrane protein function at the same time.
Previous studies have shown that the fluorophores of anthroyloxy derivatives locate at a graded series of levels from the surface to the center of the lipid bilayer structure (or a series of anthroyloxy fatty acids indicates that the depth of the group is almost linearly related to the number of carbon atoms between it and carboxyl group) [16-19]. The fluorophores of anthroyloxy derivatives can also be used to differentiate whether the bilayer has a fluidity gradient across it, as the anthroyloxy group can be positioned at different positions of the stearic acid moiety [18-21]. These probes have been suggested to measure primarily the dynamic component of membrane fluidity [20].
We believe that the study of the structure-activity relationship of n-alkanols becomes a very important material for the research of mechanism of pharmacological action of ethanol. Tempting to further understand the molecular mechanism of action of ethanol, we carried out a comprehensive study of membrane actions of methanol. We isolated synaptosomal plasma membrane vesicles (SPMVs) from fresh bovine cerebral cortex and using intramolecular excimerization of 1,3-di(1-pyrenyl)propane (Py-3-Py) and fluorescence polarization of 1,6-diphenyl-1,3,5-hexatriene (DPH), we examined the effect of methanol on the bulk fluidity of SPMVs lipid bilayer. In addition, selective quenching of both Py-3-Py and DPH fluorescence by trinitrophenyl groups was used to examine the effect of methanol on the individual SPMVs monolayers. We also evaluated the effect of methanol on basic structural parameters of the SPMVs lipid bilayer's annular lipid fluidity. This study was done through investigation of the effect of methanol on rotational mobility of the hydrocarbon interior and polar region (membrane interface, surface region) in the native membranes which differ in fluidity. The study was carried out using 16-(9-anthroyloxy)palmitic acid (16-AP), 12-(9-anthroyloxy) stearic acid (12-AS), 9-(9-anthroyloxy)stearic acid (9-AS), 6-(9-anthroyloxy)stearic acid (6-AS) and 2-(9-anthroyloxy) stearic acid (2-AS) those reflecting rotational mobility at the 16, 12, 9, 6 and 2 position of aliphatic chains present in phospholipids of neuronal membrane outer monolayers.
METHODS
Materials
The fluorescent probes DPH, Py-3-Py and the fluorescent anthroyloxy palmitate or stearate probes, 16-AP, 12-AS, 9-AS, 6-AS and 2-AS were obtained from Molecular Probes (Eugene, OR). Methanol and 2,4,6-trinitrobenzenesulfonic acid (TNBS) were purchased from Fluka (Buchs, Switzerland). Other reagents were obtained from Sigma (St. Louis, MO) and were analytical grade.
Preparation of synaptosomes and TNBS labeling reaction
Preparation of synaptosomes was performed according to the earlier procedures [22,23]. To determine fluorescence parameters of probe molecules in each membrane monolayer, TNBS labeling reactions were performed according to the procedures described earlier [8,9,22,24-26] with a few modifications. Synaptosomal pellet was gently resuspended in 50 ml of 4 mM TNBS in buffer A for 80 min (in the case of asymmetric lateral mobility), or 50 ml of 2 mM TNBS in buffer A for 40 min (in the case of asymmetric rotational mobility) or buffer A alone. Buffer A was composed of 30 mM NaCl, 120 mM NaHCO3, 11 mM glucose and 1% bovine serum albumin (BSA). The reagent pH was adjusted to 8.5 with NaOH. To assure complete exposure of all synaptosomal outer monolayers to TNBS, the pellet was passed slowly through an Eberbach tissue grinder (3 up and down strokes). Unless otherwise specified, the treatment was carried out at 4℃. The TNBS labeling reaction was terminated by adding an equal volume of 1% BSA in phosphate buffered saline (PBS; 8 g/l NaCl, 0.2 g/l KCl, 0.2 g/l KH2PO4, 1.15 g/l Na2HPO4·7H2O, 0.48 g/l Hepes, pH 7.4).
Membrane isolation
SPMVs were isolated from synaptosomes by the formerly reported method in our laboratory [22,23]. The specific activities of Na+, K+-ATPase, acetylcholinesterase and 5'-nucleotidase were about 4-, 2.5- and 3-fold, respectively, enriched in the plasma membrane fraction with respect to crude homogenates. The electron microscopic examination of the SPMVs prepared by us showed very high purity. The vesicles, which were separated according to size, demonstrated homogeneous distribution and no longer showed the presence of intracellular organelles or leakage. The protein concentration was determined by the method of Lowry et al. [27] using BSA as a standard.
Fluorescence measurements
All fluorescence measurements were obtained with a Multi Frequency Cross-Correlation Phase and Modulation Fluorometer (Model; ISS K2-003). Cuvette temperature was maintained at 37.0±0.1℃ with a circulating water bath (pH 7.4). Bandpass slits were 10 nm on excitation and 5 nm on emission. Blanks, prepared under identical conditions without fluorescent probes, served as controls for the fluorometric measurements.
The incorporation of Py-3-Py was carried out by adding aliquots of a stock solution of 5×10⁻⁵ M in absolute methanol to the SPMVs, so that the final probe concentration was less than 5×10⁻⁷ M [25,26]. The mixtures were initially vigorously vortexed for 10 sec at room temperature and then incubated at 4℃ for 18 hr under gentle stirring [24-26].
The fluorescent probe DPH was dissolved in tetrahydrofuran and a volume of 0.5 µl tetrahydrofuran per ml of PBS was added directly to the membrane suspension at a concentration of 0.01 µg/50 µg membrane protein (fluorescence probe DPH 2: membrane protein 10,000) as described previously [24-26]. After incorporation of the probes, the membrane suspension was placed in cuvettes. Control levels of fluorescence were then determined. Concentrated solutions of the methanol were prepared in 10 mM Tris-HCl (pH 7.4) and added to the labeled membrane suspension (or untreated SPMVs suspension) to give the desired concentration of the methanol (in this case, 30 min for incubation).
Excitation wavelengths were 286 nm for tryptophan and 330 nm for Py-3-Py. Emission wavelengths were 335 nm for tryptophan, 379 nm for Py-3-Py monomer and 480 nm for Py-3-Py excimer. For Py-3-Py excimer emission, a GG-455 cut-off filter was used. The excimer to monomer fluorescence intensity ratio, I'/I, was calculated from the 480 nm to 379 nm signal ratio. The excitation wavelength for DPH was 362 nm and fluorescence emission was read at 424 nm.
The fluorescence measurements of AS probes were taken using a modified method of earlier study [20]. The SPMVs were suspended in PBS to concentration 50 µg of protein/ml. Stock solutions of the 16-AP, 12-AS, 9-AS, 6-AS and 2-AS in methanol (2×10⁻⁵ M) were prepared and kept in a cold and dark place. Aliquots were added to the solutions of the native membranes so that the final concentrations of the 16-AP, 12-AS, 9-AS, 6-AS and 2-AS became 4×10⁻⁸ M incorporated the probes. The mixture was stirred for 20 min at room temperature in order to reduce the concentration of methanol that might alter the rotational mobility of the SPMVs. Also, the mixture was bubbled by dry nitrogen for 1 min with 20 min intervals in order to eliminate oxygen that might act as a quencher. To ensure complete removal of methanol residue in the mixture, the prepared mixtures were subjected to exhausted stirring for more than 2 hr which have shown the same results as the mixtures stirred for 20 min. Concentrated solution of methanol was prepared in PBS and added to the labeled membrane suspension to give the desired concentration of the methanol. The pH of the buffered sample was not changed significantly by addition of methanol.
The effect of methanol on individual monolayer structure in SPMVs: selective quenching of Py-3-Py
This method is based on the assumption that the system is composed of fluorescing compartments of different accessibility to TNBS. The excimer to monomer fluorescence intensity ratio, I'/I, of Py-3-Py in bulk (inner plus outer), inner and outer monolayers were calculated by the following equation:
where (I'/I)t, (I'/I)i and (I'/I)o are the excimer to monomer fluorescence intensity ratio of Py-3-Py (I'/I) in bulk, inner and outer monolayers, respectively. The values of I't (excimer fluorescence intensity for inner plus outer monolayers) and I'i (excimer fluorescence intensity for inner monolayer) were determined for Py-3-Py in SPMVs obtained from SPMVs incubated with buffer A and buffer A plus TNBS at 4℃ (pH 8.5) (nonpenetrating conditions), respectively.
The effect of methanol on annular lipid fluidity in SPMVs
Annular lipid fluidity in SPMVs was evaluated as previously described [6-9]. Incorporated Py-3-Py in the SPMVs was excited through radiationless energy transfer (RET) from tryptophan (excitation at 286 nm) and the excimer to monomer fluorescence intensity ratio (I'/I) of Py-3-Py was calculated from the 480 nm to 379 nm signal ratio. Taking into account that Förster radius (the RET-limiting distance) for tryptophan-Py-3-Py donor-acceptor pair is 3 nm [28], only Py-3-Py located in annular lipids (close to proteins) was excited, and the fluidity of annular lipids was considered proportional to the I'/I [17-19,21,22]. The efficiency of RET from tryptophan to Py-3-Py was calculated by the equation:
where Id and Ida represent the fluorescence intensity of donor (in this case, endogenous tryptophan) in the absence and presence of acceptor (Py-3-Py), respectively.
The effect of methanol on protein distribution in SPMV lipid bilayer
This experimental determination of protein distribution in SPMV is based on a method previously established for native membranes [8,9,24,25]. Fluorescence intensity of endogenous tryptophan in SPMVs was determined. Following this measurement, the probe Py-3-Py was incorporated at a concentration of 5×10⁻⁷ M (in absolute methanol), and after 10 min, tryptophan emission fluorescence intensity was measured again. The efficiency of RET from tryptophan to Py-3-Py was calculated by the equation 4. The wavelengths of excitation and emission of tryptophan were 286 and 335 nm, respectively.
The effect of methanol on rotational mobility of bulk lipid bilayer SPMVs
The intensity of the components of the fluorescence that were parallel (I∥) and perpendicular (I┴) to the direction of the vertically polarized excitation light was determined by measuring the emitted light through polarizers oriented vertically and horizontally. The polarization (P) was obtained from intensity measurements using P=(I∥-GI┴)/(I∥+GI┴) where G is a grating correction factor for the monochromator's transmission efficiency for vertically and horizontally polarized light. This value is given by the ratio of the fluorescence intensities of the vertical to horizontal components when the exciting light is polarized in the horizontal direction. The polarization was expressed as the anisotropy [r=2P/(3-P)] (equation 5).
The effect of methanol on individual monolayer structure in SPMVs: selective quenching of DPH
This experimental determination of individual monolayer structure in SPMVs is based on a method previously established for LM plasma membranes [29], synaptic plasma membranes (SPM) [30,31], plasma membrane vesicles of Chinese hamster ovary cells (CHO-K1-PMV) [24], plasma membranes of Mar 18.5 hybridoma cells (ATCC-PMV) [25], plasma membrane of myeloma cell line Sp2/0-Ag14 (Sp2/0-PMV) [26] and SPMVs [22]. This method does not simply provide a theoretically calculated or average value but is based on the assumption that the system is composed of fluorescing compartments of different accessibility to TNBS. If the fluorescence intensity, F, and anisotropy, r, are measured simultaneously, then
where Fj is the fraction of fluorescence intensity in compartment j. For a binary system composed of the outer and inner monolayers of the SPMVs, this leads to
where F and Fi are DPH fluorescence obtained for SPMVs isolated from synaptosomes incubated with buffer A and buffer A plus 2 mM TNBS (for 40 min) at 4℃ (pH 8.5) (nonpenetrating conditions), respectively. The value of fluorophore concentration-independent parameter anisotropies, r (anisotropy for both monolayers) and ri (inner monolayer anisotropy), were determined for DPH in SPMVs obtained from synaptosomes incubated with buffer A and buffer A plus TNBS at 4℃ (nonpenetrating conditions), respectively.
The effect of methanol on acyl chain ordering or disordering of outer monolayers of SPMVs lipid bilayers
The fluorescent probes, 16-AP, 12-AS, 9-AS, 6-AS and 2-AS, were excited at 360 nm (4 nm slit width) and those emissions recorded at 445 nm (8 nm slit width) through a sharp cut-off filter (Schott KV418). Corrections for light scattering (membrane suspensions without fluorescent probes) and for fluorescence in the ambient medium (quantified by pelleting the membranes after each estimation) were made routinely, and the combined corrections were less than 9% of the total fluorescence intensity observed for anthroyloxy palmitate or stearate-loaded suspensions. Determination of polarization (P) and anisotropy (r) values were measured as rotational mobility measurement.
RESULTS
Our data presented herein have shown that methanol significantly increased the lateral (even at 500 mM) and rotational (even at 1,000 mM) mobility in the bulk SPMVs lipid bilayer. Methanol increased the annular lipid fluidity in the SPMVs. Furthermore, the methanol has a clustering effect on proteins in the SPMVs. Furthermore, methanol has disordering or ordering effects of SPMVs hydrocarbon interior and interface.
The effect of methanol on the rate and range of lateral mobility of bulk bilayer SPMVs
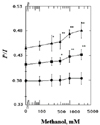
In the present study, incubation with methanol increased the range and rate of lateral mobility of the bulk (inner+outer monolayer) SPMVs at concentration as high as 500 mM (n=5, p<0.05), as demonstrated in Fig. 1. This is indicates that methanol has a strong influence on the lateral mobility of neuronal membranes. However, the main point is the different potencies between ethanol and methanol for SPMVs, in terms of the minimal ethanol or methanol concentration producing a significant increase I'/I. I'/I for Py-3-Py in the bulk SPMVs incubated with 100 mM ethanol was 0.446±0.009** (n=5, p<0.01) and the change in I'/I value after adding 100 mM ethanol was 0.034. The I'/I values for Py-3-Py in the bilayer were 0.412±0.004 (n=5) and 0.356±0.006 (n=5) at 37 and 25℃ (pH 7.4), respectively. Hence the effect of ethanol was equivalent to that produced by a temperature increase of approximately 7.3℃. In this study, I'/I for Py-3-Py in the bulk SPMVs incubated with 1,000 mM methanol was 0.420±0.003** (n=5, p<0.01) and the change in I'/I value after adding 1,000 mM methanol was 0.008. Thus the effect of 1,000 mM methanol was equivalent to that produced by a temperature increase of approximately 1.8℃.
The effect of methanol on the range and rate of transbilayer asymmetric lateral mobility of SPMVs monolayers
The effect of increasing concentrations of methanol on the I'/I values in the individual SPMVs monolayers is shown in Fig. 1. Methanol increased the rate and range of lateral mobility of the outer monolayer (0.464±0.002**, p<0.01, n=5) at 1,000 mM methanol (Fig. 1). The variation in the I'/I values of Py-3-Py in the outer monolayer of SPMVs before and after adding 1,000 mM methanol was 0.019. The I'/I values of Py-3-Py in the monolayer are 0.445±0.003 (n=5), 0.370±0.003 (n=5) at 37 and 25℃, respectively. Based on the aforementioned results at two different temperatures (25 and 37℃), the observed effect by 1,000 mM methanol (different value 0.019) was the same as produced by the temperature increase of approximate 3.1℃. The difference in the I'/I values of Py-3-Py in the outer monolayer of SPMVs before and after adding 2,500 mM methanol was 0.024. The difference was as large as that produced by an approximate 3.8℃ change in temperature on the rate and range of outer monolayer lateral mobility. It had a greater effect on the lateral mobility of the outer monolayer than that of inner monolayer (Fig. 1, filled triangles). Since the change in I'/I values is due primarily from the effect on the outer monolayer, we studied the selective effects of methanol on the rate and range of mobility of the probe.
The effect of methanol on annular lipid fluidity in SPMVs lipid bilayers
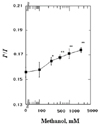
Bae et al. [10] have reported that ethanol increased annular lipid fluidity in SPMVs. The change in the I'/I value for Py-3-Py in the SPMVs before after adding 25 mM ethanol was 0.046. This change 0.046 of 50 mM ethanol was the same as that produced by a temperature increase of approximate 12℃. In this study, methanol increased annular lipid fluidity in SPMVs (Fig. 2). The change the I'/I value for Py-3-Py in the SPMVs before and after adding 1,000 mM methanol was 0.015. The values for Py-3-Py in the bilayer were 0.156±0.004 (n=5) and 0.110±0.002 (n=5) at 37 and 25℃, respectively. Hence the effect by 1,000 mM methanol was the same as that produced by a temperature increase of approximate 4.0℃.
The effect of methanol on protein distribution in SPMVs
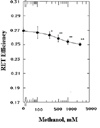
We evaluated protein distribution by RET from tryptophan to Py-3-Py in SPMVs. The RET value of untreated SPMVs was 0.295±0.003 (37℃, pH 7.4) and this was reduced by concentrations of methanol of 250 mM or more (Fig. 3). The RET differences from tryptophan to Py-3-Py in the SPMVs were 0.295±0.009 (n=5) and 0.334±0.012 (n=5) at 37 and 25℃, respectively. Thus the difference by 1,000 mM methanol was the same as produced by a temperature increase of approximate 4.0℃.
The effect of methanol on the range of rotational mobility of bulk SPMVs lipid bilayers
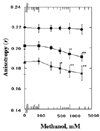
Our lab researchers reported that the anisotropies (r) of DPH in CHO-K1-PMV [24], ATCC-PMV [25], Sp2/0-PMV [26] and SPMVs [10] were 0.195±0.002, 0.188±0.003, 0.183±0.002 and 0.202±0.003, respectively. Ethanol increased these rotational mobilities, with a significant decrease in anisotropy (r) at 25 mM ethanol or more [12,25-27]. In the present study, 1,000 mM methanol lowered this anisotropy (r) (Fig. 4). The difference in anisotropy (r) of the bulk SPMVs lipid bilayer before and after adding 1,000 mM methanol was 0.008. The anisotropy (r) of DPH in the bilayer was 0.202±0.003 (n=5), 0.257±0.002 (n=5) at 37 and 25℃ (pH 7.4), 1.7℃.
The effect of methanol on the range of transbilayer asymmetric rotational mobility of SPMVs monolayers
Fig. 4 shows that the anisotropy (r) of DPH in the TNBS untreated membrane (inner plus outer monolayers) decreased gradually (fluidization) with increasing methanol concentrations (Fig. 4, filled squares). There was a similar, but more gradual, decrease in the calculated anisotropy of the outer monolayer (Fig. 4, filled triangles). However, there was no statistically significant decrease in the anisotropy (the rotational mobility range) of the inner monolayer at any of the methanol concentrations used. The anisotropies (ro) of DPH in the outer monolayer of the SPMVs were 0.186±0.005 and 0.220±0.002 at 37 and 25℃, respectively. Thus, the difference in anisotropy (ro) of DPH in the SPMVs outer monolayer before and after adding 1,000 mM methanol was as large as that produced by a 3.3℃ temperature change. This suggests that the fluidizing effect (range of rotational mobility) of methanol is selective.
Methanol thus affects the lateral and rotational mobilities of SPMVs mainly via an effect on the outer monolayer of the SPMVs. It appears to be the first demonstration that methanol has a differential effect on the transbilayer lateral and rotational mobilities of the inner and outer monolayers of neuronal membranes.
Ordering effects of methanol on the rotational mobility of the SPMVs outer monolayer membrane interface
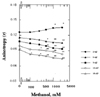
The effect of the methanol on the anisotropy (r) of the 2-AS in the interface of SPMVs is shown in Fig. 5. The methanol increased the anisotropy (r) of the 2-AS (decreased rotational mobility) in interface of SPMVs in a concentration-dependent manner. The significant increases in the anisotropy (r) values by methanol was observed at 1,000 and 2,500 mM (Fig. 5).
The anisotropy (r) value of the 2-AS in interface of SPMVs was higher by 0.009, than those in the same region when 2,500 mm methanol was added. Variation in the anisotropy (r) value was also noticed by the change in temperature. At 37℃ (pH 7.4), the anisotropy (r) of the 2-AS in interface of SPMVs is 0.126±0.002 (n=5). On the other hand, at 25℃ (pH 7.4), the anisotropy (r) of the 2-AS in interface of SPMVs is 0.165±0.003 (n=5). Based on the results obtained at the two different temperatures, the observed effects by the addition of 2,500 mm methanol, different values 0.009 was comparable to the effect of the temperature change by approximately 2.8℃.
Disordering effects of methanol on the rotational mobility of the hydration interior of the SPMVs outer monolayers
The effect of increasing concentrations of the methanol on the anisotropy (r) of the 16-AP, 12-AS, 9-AS and 6-AS in the hydrocarbon interior of SPMVs are shown in Fig. 5. The methanol decreased the anisotropy (r) of the 16-AP, 12-AS, 9-AS and 6-AS (increased rotational mobility) in a concentration-dependent manner. The significant decreases in the anisotropy (r) values of the 16-AP, 12-AS, 9-AS and 6-AS by the methanol in the SPMVs were observed even at such low concentrations as 100, 250, 500 and 500 mM, respectively (Fig. 5). The magnitude of the increased rotational mobility by the methanol was in the order at the position of 16, 12, 9 and 6 of aliphatic chains in phospholipids of neuronal membrane outer monolayers.
The differences in the anisotropy (r) values of the 16-AP found in hydrocarbon interior of SPMVs before and after adding 1,000 mM methanol were 0.016. These can be illustrated by comparing effects of temperature on this parameter. The anisotropy (r) of the 16-AP in hydrocarbon interior of SPMVs is 0.092±0.002 (n=5) at 37℃ (pH 7.4). The anisotropy (r) of the 16-AP in hydrocarbon interior of SPMVs is 0.121±0.003 (n=5) at 25℃ (pH 7.4). Thus, the differences in the anisotropy (r) values at the position of 16 in hydrocarbon interior of SPMVs before and after adding 1,000 mM methanol were 0.016, which were as large as those produced by the temperature raises of approximate 6.4℃ respectively.
DISCUSSION
The effect of methanol on the rate and range of lateral mobility of bulk bilayer SPMVs
Py-3-Py, a pyrene derivative which has successfully been used to quantitate lateral mobility within native membrane [24-26,32,33], was used to determine the rate and range of the lateral mobility in the SPMVs. The excimer fluorescence technique of Py-3-Py has an advantage over its counterpart based on intermolecular excimerization since very small probe concentrations can be used (<10-7 M), and the perturbation of the SPMVs by the probe molecule is minimized.
Our lab. researchers have reported that the I'/I values in CHO-K1-PMVs [24], the ATCC-PMVs [25], the Sp2/0-PMVs [26] and SPMVs [10] were 0.529±0.016, 0.586±0.007, 0.608±0.008 and 0.412±0.005, respectively (at 37℃, pH 7.4). It was not evident why these values differed, as the lipid composition of the different preparations and the fatty acid composition of the individual phospholipids, particularly cholesterol content, were not examined. In the CHO-K1-PMVs, ATCC-PMVs, Sp2/0-PMVs and SPMVs, ethanol increased the lateral diffusion of Py-3-Py in a concentration-dependent manner, and significant increases in I'/I values were observed at above 50, 25, 25 and 25 mM ethanol, respectively.
The effect of methanol on the range and rate of transbilayer asymmetric lateral mobility of SPMVs monolayers
The covalently linked trinitrophenyl group has a broad absorbance range with a maximum near 420 nm. This peak has a large overlap with the fluorescence emission of Py-3-Py. This overlap is responsible in part for the high transfer (quenching) efficiency of the probe. Approximately half of the Py-3-Py fluorescence was quenched in the trinitrophenylated SPMVs. When the TNBS labeling was conducted under penetrating conditions (37℃), nearly 95% of the fluorescence of the Py-3-Py was quenched. Values of excimer to monomer fluorescence intensity ratio (I'/I) of Py-3-Py in intact SPMVs (both monolayers) and TNBS-treated SPMVs (inner monolayer) are listed in Table 1. The I'/I of Py-3-Py in the outer monolayer were 0.066, greater than calculated for the inner monolayer. This means that the rate and range of lateral mobility of the outer monolayer is greater than that of the inner monolayer.
The TNBS labeling reaction must be carefully monitored in order to ensure that the reagent does not penetrate into the synaptosomes and label both sides of the plasma membrane. For this purpose, three control procedures are routinely used. First, as an "internal control", mitochondria and microsomes are isolated from the synaptosomes from which the trinitrophenylated plasma membranes are isolated. If any significant degree of penetration of TNBS into the synaptosome occurs, these intracellular organelles also become trinitrophenylated. Only 1.8±0.2% and 2.1±0.4% of microsomal and mitochondrial phosphatidylethanolamine were trinitrophenylated by our treatment. In contrast, when the TNBS treatment is performed under penetrating conditions (37℃), 60~80% of the phosphatidylethanolamine in microsomes or mitochondria is trinitrophenylated [22]. Second, approximately half of the Py-3-Py fluorescence was quenched in the trinitrophenylated SPMVs. Third, the trinitrophenylation of the synaptosome may alter membrane enzyme activities. Unlike the results obtained under penetrating conditions (37℃), the activity of neither Na+, K+-ATPase nor 5'-nucleotidase was significantly altered by the TNBS reaction under nonpenetrating conditions [22].
It is important to note that the term "membrane fluidity" is often misused. It arose from a combination of spectroscopic studies, the realization that membranes can be regarded as a two dimensional fluids, and the desire to obtain a simple single physical parameter that would describe their properties. The difficulty with the membrane fluidity concept is that any physical parameter chosen will be a function of the spectroscopic method employed, specifically its particular time window, and the properties of the probe (shape, charge, location etc) [34]. The membrane fluidity concept also depends on the assumption that the hydrophobic region of cell membranes is structurally and dynamically homogeneous, an assumption that is now under serious challenge. Thus while it may be true to say that bulk or average spectroscopic properties of cell membranes may not be useful in building a hypothesis for the pharmacological action(s) of drug(s), local properties pertaining to domains or the immediate environment of a membrane protein maybe very relevant.
As already pointed out, membrane bilayer mobility is one of the important factors controlling membrane microviscosity or fluidity, membrane bilayer mobility includes lateral mobility, rotational mobility and flip-flop and it is well known that the most important of these is lateral mobility. We are pleased to have been able to develop and describe a fluorescence quenching technique that can measure membrane transbilayer lateral mobility. We therefore believe that this study will make a contribution to the study of drug-membrane interactions.
The effect of methanol on annular lipid fluidity in SPMVs lipid bilayers
The important finding is that there was a greater increase in annular lipid fluidity than lateral and rotational mobilities.
The mechanism of action of the methanol on the annular lipid fluidity may be as follows. Annular lipids are known to surround proteins with or without being physically in contact with them. Methanol may alter the stereo structure or dynamics of annular lipids including proteins by combining with lipids, especially with the annular lipids, increasing their mobility and indirectly affecting the dynamic behavior of the proteins. Nevertheless is likely that the observed effects are due not only to the lipids, but are magnified by interaction between lipids and proteins.
The effect of methanol on protein distribution in SPMVs
The protein clustering is probably caused by interaction between phospholipids, especially annular lipid fluidity, whose movement is increased by methanol, and the proteins around them.
The effect of methanol on the range of transbilayer asymmetric rotational mobility of SPMVs monolayers
The structures of the intact SPMVs (inner plus outer monolayers), and the outer (extracellular) and the inner (intracellular) monolayers were evaluated with DPH as a fluorescent reporter and trinitrophenyl groups as a quenching agents. Trinitrophenylation of the intact synaptosomes at 4℃ (nonpenetrating conditions) results in covalent attachment of trinitrophenyl quenching agents to the outer monolayers. Approximately half of the DPH fluorescence was quenched in the trinitrophenylated SPMVs outer monolayer. When TNBS labeling was conducted in penetrating conditions (37℃), greater than 90% of the fluorescence of the DPH was quenched. Values of fluorescence parameters in intact SPMVs (both monolayers) and in TNBS-treated SPMVs (inner monolayer) are listed in Table 1. The anisotropy (r) of DPH in the inner monolayer was 0.034, significantly greater than that calculated for the outer monolayer, as demonstrated in Table 1.
This is in agreement with the results of previous studies [24,30,31,35-38] but inconsistent with two studies [39,40]. Plasma membranes consist of two monolayers that are asymmetric in lipid distribution, electrical charge, fluidity, protein distribution and function, and does not appear to be coupled [41]. It had been widely known that different lipids could affect the physical properties of the membrane. Membrane cholesterol is one of the major lipids of plasma membranes and is asymmetrically distributed in the outer and inner monolayers of membranes [35,38,42,43]. Interest in rigidifying effect on membrane above the phase transition temperature of the membrane lipid [38]. In erythrocytes, differences in fluidity between the two monolayes have not been consistently observed. Some studies have reported that the outer monolayers was less fluid [39,40], whereas other studies have found that the outer monolayer was more fluid compared with the inner monolayer [36,37]. The finding that the SPMVs inner monolayer was less fluid than the outer monolayer was consistent with data showing that the SPM inner monolayer contains approximately 7-times as much cholesterol compared with the outer monolayer [38]. Thus, a possible explanation for the asymmetric lateral and rotational mobility in the outer and inner monolayers of SPMVs is that their cholesterol content differs.
Ordering effects of methanol on the rotational mobility of the SPMVs outer monolayer membrane interface
Ethanol in vitro had a greater fluidizing effect in the outer monolayer as compared to the inner monolayer. Thus, ethanol exhibits a specific rather than nonspecific fluidizing action within transbilayer of synaptic plasma membranes [30], cultured mouse myeloma cell line Sp2/0-Ag14 [26], cultured Mar 18.5 hybridoma cells [25] and synaptosomal plasma membrane vesicles [10,24]. In this study, methanol in vitro had a greater fluidizing effect in the outer monolayer as compared to the inner monolayer of SPMVs. However, the membrane outer monolayer's fluidity may vary at different positions [44]. Thus, this study was carried out using 16-AP, 12-AS, 9-AS, 6-AS and 2-AS those reflecting mobility at the 16, 12, 9, 6 and 2 position of aliphatic chains present in phospholipids of SPMVs.
Possible mechanisms of action of ethanol
Ethanol's effects on membranes, whether bulk or individual domains, have been studied under the assumption that the membrane is in bilayer form. In fact, increasing evidence indicated that membrane lipids can adopt a non-bilayer form [45]. In addition, investigations of the effects of higher alkanols and the corresponding alkane on membrane luciferase indicate that the anesthetic targets could be hydrophobic pockets on membrane proteins rather than lipids [13,46-53]. For example, ethanol specifically and selectively affects the function of the GABA-coupled chloride channel [54,55]. Still, a large, diverse collection of physiological agonists produces the alterations in membrane fluidity as well as specific ligand-receptor interaction [56]. Hence the function of membrane proteins may be modulated secondarily to changes in membrane fluidity. Conversely, ethanol may have a direct effect on certain receptors, receptor-gated ion channels, or membrane-bound enzymes, and, as result, on membrane lipids. As mentioned above, ethanol (at 50 mM) increased both lateral and rotational mobility of SPMVs lipid bilayer, and the increases were mainly due to effects on the outer monolayer of the SPMVs. However, ethanol (at 50 mM) increased annular lipid fluidity in SPMVs by 37.2% and altered the protein distribution by 15.6%. Furthermore, methanol, like ethanol, increased both lateral (at 500 mM) and rotational (at 1,000 mM) mobilities of SPMVs lipid bilayer, and the increases were mainly due to effects on the outer monolayer of the SPMVs. And we confirmed that the increase on annular lipid fluidity and the change on protein distribution induced by methanol were far greater than the increase on lateral and rotational mobilities of the SPMVs lipid bilayer. Direct effects of ethanol on protein appear to have magnified such effects on the lipids. This conclusion can be drawn because Bae et al. [10] confirmed that the increase on annular lipid fluidity and the change on protein distribution induced by ethanol were far greater than the increase on lateral and rotational mobility of the SPMVs lipid bilayer.
It is difficult to exclude the possibility that the interaction of ethanol with neuronal membrane lipids has some influence on the ion channels or receptors that associate tightly with membrane lipids through covalent and non-covalent bonds. That is to say, before, during or even after the interaction of ethanol with the proteins [13,49-51,54,55], the fluidization of membrane lipids may provide an ideal microenvironment for optimum anesthetic effects.
In conclusion, the present data suggest that methanol or ethanol, in addition to its direct interaction with proteins [13,49-51,54,55], concurrently interacts with membrane lipids, fluidizing the membrane, and thus inducing conformational changes of proteins known to be intimately associated with membrane lipids. It may be premature to take sides in the controversy over whether membrane lipids or membrane proteins are the site of ethanol action.

 XML Download