

 PDF
PDF ePub
ePub Citation
 Print
Print


INTRODUCTION
Bipolar cells, located in the outer nuclear layer and called second order neurons, have synapses with photoreceptors, horizontal cells, and interplexiform cells (IPCs). It is known that bipolar cells are contrast detectors [1] that relay signals from the photoreceptors to ganglion cells, because bipolar cells initially have a center-surround antagonistic receptive field [2,3]. Many results suggest that the surround receptive fields of bipolar cells are provided by horizontal cells with large receptive fields [4,5]. Coupling of gap junction channels located in the horizontal cell membrane provides the large receptive fields of the horizontal cells. Most retinal cells have over 70 types of electrical gap junctions between similar or different neurons within the vertebrate retina, including gap junctions between bipolar cells [6-9]. As the receptive fields of bipolar cells are provided by the outer retinal cells [3-5], it is arguing how the light activities of bipolar cells will really happen in vivo when gap junction conductance in the outer retinal neurons are changed.
Gap junction modulators include nitric oxide (NO) and dopamine (DA), which act through the intracellular messengers cGMP and cAMP, respectively [10-16]. Application of sodium nitroprusside (SNP, a NO donor) or 8-bromo-cGMP to pairs of cultured horizontal cells decreases the amplitude of the gap junction coupling current. The uncoupling of horizontal cell soma by DA is accompanied by a decrease in gap junction particle density and is caused by reducing both the duration and frequency of channel opening [17,18]. The results of these actions are to offer the possibility that bipolar cell light activity can be modulated by both NO and/or DA relating to gap-junction coupling.
To study the effects of gap junction coupling on bipolar cell light activities, we recorded corneal electroretinogram (ERG) b-waves under a photopic illumination level before and after intravitreal injection of meclofenamic acid (MFA), a well-known non-specific gap junction blocker, NO, and DA-related (DA, SKF 38393, quinpirole, SCH 23390, sulpiride) drugs, and also co-applied these drugs with MFA. Here, we show that MFA strongly amplified corneal ERG b-waves compared to that of the control. After increasing b-wave amplitude with NO and dopamine, no further increase was observed by co-applying these drugs and MFA. Our results demonstrate that the central receptive response of ON-bipolar cells can be altered by uncoupling the gap junction in the retinal neurons related to NO and DA.
METHODS
Animals
We used goldfish (Carassius auratus) for our experiments. The goldfish were 7~9 cm in length and weighed 10~16 g. We purchased the fish at a fish shop and maintained them at room temperature in an aquarium under a 12 hour light/dark daily cycle. The fish were fed twice daily in the morning and evening.
Electroretinography
Fish were fully anaesthetized in a water bath containing 0.02% MS-222 (tricaine methanesulfonate) and placed on a wet plaster fish bed with one eye in the upward direction. During recording, aerated water containing 0.005% MS-222 continuously flowed though the mouth and over the gills to maintain anesthesia. Ag-AgCl pallets were used as a reference in the mouth, and ground electrodes were placed behind the fish body. A brush made with pig hair was mounted on a microelectrode holder (MEH6SF, WPI, Sarasota, FL, USA) for the recording electrode and contained Ringer's solution inside for electrical conduction. A hydraulic micromanipulator (MO-10, Narishige, Tokyo, Japan) system was used to move the tip of the brush in microscale to contact the center of the cornea for corneal ERG recordings. The recording electrode was connected to positive inputs of a differential amplifier (gain of 10000, bandpass filter 0.1~100 Hz: DAM50, WPI). Amplified signals were acquired using Axoscope software (Axon Instrument, Union City, CA, USA).
Light stimulation
Rod and cone signals both converge on bipolar cells in the goldfish retina [19,20]. Using the separation processing [21,22], only cone signals contributed to the ERG b-wave activated by ON-bipolar cells in the cone system, as we light adapted the fish with background illumination to saturate the rods. We used steady background illumination of 10 µW/cm2, which lead to compression of rod responses, and light beam stimulation of 980 µW/cm2 to evoke the b-wave response. For photopic ambient light condition, the background illumination of 10 µW/cm2 is sufficient illumination level based on results of Hood and Finkelstein [23]. We have already identified that 0.4 µW/cm2 in light intensity is sufficient for photopic ambient light level in behavioral experiments with goldfish [24]. The light source was a white light beam from a beam projector (BX324, LG Corp., Seoul, Korea). The optical densities of the light beam were measured with a radiometer (IL1400A, International Light, Inc., Newburyport, MA, USA).
Intravitreal injection
All drugs were diluted in a control goldfish Ringer's solution (in mM: 125 NaCl, 2.6 KCl, 2.5 CaCl2, 1 MgCl2, 10 glucose, and 10 HEPES; pH 7.8). All drug injections were performed on fully anaesthetized fish. After obtaining control ERG data for each goldfish, the ERG measurements were obtained as soon as 2 µl of Ringer solution as a control condition and an agent solution for the drug treatment condition were injected sequentially every hour into one eye of the goldfish using an intraocular kit (IO-KIT, WPI). All chemicals were obtained from Sigma Chemical Company (St. Louis, MO, USA).
RESULTS
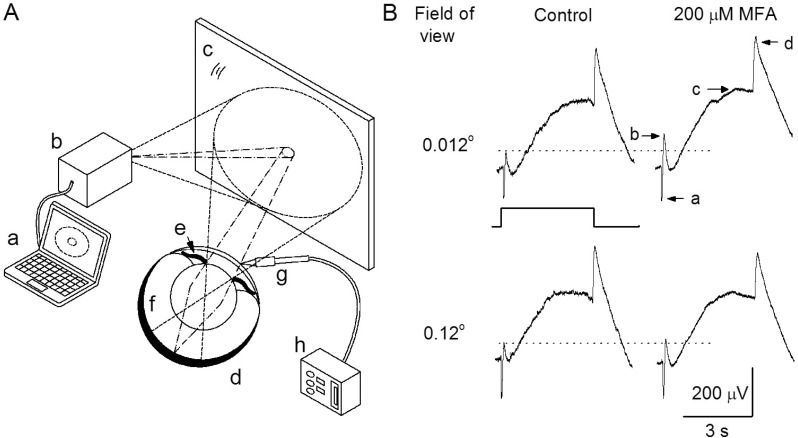
Fig. 1 shows the diagram of the light stimulation process for ERG measurement. The white circle light (980 µW/cm2) emitted from the beam projector reached the eye of the goldfish and was reflected 45° onto a mirror (screen role gyeomham). As a lens is present inside the eye during the corneal ERG measurements, the circle light beam coming into the eye should have a path as shown in Fig. 1. First, we observed the effect of MFA on the ERG according to two different circle light beam diameters. The small and large sizes of the light beam imaged on the surface of the mirror were 6 mm and 60 mm in diameter corresponding to the values of 0.012° and 0.12° in the field of view. In control conditions, the amplitudes of a- and b-wave by large size stimulation were each 12±3.4% and 9.2±3.0% higher than those by the smaller size light beam (Fig. 1B. upper and down, left). After injecting of 200 µM MFA into the vitreous, ERG b-wave amplitudes increased 43±11% (mean±standard error) by the small size light beam (Fig. 1B. upper) and 8.1±1.8% by the large size light beam (Fig. 1B. down). The a- and d-waves remained unchanged. The enhancement of the b-wave by the small and large sized stimuli were statistically significant (n=14, p<0.05 paired t-test). In the presence of 200 µM MFA, the enhancement by the small size beam was about 5 times larger than the enhancement by large size beam. Thus, we used the small sized beam as the light stimulation in this study.
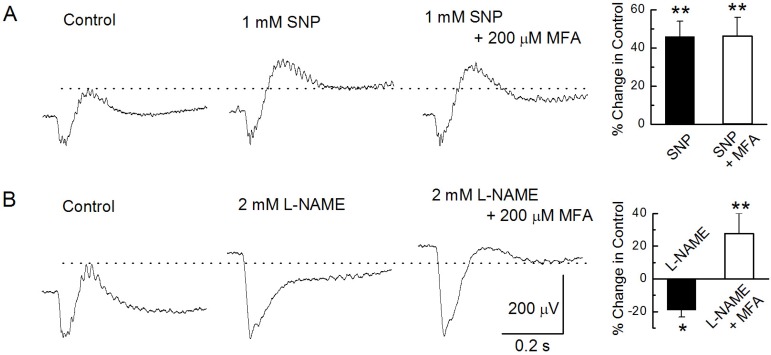
Intravitreal injection of 1 mM SNP enhanced b-wave amplitude by 46±8% of the control (n=18, p<0.01, paired t-test). This enhanced amplitude by SNP did not increase more after further injection of a mixture of 1 mM SNP and 200 µM MFA (Fig. 2A). Injection of NG-nitro-L-arginine methyl ester (L-NAME), a nitric oxide synthase (NOS) inhibitor, resulted in a greatly increased a-wave by 103±18%, whereas the b-wave decreased slightly by -19±4.3% (n=6, Fig. 2B). The effects of 2 mM L-NAME on a- and b-waves were statistically significant (p<0.01 and p<0.05, respectively). The b-wave peak amplitude that decreased following administration of L-NAME was enhanced significantly by 51±12% (n=6, p<0.01, paired t-test) compared to the peak of L-NAME by further injection of a mixture of 2 mM L-NAME and 200 µM MFA into the vitreous.
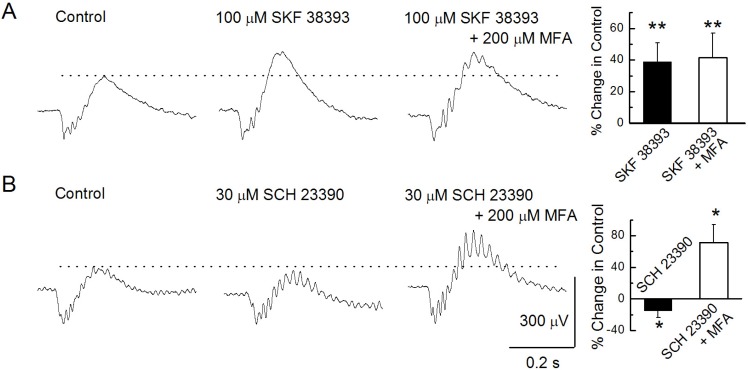
To evaluate the contribution of DA receptors on ERG b-waves, we used the dopamine D1 and D2 receptors related drugs alone first and then a mixture of these with MFA (Figs. 3, 4). DA is known to reduce gap-junction coupling through a protein kinase A metabolic cascade in retinal cells. Fig. 3 shows the relationship between dopamine D1 receptor-related drugs and MFA on b-waves at the photopic level. Injection of 100 µM SKF 38393, a D1 receptor agonist, greatly enhanced b-wave amplitude by 39±12% compared to that of the control (n=12, p<0.01, paired t-test; Fig. 3A). This enhanced b-wave peak following the 100 µM SKF 38393 injection did not change much (2±0.4%) after a further injection of a mixture of 100 µM SKF 38393 and 200 µM MFA. The injection of 30 µM SCH 23390, a dopamine D1 receptor antagonist, reduced b-wave amplitude by -15±9% compared to that in the control (Fig. 3B). This reduced peak was enhanced by up to 71±16% compared to that in the control. This reduction and increase were both statistically significant (n=7, p<0.05, paired t-test).
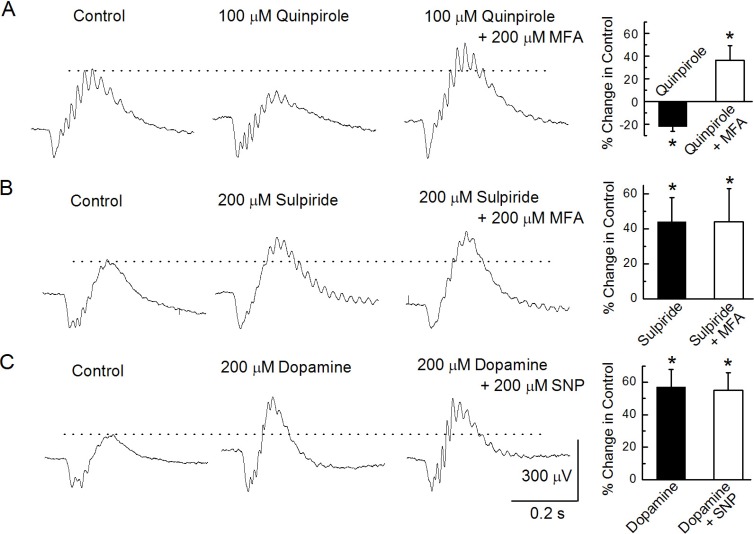
The b-wave decreased by -22±4.3% (n=6, p<0.05, paired t-test; Fig. 4A) compared to that in the control following an injection of 100 µM quinpirole, a selective D2-dopamine receptor agonist. This decreased amplitude b-wave was significantly enhanced by 36±13% (p<0.05, paired t-test) compared to that in the control after an additional injection of a mixture of 100 µM quinpirole and 200 µM MFA into the vitreous. In contrast, when the retina was treated with 200 µM sulpiride, a D2-dopamine receptor antagonist, the b-wave was enhanced by 44±14% compared to that in the control (n=7, p<0.05, paired t-test; Fig. 4B). This enhanced peak remained unchanged after a further injection of a mixture of 200 µM sulpiride and 200 µM MFA. To investigate the relationship between exogenous NO and DA on b-waves, we injected 200 µM DA first and then injected a mixture of 200 µM DA and 1mM SNP (Fig. 4C). The injection of DA enhanced b-wave amplitude by 57±11%, which was statistically significant compared to that in the control (n=8, p<0.05, paired t-test). This enhanced b-wave peak following DA administration did not change after a further injection of 200 µM DA and 1 mM SNP (Fig. 4C).
DISCUSSION
Our findings indicate that the b-wave amplitude of ERG retinal activity at the photopic level, as related to gap junctions in the goldfish retina, could be mainly dependent on activation by NO- and DA-related agents.
We observed enhanced ERG b-waves when the gap junction was blocked by MFA under the photopic level in the goldfish retina. It has been reported that the Cx35/36 gap junction protein is expressed on the dendrites of ON-type bipolar cells in the goldfish retina [6,25]. The Cx35 protein was originally observed in perch and skate, and Cx36, a homolog of Cx35, has been observed in mouse retinas [26,27]. Both CX35 and Cx36 are blocked reversibly by the gap junction blockers MFA and mefloquine [6,28,29]. In our experiment, we used MFA, as it is soluble in water and blocks Cx35/36 gap junction channels.
The largest ERG change by 2 mM L-NAME is the a-wave, known to be generated by hyperpolarization of the photoreceptors. Thus, an enhanced a-wave could be seen as a photoreceptor contribution [30]. Intense staining of nicotinamide dinucleotide phosphate diaphorase (NADPH-d), an enzyme associated with NOS activity, is observed in the photoreceptor and horizontal cells in the goldfish retina [31-33]. As the b-wave results were only related to MFA, it can be construed that both NO and MFA affected b-wave amplitude by the same mechanism associated with gap junctions.
We believe that DA may act on the gap-junction coupling of ON-bipolar cells either directly or indirectly. D1-like receptors are expressed by horizontal and ON-bipolar cells, and D2-like receptors are expressed by rod, cones, and IPCs in the goldfish retina [34-37]. In our experiments, the D1-like receptor agonist SKF 38393 produced a significant increase in b-wave amplitude. Decreased b-wave amplitude by a D1-like receptor antagonist such as SCH23390 was enhanced by MFA.
A different modulation of the ERG was reported by Huppe-Gourgues et al. (2005), who showed that a D1 agonist provokes a reduction in the ERG b-wave components in the rabbit retina [38]. They also used D1- and D2-like DA receptor agonists and antagonists. Their results with DA-related agents conflict with our data. We think that these differences are attributed to differences in experimental methods such as light stimulation and species. While we used a small-sized beam that was reflected by a mirror and a wide projected background light, they used a flash lamp placed in front of the animal's head for light stimulation. We think this stimulation works as a condition of the wide full field. When we used the large size light beam corresponding to the value of 0.12° in the field of view for light stimulation, the amplification by MFA on b-wave appeared weak. However, the light stimulus with small sized light beam in our experiment could be considered a small spot light. Hedden and Dowling (1978) reported that DA enhances the center response of bipolar cells to small spots of light in isolated goldfish retinas [39], whereas it reduces the surround response to an annual light. Furthermore, while DA-IPCs occur in the goldfish retina, the DA retinal cells are amacrine cells in the rabbit [40-45].
D2-like receptors are expressed by rod, cones, and DA-IPCs in the goldfish retina [34-37]. In our experiment, almost no changes in ERG a-waves were observed to be caused by D2-like receptor activation. If the D2 receptors between rods and cones are blocked with an antagonist, rod-cone gap-junction coupling increases [46], but DA on photoreceptor cells is involved in mediating nonelectrophysiological events (e.g., retinomotor moments) and has no direct effect on electrophysiological activities of photoreceptors [44].
D2-like receptor agonists and antagonists produced opposite responses of the ERG b-wave; a slight decrease compared to the control and an increase, respectively. These effects of D2 agents are assumed to have resulted from activity of the DA-IPCs, which form output connections directed to horizontal cells, bipolar cell dendrites, and the terminals of rods and cones in the outer plexiform layer. Although Harsanyi and Mangel (1992) have shown that DA activation of D2 autoreceptors on IPCs inhibits DA release onto horizontal cells and causes increased electrical coupling between them in the goldfish retina [35], uncoupling of horizontal cells alters the receptive fields of retinal bipolar cells in the carp retina [47]. We do not rule out whether the effects of D2 agents on bipolar cells were indirectly mediated by gap junction channels of horizontal cells or/and directly of bipolar cells, as it is likely that both are included.
The enhanced b-wave amplitude by DA remained unchanged after further application of a DA and SNP mixture. Single-channel data show that NO reduces gap junction channel open probability by reducing channel opening frequency, and that DA reduces gap junction channel opening by reducing both channel opening duration and opening frequency in dissociated horizontal cells of the teleost retina [12,17]. Although these results offer the possibility of a synergistic interaction between DA and NO for junction conductance, we did not observe any synergistic interactions between them on the ERG b-waves. Our results suggest that DA and NO are not independent but interact.
 XML Download