

 PDF
PDF ePub
ePub Citation
 Print
Print


ABBREVIATIONS
TC
tuberculous colitis
UC
ulcerative colitis
2-DE
2-dimentional elextrophoresis
IBD
inflammatory bowel disease
CD
crohn's disease
MS
mass spectrometry
MALDI TOF/TOF
matrix-assisted laser desorption ionization time-of-flight/time-of-flight spectrometry
EDTA
ethylenediaminetetraacetic acid
H&E
hematoxylin & eosin
CHAPS
3-[(3-cholamidopropyl)dimethylammonio]-1-propanesulfonate
IPG
immobilized pH gradient
IEF
isoelectric focusing
SDS
sodium dodecyl sulfate
ACN
acetonitrile
DDT
dichloro-diphenyl-trichloro-ethane
TFA
trifluoroacetic acid
MS
mass spectrometry
CID
channel iron deposits
PAGE
polyacrylamide gel electrophoresis
CRTH2
chemoattractant receptor of T 2 cells
INTRODUCTION
Colitis is a human inflammatory disease caused by a variety of factors including infection, reduced blood supply, and inflammatory bowel disease (IBD) [1]. Tuberculous colitis (TC), an extrapulmonary tuberculosis, is a rare chronic disease present in immunosuppressed patients and individuals from developing countries. TC is similar to Crohn's disease (CD) in terms of its pathological and roentgenographical findings [2,3]. In this disease, colonoscopy shows characteristic mucosal changes including mucosal nodules and ulcers [3]. Ulcerative colitis (UC) is associated with pathological mucosal damage and ulceration of the colon with general inflammatory processes [4]. UC belongs to a type of IBD along with Crohn's disease [4]. Although numerous studies have attempted to reduce and treat UC and TC occurrences, their precise pathogenesis remains unclear. Further studies are therefore required to improve our pathophysiological understanding of colitis and for the development of novel therapeutic targets.
The relative levels of cellular proteins have a direct effect on disease initiation and progression. Hence, an understanding of protein expression and modification is crucial for the identification of the key cellular pathways and functional modulators associated with colitis. Proteomics is useful for the identification of proteins involved in various pathophysiological conditions and for developing strategies related to disease progression [5-7]. This technology involves the use of several experimental methods, including 2-dimensional electrophoresis (2-DE) and mass spectrometry (MS), to isolate and identify changes in protein expression and modification under defined conditions, such as disease or drug treatments [8-10]. Previous studies used proteomics to elucidate the changes in the host cell proteome between both UC and normal colon mucosa and CD and UC [11,12]. However, to our knowledge no full proteomic analysis of the colonic mucosa tissue of TC and UC patients has been conducted. In the present study, we aimed to identify proteomic alterations in mucosal TC and UC tissue in comparison to healthy colon tissue using 2-DE and matrix-assisted laser desorption ionization time-of-flight/time-of-flight spectrometry (MALDI TOF/TOF). Furthermore, we performed a comparative analysis of TC and UC to clarify the diagnostic classifications of these diseases.
METHODS
Materials
Materials for 2-DE and MS were purchased from BioRad (Hercules, CA, USA) or Applied Biosystems (Foster City, CA, USA).
Preparation of mucosal tissue from colitis patients
All experiments were performed in accordance with the institutional guidelines of Ulsan University and were approved by the Institutional Review Board of Ulsan University Gangneung Asan Hospital, Gangneung-city, Korea. Mucosal tissue samples from normal volunteers (n=6) and patients with TC (n=6) and UC (n=6) were removed by colonic biopsy or mucosal resection and rinsed in physiological salt solution (in mM; NaCl 136.9, KCl 5.4, CaCl2 1.5, MgCl2 1.0, NaHCO3 23.8, EDTA 0.01). Samples were then snap-frozen in liquid N2 for proteomic analyses.
Measurement of morphological changes
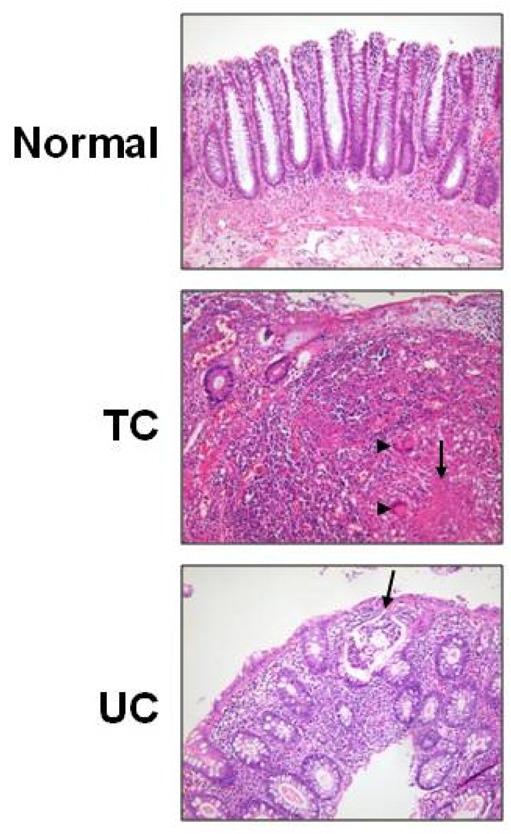
Isolated tissue was fixed in 4% paraformaldehyde and embedded in paraffin for histological analysis. Tissues were sliced into 6~8 µm-thick sections, and stained using hematoxylin and eosin (H&E). Images were captured using a confocal microscope (FV-1000 spectral, Olympus, Japan).
Two-dimensional electrophoresis
Isolated colon tissue was homogenized in 2-DE lysis buffer (8 M urea, 2 M thiourea, 65 mM dithiothreitol, 2% CHAPS, and 1× complete protease inhibitor cocktail) (Roche Applied Science, Germany) and centrifuged at 12,000× g for 10 min at 10℃. Supernatants were harvested and the samples diluted in rehydration buffer containing 8 M urea, 0.28% dithiothreitol, 0.5% CHAPS, 10% glycerol, 0.5% appropriate ampholyte, and 0.002% bromophenol blue. IPG strips (pH 3~10 nonlinear) were rehydrated at 50 V for 12 h at 20℃ in 120 µg of whole cell protein extract. IEF was performed sequentially using a Bio-Rad Protein IEF Cell at 100 V for 2 h, 250 V for 1 h, 500 V for 1 h, 1,000 V for 1 h, 3,000 V for 1 h, 5,000 V for 1 h, and 8,000 V for 9 h at 20℃. Following IEF, individual strips were equilibrated for 20 min in 10 ml of equilibration buffer containing 50 mM Tris-HCl (pH 6.8), 6 M urea, 20% glycerol, 2% sodium dodecyl sulfate (SDS), 0.01% bromophenol blue, and 5 mM tributylphosphine. Second-dimension separation was performed on 12% SDS-polyacrylamide gels at 30 V for 1 h followed by 80 V until the bromophenol blue dye reached the bottom of the gel. To visualize proteins, gels were fixed with 50% methanol, 12% acetic acid for 1 h, and washed twice for 20 min in 50% ethanol. Gels were then sensitized for 1 min in 0.02% Na2S2O3 followed by washing three times for 20 sec in distilled water. Gels were labeled with 0.2% silver nitrate solution containing 0.075% formaldehyde for 20 min, and rinsed twice in distilled water. Development was performed in 0.0002% Na2S2O3, 0.025% formaldehyde, and 3% Na2CO3 for 10 mins. The reaction was terminated by addition of 1.5% EDTA. Gels were silver-stained and visualized using a densitometer (Versa Doc Imaging System 1000TM; Bio-Rad). The densities of silver-stained spots from three different experimental sets were detected and counted by both automation and manual spot-detection, and statistically analyzed using PDQuest software (version 7.1.1, Bio-Rad).
In-gel digestion and mass spectrometry
Protein spots were excised from silver-stained gels and destained with freshly prepared 15 mM K3[Fe(CN)6]/50 mM Na2S2O3 for 10 min. Gel pieces were then washed three times with distilled water for 15 min at room temperature. After dehydrating the spot with ACN for 15 min, each spot was dried in a SpeedVac centrifuge for 10 min. Samples were then reduced with DTT and subsequently alkylated with iodoacetamide in a dark chamber. The gel pieces were washed three times with distilled water for 15 min, dehydrated with ACN for 15 min, and dried in a SpeedVac centrifuge for 10 min. Proteins were then digested overnight in 20-µl digestion buffer (12.5 ng/µl trypsin in 20 mM NH4HCO3) at 37℃ for a minimum of 16 h. Peptide samples were extracted three times with 50 µl of 50% ACN/0.1% formic acid and dried in a SpeedVac centrifuge. Extracts were resuspended in 10 µl of 0.5% TFA, and desalted using ZipTip C18 microtips (Millipore, Billerica, MA, USA), according to the manufacturer's instructions. Peptide samples were eluted in 2 µl of α-cyano-4 hydroxycinnamic acid solution prepared in 50% ACN/0.5% TFA, and 0.5 µl was loaded onto stainless steel sample target plates. Peptide mass spectra were acquired using a MALDI-TOF/TOF mass spectrometer (AB4700, Applied Biosystems) in the positive ion reflector mode. For precursor ion selection, all fractions were measured by single MS prior to MS/MS. The 10 most-abundant precursor ions per sample were selected for subsequent fragmentation by high-energy CID. The collision energy was set to 1 keV and air was used as the collision gas. The criterion for precursor selection was a minimum signal-to-noise ratio of 20. The mass accuracy was within 100 ppm of the mass measurement and within 0.2 Da for CID experiments. Other search parameters were: trypsin, one missed cleavage, variable modification of carbamidomethyl, oxidation, propionamide and pyro-glu (N-term), peptide charge of 1+ and monoisotopic. Spectra were processed and analyzed using the Global Protein Server Explorer 3.0 software (Applied Biosystems). We used internal MASCOT (Matrix Science, London, UK) programs to match MS and MS/MS data against the database information. The data obtained were screened against rat databases downloaded from both NCBI (http://www.ncbi.nlm.nih.gov) and the Swiss-Prot/TrEMBL homepage (http://www.expasy.ch/sprot).
RESULTS
Morphological characteristics of colitis
To confirm the morphological changes observed during colitis, the histology of colonic mucosal tissue from the normal, TC and UC groups were compared using H&E staining. TC group tissues exhibited typical multinucleated giant cells and granuloma with necrosis. UC group show crypt abscess, respectively (Fig. 1).
Proteomic profiles of normal, TC and UC tissue
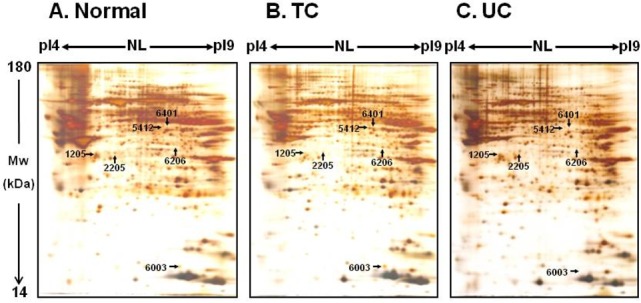
Proteomic analysis was used to investigate changes in the cellular proteome during colitis. Total proteins isolated from the colonic mucosal tissue of the normal, TC and UC groups were focused on non-linear IPG strips (pH 3~10), separated by 12% SDS-polyacrylamide gel electrophoresis (PAGE), and visualized by silver staining. Protein spots were analyzed using the PDQuest software. The average matching ratios were approximately 76~82% within groups and 67~70% between groups. More than 1,000 proteins were detected per silver-stained gel. Moreover, the expression profiles of TC and UC mucosa were similar compared to healthy tissue (Fig. 2).
Comparative analysis of differentially expressed proteins
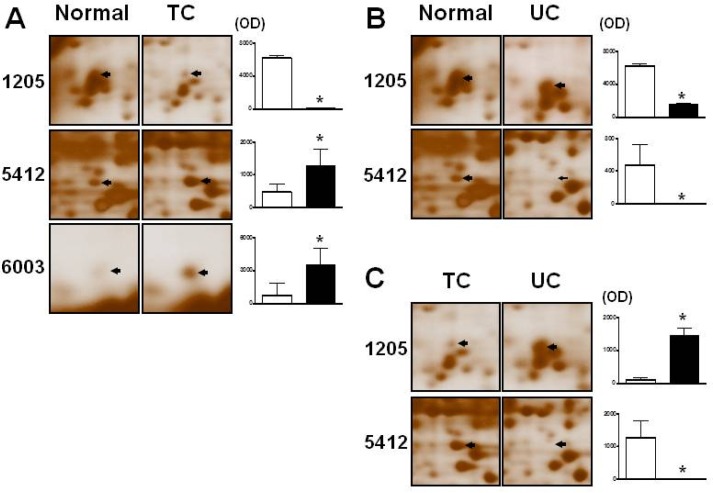
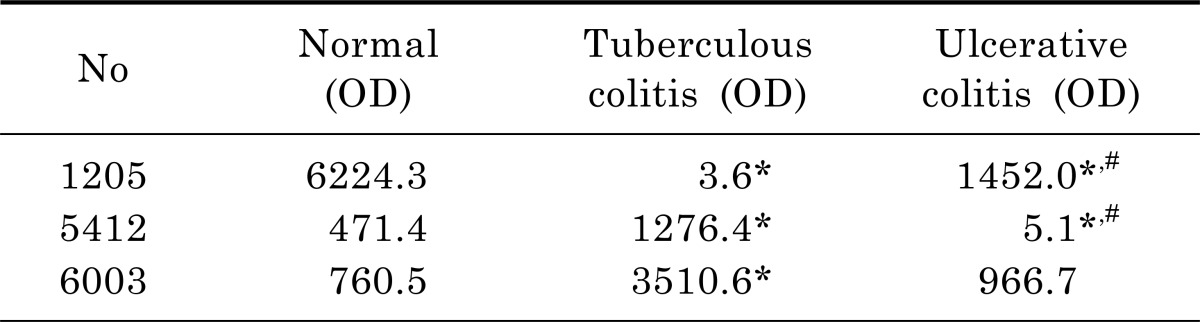
To further compare the protein spots on 2-DE gels, we compared TC and UC colonic mucosal protein gels to those of normal mucosa. Three protein spots showed differential expression in the TC tissue compared with healthy controls (Fig. 2, 3). Of these, spots 5412 and 6003 showed increased expression, whilst that of spot 1205 decreased (Table 1; Fig. 3A). Two protein spots were differentially expressed in UC and normal colonic mucosal tissue (Fig. 3B). These spots, 1205 and 5412, were weakly expressed in UC compared with the normal mucosa (Table 1).
Identification of proteins associated with colitis
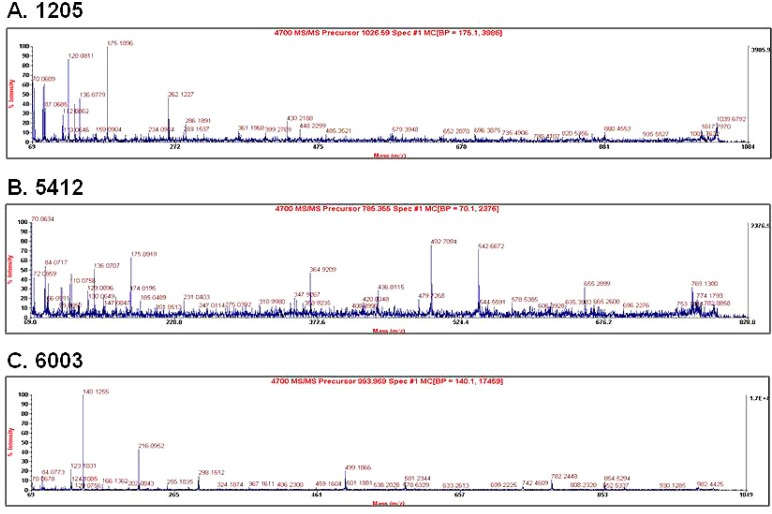
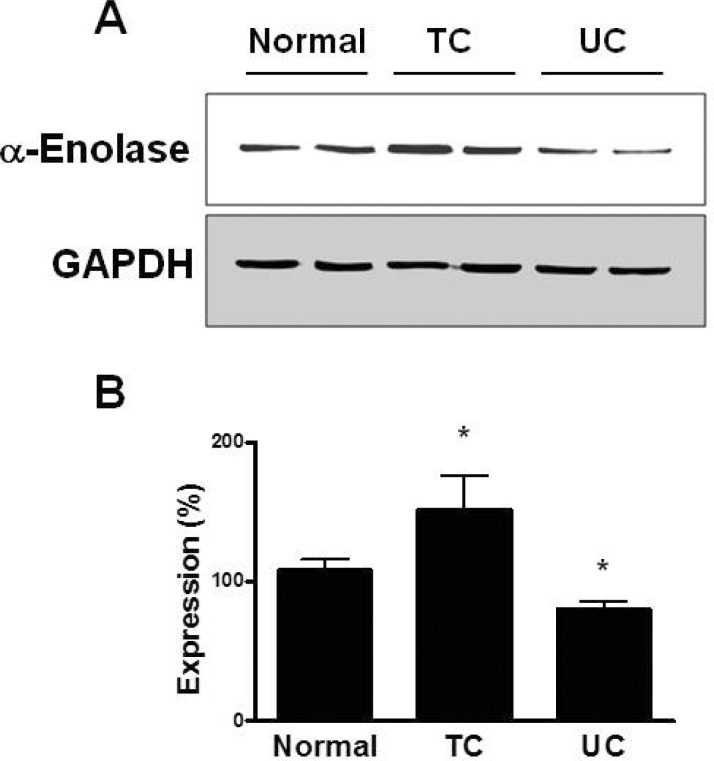
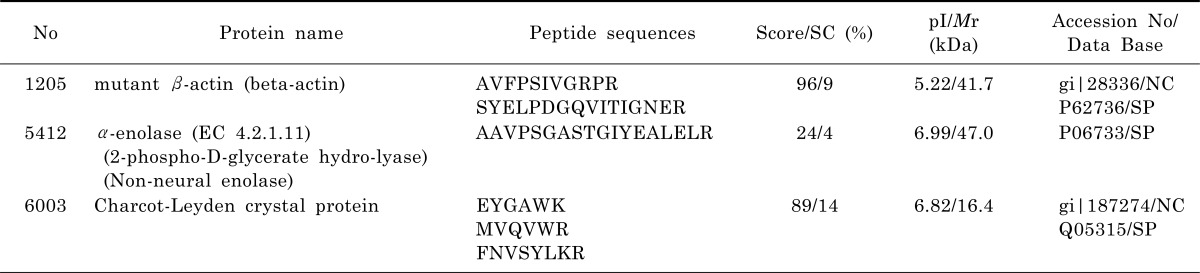
We next sought to identify the nature of the differentially expressed protein spots by MALDI-TOF/TOF analysis. Protein spots 1205, 5412, 6003 were identified as mutant β-actin, α-enolalse, and charcot-Leyden cystal protein, respectively (Table 2), implying their association with colitis pathogenesis. Fig. 4 shows the MALDI MS/MS spectra of these proteins in the mucosal tissue of colitic patients. We additionally confirmed the expression of α-enolase in mucosal tissue from TC and UC samples by immunoblot analysis. The expression levels of α-enolase were significantly higher in TC compared with normal tissue, but were lower in UC mucosal tissue (Fig. 5).
DISCUSSION
In this study, we identified proteins differentially expressed in colonic mucosal tissues from UC and TC patients, compared with those from the normal colon. More than 1,000 proteins were detected on silver-stained gels of whole protein extracts from each mucosal sample. The expression of three protein spots differed between TC tissue and normal controls; two (5412, 6003) displayed increased expression, while one (1205) exhibited decreased levels. In a comparison of normal and UC tissue, two protein spots displayed decreased expression. These results imply that protein changes are common in colitic mucosa and that these altered pathways may be closely related to the occurrence or development of UC and TC [11]. A previous proteomic analysis of UC and normal colon mucosa suggested differential expression profiles in CD and UC tissues [12]. Thus, proteomic analysis is a powerful tool that can provide new insights into the pathogenesis of various systemic diseases, including intestinal inflammation, allowing the identification of potential targets for novel therapeutic drugs.
The symptoms and signs of TC are vague and nonspecific. Nonspecific chronic abdominal pain is the most common complaint, occurring in 80 to 90% of TC patients [13]. Anorexia, fatigue, fever, night sweats, weight loss, diarrhea, constipation, or blood in the stools may be present [14]. Patients with UC display fever, abdominal pain, weight loss, and bloody stools [14,15]. For therapeutic and prognostic purposes, these symptoms are typically classified as mild, moderate, or severe. The severity of these symptoms often correlates with the anatomical extent of the disease, parameters that will ultimately guide therapy. The Mayo scoring system has been used both to judge disease severity and monitor patients during therapy [16]. Colonoscopic findings of TC are varied, and include ulcers, strictures, nodules, pseudopolyps, fibrous bands, fistulas and deformed ileocecal valves [17]. The main differential diagnosis at endoscopy is CD [2]. This distinction is important as the use of steroids for the misdiagnosis of CD may lead to disastrous consequences in patients with TC enteritis [18]. The colonoscopic findings of UC include a loss of vascular marking, petechiae, exudates, touch friability, and frank hemorrhage [4]. In the advanced stages of UC and TC, the clinical manifestations and colonoscopic findings differ to such an extent that they can be easily differentiated [3]. However, in the early stages of UC and TC, differential diagnosis is difficult as both the clinical manifestations and colonoscopic findings are similar. New diagnostic strategies to clarify the diagnosis are therefore required. In this study, we demonstrate that α-enolase (Spot 5412) levels decrease in UC mucosa compared with normal mucus, and increase in TC compared with normal tissue. Consistent with this finding, it has been reported that α-enolase mRNA levels are upregulated in IBD [19] and down-regulated at the protein level in UC [20]. Moreover, α-enolase reactive antibodies were found in approximately 10% of patients with UC [21]. High concentrations of α-enolase have been reported in the cerebrospinal fluid and strongly correlated to astrocytoma [22]. Increased levels of α-enolase were also identified in patients suffering from recent myocardial infarction or cerebrovascular accidents [23,24], implying a prognostic value for α-enolase levels. These results indicate this protein may be related to the pathological events of colitis. Furthermore, α-enolase displayed increased expression levels in TC compared to UC, which was upregulated three-fold in TC compared with normal tissue. Therefore, this protein may play a more important role in TC pathophysiology, implicating it as an important biomarker candidate for the differential diagnostic classification of UC and TC, and as a therapeutic target for colitis.
We additionally identified the differential expression of Charcot-Leyden crystal protein and mutant β-actin, both of which were increased in TC. Charcot-Leyden crystals protein is a hallmark of eosinophilic inflammatory reactions such as asthma and parasitic infection, and is often present in inflamed tissue and patients with allergies [25]. Although its overall biological function is unknown, it possesses lysophospholipase activity and displays genomic similarity with galectin-10 [26]. Several reports suggest that phospholipases and galectins are strongly related to colitis progression in a variety of cells, and Charcot-Leyden crystal protein represents a biomarker of CRTH2 activation in the blood [27,28]. In addition, actin plays a central role in cell motility, including cytokinesis, cell locomotion, exocytosis and endocytosis, through formation of the actin cytoskeleton. Actin mutations are related to physiological functions and disorders in a variety of cells [29,30]. Moreover, the mutant β-actin resulted from a single amino acid exchange resulting in high β-actin levels that induced diminution of the myoblast cell surface [31]. From these results, the mucosal proteins Charcot-Leyden crystal and mutant β-actin, represent a marker of TC and UC.
In conclusion, we identified three proteins in TC and two in UC whose levels were altered compared to normal tissue. Two of these proteins were differentially expressed between TC and UC. The expression of α-enolase were significantly increased in TC but decreased in UC compared with the normal mucosa. These findings suggest a valuable resource for the molecular analysis of the pathophysiology of human colitis and new biomarkers for the differential diagnosis of TC and UC.
 XML Download