

 PDF
PDF ePub
ePub Citation
 Print
Print


Abstract
The effect of cyclosporin A (CsA), an immunosuppressant, on human ether-a-go-go-related gene (HERG) channel as it is expressed in human embryonic kidney cells was studied using a whole-cell, patch-clamp technique. CsA inhibited the HERG channel in a concentration-dependent manner, with an IC50 value and a Hill coefficient of 3.17μM and 0.89, respectively. Pretreatment with cypermethrine, a calcineurin inhibitor, had no effect on the CsA-induced inhibition of the HERG channel. The CsA-induced inhibition of HERG channels was voltage-dependent, with a steep increase over the voltage range of the channel opening. However, the inhibition exhibited voltage independence over the voltage range of fully activated channels. CsA blocked the HERG channels predominantly in the open and inactivated states rather than in the closed state. Results of the present study suggest that CsA acts directly on the HERG channel as an open-channel blocker, and it acts independently of its effect on calcineurin activity.
References
1. Sigal NH, Dumont FJ. Cyclosporin A, FK-506, and rapamycin: pharmacologic probes of lymphocyte signal transduction. Annu Rev Immunol. 1992; 10:519–560.

2. Steiner JP, Dawson TM, Fotuhi M, Snyder SH. Immunophilin regulation of neurotransmitter release. Mol Med. 1996; 2:325–333.
3. Matsuda S, Koyasu S. Mechanisms of action of cyclosporine. Immunopharmacology. 2000; 47:119–125.
4. Italia JL, Bhardwaj V, Kumar MN. Disease, destination, dose and delivery aspects of ciclosporin: the state of the art. Drug Discov Today. 2006; 11:846–854.
5. Taub⊘ll E, Gerdts R, Gjerstad L. Cyclosporin A and brain excitability studied in vitro. Epilepsia. 1998; 39:687–691.
6. Wong M, Yamada KA. Cyclosporine induces epileptiform activity in an in vitro seizure model. Epilepsia. 2000; 41:271–276.
7. Damjanovich S, Aszalós A, Mulhern SA, Szöllösi J, Balázs M, Trón L, Fulwyler MJ. Cyclosporin depolarizes human lymphocytes: earliest observed effect on cell metabolism. Eur J Immunol. 1987; 17:763–768.
8. Tordai A, Or R, Gelfand EW. Effects of changes in membrane potential on the cyclosporin-induced inhibition of T-cell proliferation. Biochem Biophys Res Commun. 1992; 185:363–369.
9. Panyi G, Gaspar R, Krasznai Z, ter Horst JJ, Ameloot M, Aszalos A, Steels P, Damjanovich S. Immunosuppressors inhibit voltage-gated potassium channels in human peripheral blood lymphocytes. Biochem Biophys Res Commun. 1996; 221:254–258.
10. Onuma H, Lu YF, Tomizawa K, Moriwaki A, Tokuda M, Hatase O, Matsui H. A calcineurin inhibitor, FK506, blocks voltagegated calcium channel-dependent LTP in the hippocampus. Neurosci Res. 1998; 30:313–319.
11. Sanguinetti MC, Jurkiewicz NK. Two components of cardiac delayed rectifier K+ current. Differential sensitivity to block by class III antiarrhythmic agents. J Gen Physiol. 1990; 96:195–215.
12. Trudeau MC, Warmke JW, Ganetzky B, Robertson GA. HERG, a human inward rectifier in the voltage-gated potassium channel family. Science. 1995; 269:92–95.
13. Curran ME, Splawski I, Timothy KW, Vincent GM, Green ED, Keating MT. A molecular basis for cardiac arrhythmia: HERG mutations cause long QT syndrome. Cell. 1995; 80:795–803.
14. Viskin S. Long QT syndromes and torsade de pointes. Lancet. 1999; 354:1625–1633.
15. Suessbrich H, Waldegger S, Lang F, Busch AE. Blockade of HERG channels expressed in Xenopus oocytes by the histamine receptor antagonists terfenadine and astemizole. FEBS Lett. 1996; 385:77–80.
16. Taglialatela M, Castaldo P, Pannaccione A, Giorgio G, Annunziato L. Human ether-a-gogo related gene (HERG) K+ channels as pharmacological targets: present and future implications. Biochem Pharmacol. 1998; 55:1741–1746.
17. Suessbrich H, Schönherr R, Heinemann SH, Attali B, Lang F, Busch AE. The inhibitory effect of the antipsychotic drug haloperidol on HERG potassium channels expressed in Xenopus oocytes. Br J Pharmacol. 1997; 120:968–974.
18. Zhou Z, Gong Q, Ye B, Fan Z, Makielski JC, Robertson GA, January CT. Properties of HERG channels stably expressed in HEK 293 cells studied at physiological temperature. Biophys J. 1998; 74:230–241.
19. Hamill OP, Marty A, Neher E, Sakmann B, Sigworth FJ. Improved patch-clamp techniques for high-resolution current recording from cells and cell-free membrane patches. Pflugers Arch. 1981; 391:85–100.
20. Cayabyab FS, Schlichter LC. Regulation of an ERG K+ current by Src tyrosine kinase. J Biol Chem. 2002; 277:13673–13681.
21. Cockerill SL, Tobin AB, Torrecilla I, Willars GB, Standen NB, Mitcheson JS. Modulation of hERG potassium currents in HEK-293 cells by protein kinase C. Evidence for direct phosphorylation of pore forming subunits. J Physiol. 2007; 581:479–493.
22. Jo SH, Hong HK, Chong SH, Won KH, Jung SJ, Choe H. Clomipramine block of the hERG K+ channel: accessibility to F656 and Y652. Eur J Pharmacol. 2008; 592:19–25.
23. Lee SY, Kim YJ, Kim KT, Choe H, Jo SH. Blockade of HERG human K+ channels and IKr of guinea-pig cardiomyocytes by the antipsychotic drug clozapine. Br J Pharmacol. 2006; 148:499–509.
Fig. 1.
Concentration dependence of CsA-induced inhibition of IHERG. (A) Superimposed IHERG traces were elicited with 4-s depolarization to +20 mV from a holding potential of –80 mV, and the tail current was recorded at –60 mV for 6 s in the absence and presence of 0.3, 1, 3, and 10μM CsA, as indicated. The protocol was applied every 15 s. The dotted line represents zero current. (B) Concentration-dependent curve of inhibition by CsA for steady-state currents (open circle) measured at the end of a depolarizing pulse to +20 mV or peak tail currents (closed circle). The respective percentage inhibitions were plotted against various concentrations of CsA. The solid lines are fitted to the data points by the Hill equation. Data are expressed as mean±SEM.
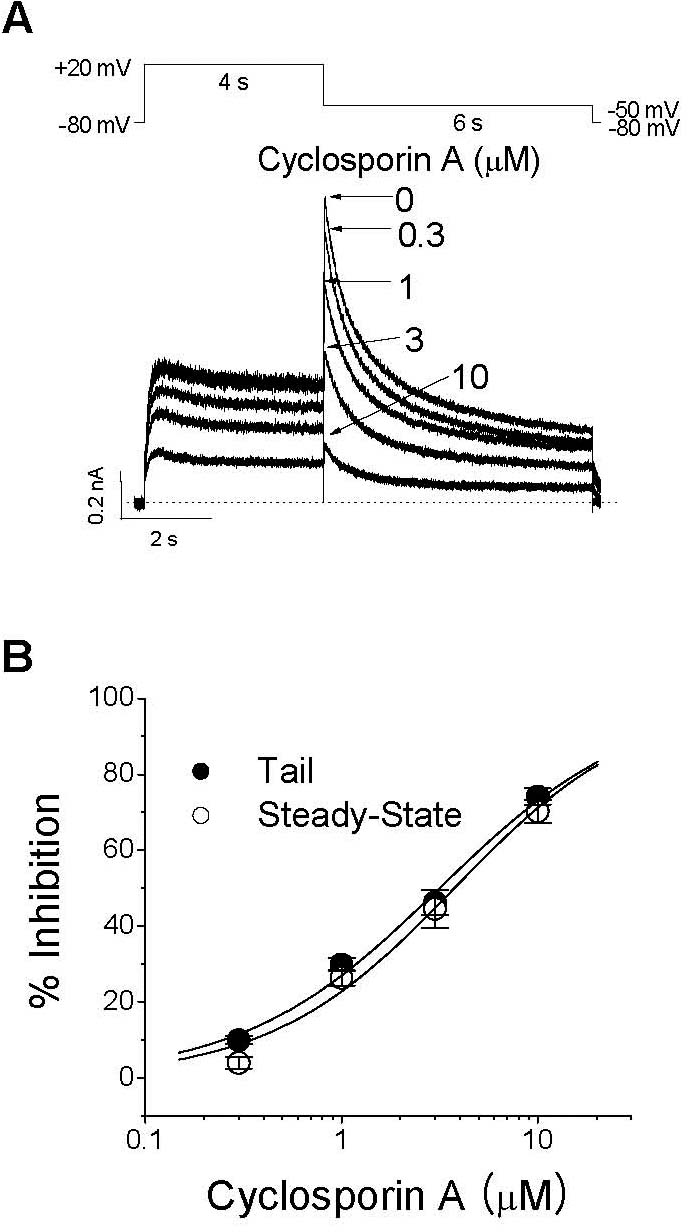
Fig. 2.
The effects of a calcineurin inhibitor on the inhibition of IHERG by CsA. Representative superimposed currents were elicited with 4-s depolarization to +20 mV from a holding potential of –80 mV, and the tail current was recorded at –60 mV for 6 s every 15 s. (A) Control current, the current recorded after 5-min exposure to 10μM cypermethrine, and the current measured after a further 3-min treatment with 3μM CsA are shown. The dotted line represents zero current. (B) Peak tail currents under a set of experimental conditions (A) were normalized to those of the control, and are displayed as a percentage of inhibition to show the effects of 10μM cypermethrine (n=5), 10μM cypermethrine with 3μM CsA (n=5), and 3μM CsA (n=7, Fig. 1). Data are expressed as mean±SEM.
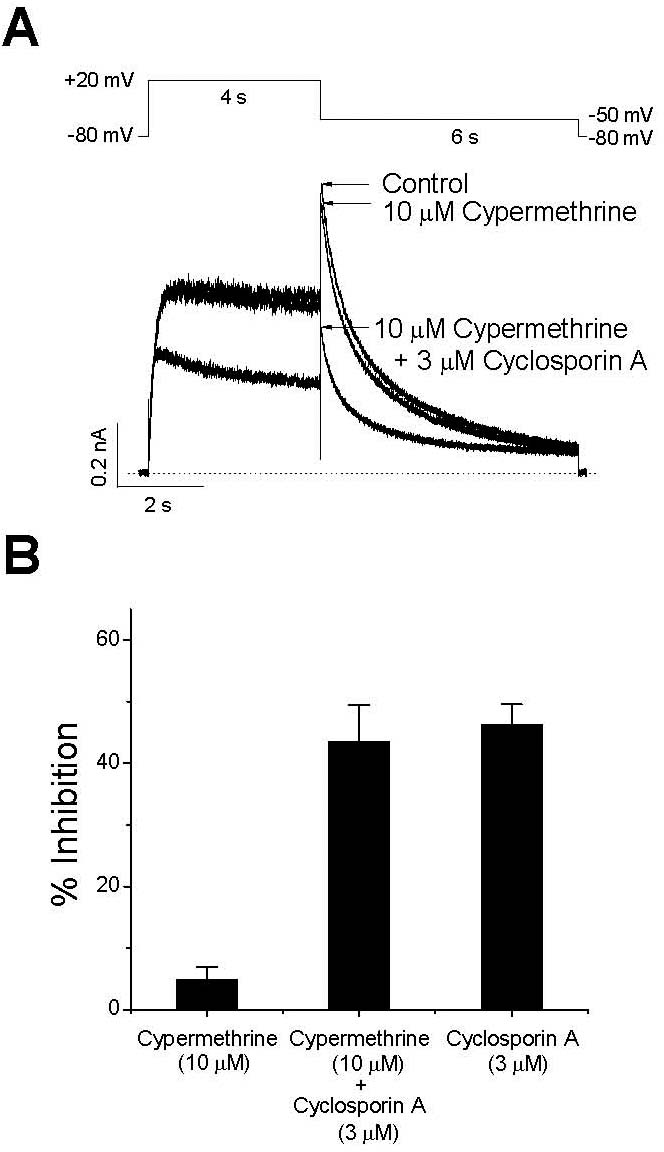
Fig. 3.
Effect of CsA on the IHERG-voltage (I-V) relationship. (A) Representative superimposed current traces recorded under control conditions and 3-min exposure to 3μM CsA. IHERG was produced by applying 4-s depolarizing pulses between –70 and +60 mV in 10-mV increments every 15 s from a holding potential of –80 mV. Tail current was recorded at –60 mV for 6 s. The dotted lines represent zero current. (B) The I-V relationships for IHERG were measured at the end of the depolarizing pulses and for peak tail current. (C) Normalized activation curves were recorded under control conditions and 3 min after exposure to 3μM CsA. The solid lines represent the activation curves obtained by normalization to the tail peak amplitude from (A) and by fitting those data to the Boltzmann equation (see METHODS, equation 2).
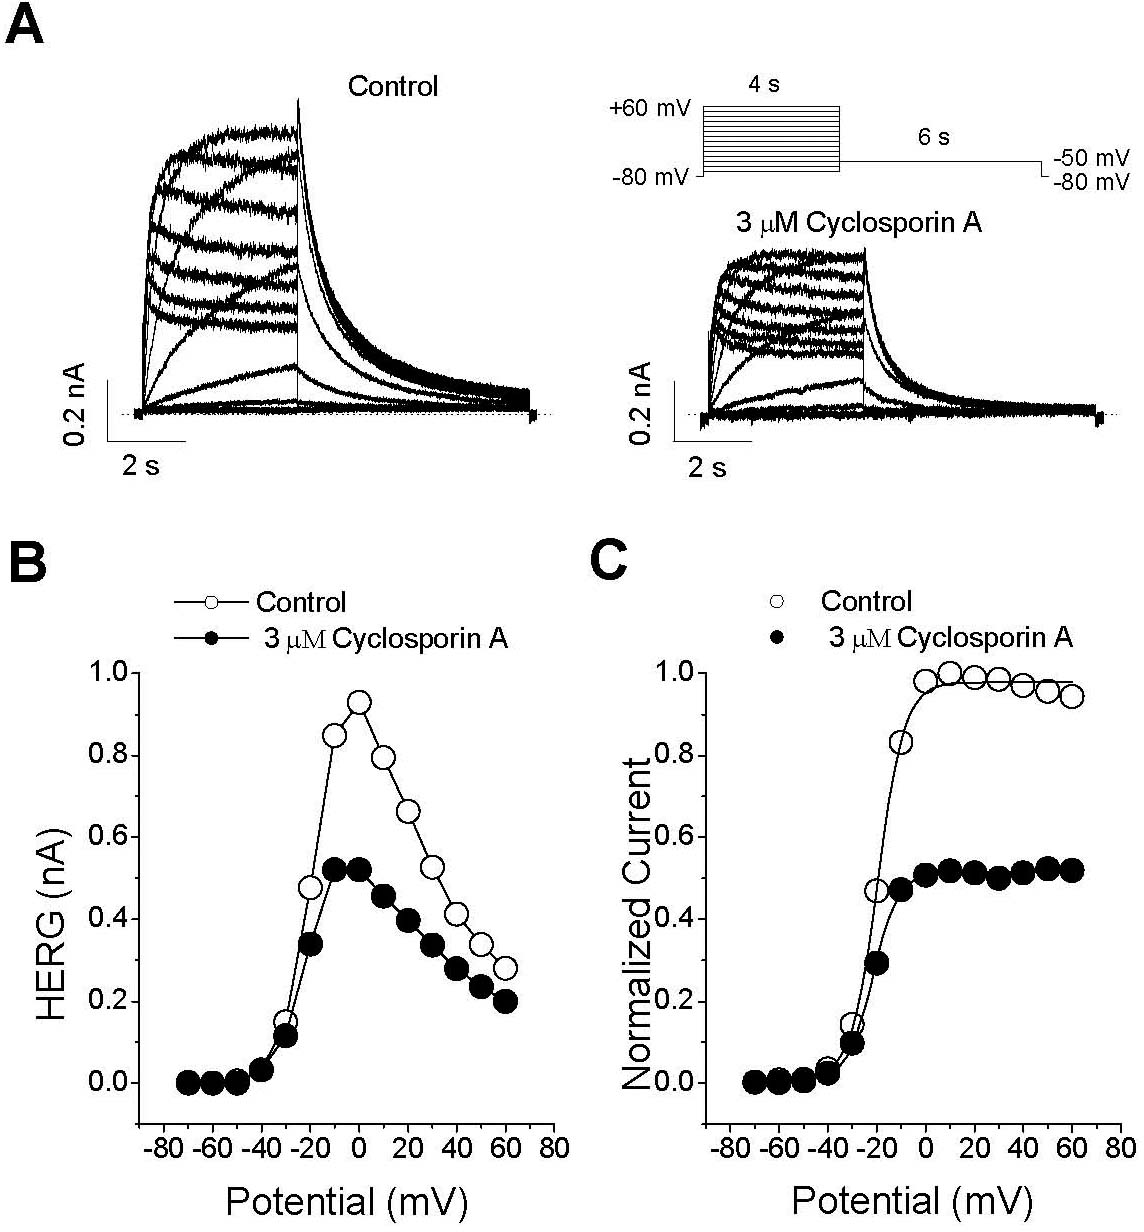
Fig. 4.
Voltage dependence of CsA-induced inhibition of IHERG. (A) Representative superimposed current traces under control conditions and in the presence 3μM CsA selected at three different potentials (–20, 0 and +60 mV) recorded using the pulse protocols. The dotted lines represent zero current. (B) Percentage of current inhibition (closed triangle) at different membrane potentials. The tail currents in the presence of 3μM CsA were normalized to the tail current obtained under control conditions. The dashed line represents the activation curve of the HERG channel under control conditions, which was calculated by measuring tail current amplitudes and by fitting those data to the Boltzmann equation (see METHODS, equation 2). For potentials positive to 0 mV, the solid line was drawn from a linear curve fitting (n=5; ∗p<0.05 versus data at –20 mV). Data are expressed as mean±SEM.
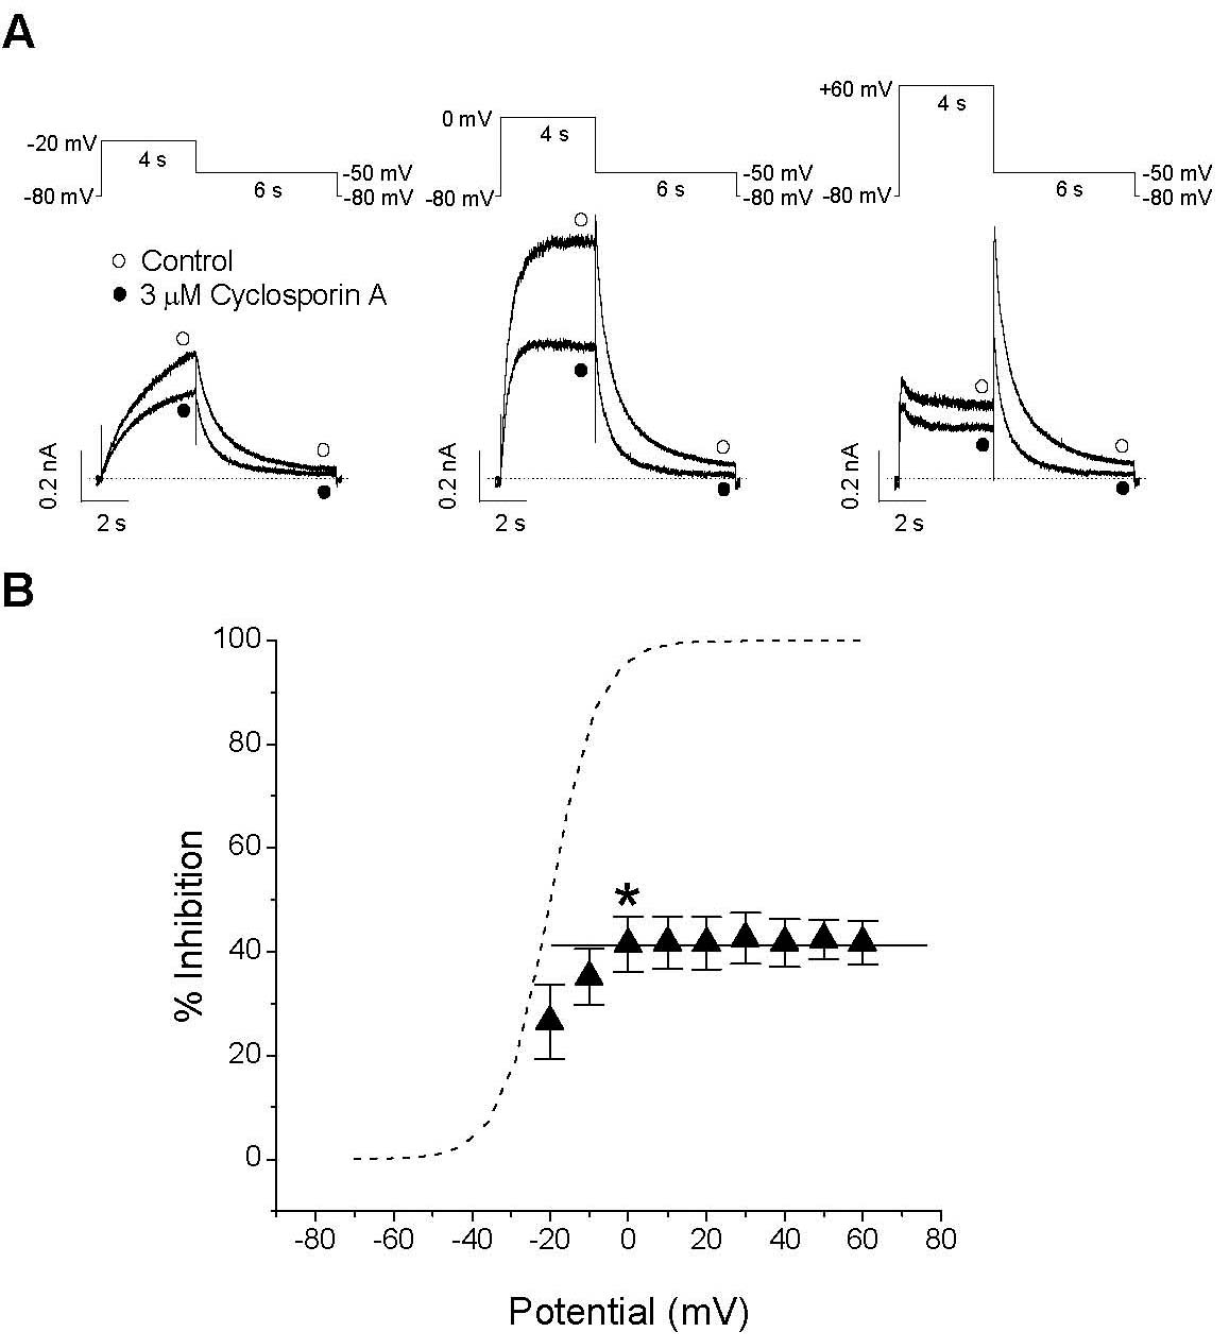
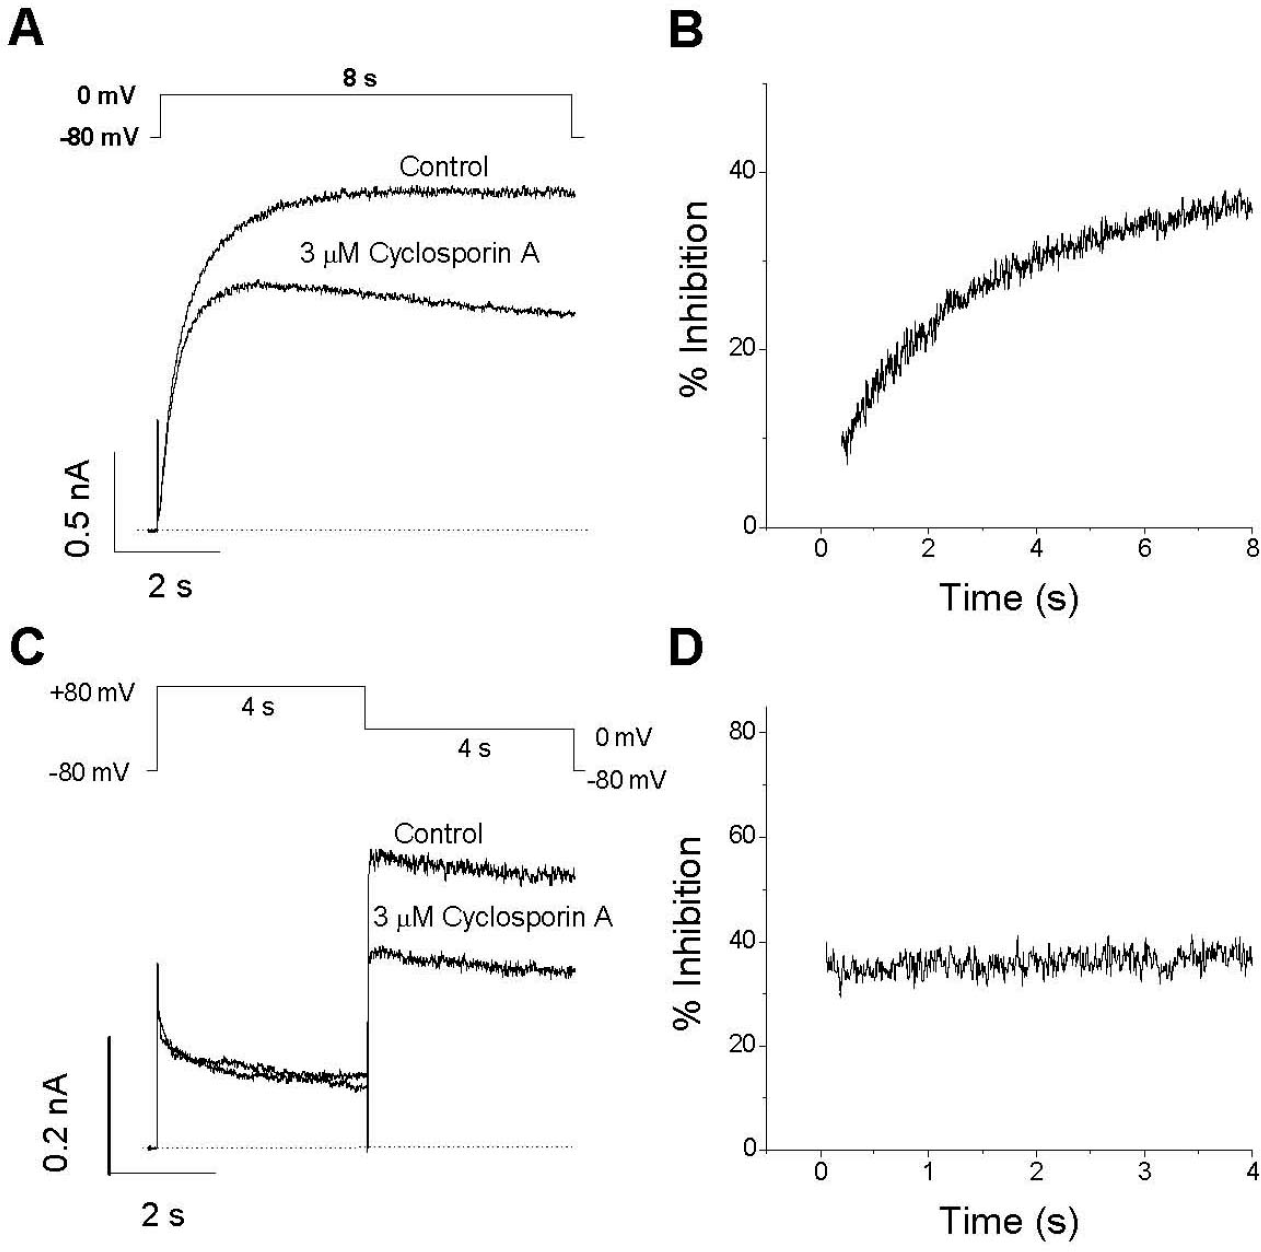
Fig. 5.
State-dependent inhibition of IHERG by CsA. (A) Representative superimposed current traces under control conditions and after application of 3μM CsA for 3 min. Cells were held at a holding potential of –80 mV to the channels in the closed state before a single depolarizing step to 0 mV for 8 s resumed in the presence of CsA. (B) The % inhibition was obtained by division and plotted as a function of time. A strong time-dependent development of IHERG inhibition by CsA was detected, suggesting an open channel block by CsA. (C) Superimposed typical current traces under control conditions and after application of 3μM CsA for 3 min with a holding potential of –80 mV, which were obtained by a first 4-s depolarizing pulse of +80 mV followed by a second 4-s depolarizing pulse of 0 mV. (D) The normalized fractional inhibition. The % inhibition upon channel opening during the second voltage step (0 mV) was obtained by division and plotted against time. Maximum inhibition was detected in the inactivated state during the first step pulse, and no further time-dependent inhibition occurred upon channel opening during the second voltage step. The dotted lines represent zero current.
 XML Download