

 PDF
PDF Citation
 Print
Print


INTRODUCTION
As the epidemiological transition continues to progress, cancer has become one of the most prevalent diseases globally. Cancer imposes a large burden on national health systems, and this phenomenon has commonly appeared in both developed and developing countries (1). In Korea, cancer has been the leading cause of mortality since the beginning of the 2000s, and the incidence of 'all cancers' has increased annually (2). The economic burden of cancer also increases continuously which has been measured in many studies (345).
It is important to understand the magnitude of the burden of disease on a quantitative scale as this can affect decisions made regarding health-care policies such as setting priorities for allocation of resources, health-care research and interventions, and may identify the effects of such interventions. In addition, it may help identify vulnerable groups. One of the metrics used in the summary measures of population health is the disability-adjusted life year (DALY). A DALY for a disease is equal to the sum of the years of life lost (YLL) due to premature death and the years lived with disability (YLD) due to the morbidity of the disease. DALY has been a commonly used metric for estimating the global burden of disease since the 1990s and was also introduced in Korea and used in many studies measuring the burden of several diseases (678910).
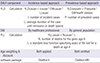
The Institute for Health Metrics and Evaluation, which leads the Global Burden of Disease (GBD) research, published the GBD for 2010 in 2013 (11). This study introduced new methodology for measuring the burden of disease in many aspects. The key aspects of the GBD 2010 study include, first, that DALYs were calculated based on the prevalence of disease instead of the incidence (12). Second, age-weighting and discounting for time, which had been debated, were omitted in the calculation of DALYs (13). Third, the prevalence of disease was analyzed based on a scheme comprising cause, sequelae, and health state, which place emphasis on the disability that patients experienced (13). Fourth, the disability weight, which quantifies health losses for nonfatal outcomes of disease, was surveyed from the general public instead of from the healthcare professionals using different methods of measurement than those used in a previous study (14). Table 1 shows the comparison approaches by incidence-based and by prevalence-based for DALYs estimation.
Table 1
Comparison approaches by incidence-based and by prevalence-based for DALY estimation
Because the purpose of the GBD study was to estimate the burden of disease for the entire country, they gathered all of the available data and developed Bayesian meta-regression tools such as DisMod-MR and used many assumptions and modeling methods to provide estimation. In comparison, the burden of disease study in Korea measured YLD by estimating incidence cases using National Health Insurance Service (NHIS) data and YLL using the mortality data and life tables from the Korean National Statistical Office (789). Although the burden of disease study in Korea has evolved under Korea's unique healthcare system and with the existence of health insurance for all population with a single insurer, which could identify data on the medical services used by individuals within the country, limitations exist caused by the properties of the administrative data, such as the validity of the definition of incidence case and of disease coding (15).
DALYs calculated by a prevalence-based approach are consistent with a cross-sectional and population-based perspective (13). In terms of the healthcare policy, prevalence-based DALYs could provide appropriate data because all nonfatal health loss is captured by the prevalence-based approach, whereas only cases arising from a new diagnosis are captured by the incidence-based approach. For this reason, this study aimed to measure the DALYs of cancer in Korea in 2012 by a prevalence-based approach as used in the GBD 2010 study. In addition, National Cancer Registry data and statistics were used to provide valid estimations of YLD.
MATERIALS AND METHODS
This study used a model to determine the distribution of common sequelae based on National Cancer Registry data and the Annual Report on Cancer Statistics from 2008 to 2012, which provided statistics pertaining to cancer incidence, 5-year prevalence, 5-year survival rate, and survival rate by stage for each cancer. In comparison with the GBD 2010 study, this study modified the classification of some cancers, such as 'kidney and other urinary organs' that were divided into kidney cancer (C64) and other urinary organ cancer (C65-66) and added bone and connective tissue cancer (C40-41, 49). As a result, 30 categories of cancers were studied based on the disease classification from the GBD 2010 study and mapped using the International Classification of Disease (ICD) (16). The 30 cancers and matched ICD codes were as follows: mouth cancer (C00-08); cancer of other parts of the pharynx and oropharynx (C9-10, 12-13); nasopharyngeal cancer (C11); esophageal cancer (C15); stomach cancer (C16); colorectal cancer (C18-21); liver cancer (C22); gallbladder and biliary tract cancer (C23-24); pancreatic cancer (C25); laryngeal cancer (C32); trachea, bronchus, and lung cancers (C33-34); bone and connective tissue cancer (C40-41, 49); malignant melanoma of the skin (C43); non-melanoma skin cancer (C44); breast cancer (C50); cervical cancer (C53); uterine cancer (C54); ovarian cancer (C56); prostate cancer (C61); testicular cancer (C62); kidney cancer (C64); other urinary organ cancer (C65-66); bladder cancer (C67); brain and nervous system cancer (C70-72); thyroid cancer (C73); Hodgkin's disease (C81); non-Hodgkin's lymphoma (C82-85, 96); multiple myeloma (C88-90); leukemia (C91-95); and other neoplasms and unspecified cancer.
Early diagnosis of cancer using screening tests and improvement of treatment techniques have increased the number of cancer survivors who does not suffer by cancer anymore. To distinguish patients with cancer from cancer survivors or patients who are cancer-free, a prevalence case was defined as a cancer patient who survived 5 years after registration of their diagnosis and whose mortality rate was approximately the same as a person who is cancer-free (2). Prevalence cases were included for patients who had survived as of January 1, 2013, and who were registered from January 1, 2008, to December 31, 2012, according to the annual report from the National Cancer Registry Statistics. The cancer patients with multiple primary sites were calculated in duplicate.
YLL caused by each cancer were estimated by using the mortality data and statistics on the cause of death from the Korean National Statistical Office in 2012. The causes of death that should not have been identified or were misclassified, which are called garbage codes, were reassigned to a probable underlying cause of death according to a developed algorithm (17). The standard expected years of life lost (SEYLL) was adopted as a metric representing premature death. Life expectancy according to age and sex was referenced using the Korean standard life expectancy of life table in 2012 from the Korean National Statistical Office, which is different from the reference standard life table of the GBD 2010 study (13). Regarding the calculation of the YLL, age weighting and time discount were not applied as in the GBD 2010 study. The following formula was used for the calculation of YLL:


The GBD 2010 study adopted a prevalence-based approach as a new methodology where every burden of disease was captured whether it was caused by the incidence or by the prevalence of the disease. In contrast to a previous study that was incidence-based and in which the YLD of disease were calculated from the incidence to the end of the disease, the YLD were calculated for only 1 year using a prevalence-based method. Therefore, discounting for the time of future health loss in YLD was no longer needed. In addition, weighting by age was also omitted. The formula used for the calculation of YLD was simplified as follows:
To estimate the YLD of the disease, this study used a cause-sequelae-health states scheme, which was introduced by the GBD 2010 study. Sequelae are designed to capture the consequences of disease, and health states are designed to reflect common sequelae of the disease (12). Most cancers have four common sequelae that are categorized into diagnosis and primary therapy, controlled, metastatic, and terminal phases. Sequelae of all cancers are same with health states.
Because the National Cancer Registry registered patients' status by surveillance, epidemiology, and end results (SEER) stage, we converted the distribution by SEER stage to the sequelae distribution from the burden of disease study by following their modeling. Following the assumptions is the basis for the model of conversion. It was assumed for every registered patient that their cancer occurred on the first day of the year. For every patient who died, it was assumed that their death occurred in the middle of the year of their registered stage. The relative survival rate provided by the Annual Report of Cancer Statistics was used as an absolute survival rate. In cases where the relative survival rate was over 100%, a 100% survival rate was applied. If the distribution by SEER stage was not provided in 2008, the mean distribution from other years was applied. If the survival rate of the designated cancer was not provided, that of 'other neoplasms' was used as the cancer.
The SEER stage comprises the following categories: local, regional, distant, and unknown. The distributions of the registered cancer patients from 2008 to 2012 by SEER stage were confirmed, and the patients in the 'unknown' category were redistributed as a ratio of the other stages. In addition, the number of deaths in 2012 and the number of survivors by each stage and by each year were calculated using the relative survival rates from 1 to 5 years after diagnosis and survival rates by SEER stage that were provided by the Annual Report on Cancer Statistics. In regards to the survivors by each stage and by each year, patients who were diagnosed in 2012 (excluding the number of deaths) were designated as having the health state of 'diagnosis and primary treatment'. The number of patient deaths was designated as 'terminal'. Survivors who were diagnosed from 2008 to 2011 and categorized as 'distant' were designated as 'metastasis', and the remaining patients were designated as 'controlled'. The designations of 'metastasis' and 'controlled phase' for patients were modified based on the natural history of each cancer. To determine the distribution of cancer-specific sequelae such as stoma due to colorectal cancer, laryngectomy due to laryngeal cancer, urinary incontinence due to bladder cancer, and incontinence and impotence due to prostate cancer, we used the 2011 National Disability Survey and analyzed the 2012 National Patient Sample Data from the review of health insurance and assessment services.
Disability weight, another component used to calculate YLD, is used to capture the severity of the health loss as a consequence of disease (12) and has a value from 0 to 1. Therefore, every health state is distributed between two values. A value of 0 indicates a health state equivalent to full health, and a value of 1 indicates a health state equivalent to death (14). In accordance with the population-oriented perspective of the GBD 2010 study, the disability weight of a health state was also newly evaluated using a population-based survey with paired comparisons of the lay descriptions that described the two health states (18). We used the newly measured disability weights of the health states related to cancers. If a patient had two health states, for example, a controlled patient who has a stoma, the disability weight was calculated by considering the two states together. Because the value of the disability weight should be < 1, the following formula was used:
RESULTS
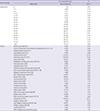
The total population of Korea in 2012 was 50,832,898 persons according to statistics compiled by the Ministry of the Interior. The total number of cancer cases was 734,065, which included 5-year cancer survivors, with an overall prevalence of 1.44%. The prevalence according to sex, age group, and cancer is shown in Table 2. The prevalence of female cases was higher than that of male cases (54% vs. 46%), and the highest prevalence was in patients aged 50–60 years (48.44%). Thyroid cancer was the most common cancer type (179,019 cases, 24.41% of all cancers), followed by stomach (112,419 cases, 15.33%), colorectal (104,348 cases, 14.23%), breast (69,657 cases, 9.50%), and lung (39,074 cases, 5.33%) cancer.
Table 2
Demographic characteristics of the prevalent cancer cases in 2012
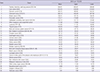
The burden of cancers in 2012 as measured by the prevalence-based approach was 3,470.79 DALYs per 100,000 persons (1,764,302 DALYs). Table 3 shows the burden of all cancers. Lung cancer produced the highest burden (594.61 DALYs per 100,000), followed by liver (523.43 DALYs per 100,000 persons), stomach (449.75 DALYs per 100,000 persons), colorectal (383.13 DALYs per 100,000 persons), and breast (190.31 DALYs per 100,000 persons) cancer.
Table 3
Rank of DALYs per 100,000 persons for each cancer type
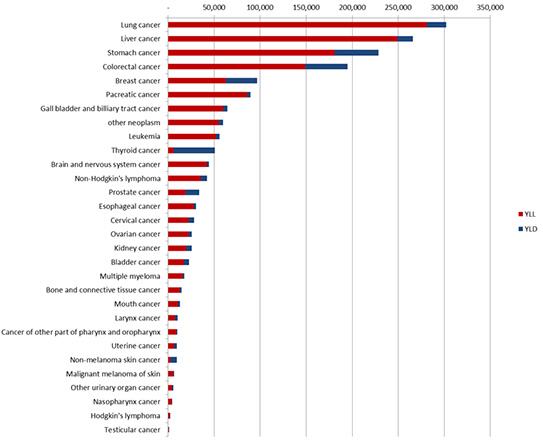
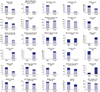
Despite the fact that the prevalence of cancer was higher in females compared with males, the health loss owing to cancer in males (3,759.12 DALYs per 100,000 male persons) was much higher than that for females (2,917.74 DALYs per 100,000 female persons). In males, lung cancer produced the highest burden (752.62 DALYs per 100,000 male persons), followed by liver (730.72 DALYs per 100,000 male persons), stomach (535.14 DALYs per 100,000 male persons), colorectal (418.47 DALYs per 100,000 male persons), and pancreatic (182.80 DALYs per 100,000 male persons) cancer. In females, the DALYs for breast cancer (386.7 DALYs per 100,000 female persons) was higher than that for lung (355.47 DALYs per 100,000 female persons), stomach (327.40 DALYs per 100,000 female persons), colorectal (323.02 DALYs per 100,000 female persons), or liver (246.76 DALYs per 100,000 female persons) cancer. Fig. 1 shows the differences in DALYs of each cancer according to sex.
Fig. 1
Disability-adjusted life years according to sex for each cancer type. The blue bars represent years of life lost; the red bars represent years lived with disability.
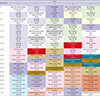
The health loss associated with most cancers increased sharply from the age of 30 and peaked around 70 years of age. The burden of breast cancer, thyroid cancer, and female-specific cancers, except for cervical cancer, shared a similar trend of peaking around 50 years of age. The burden of leukemia and brain and nervous system cancer was relatively higher for individuals of a younger age and increased more slowly compared with other cancers. Bone and connective tissue cancer showed 2 peaks, one for those aged 10–20 years and one for those aged 70 years. Cancers that showed a higher burden for each age group are listed in Table 4. Brain and nervous system cancer and leukemia were ranked first or second until the age of 20 years. For those aged 30–50 years, stomach, breast, and liver cancer produced a higher burden than other cancers, whereas for patients over 60 years of age, lung, liver, stomach, colorectal, and pancreatic cancer consistently produced a higher burden.
Table 4
The DALY rank for the top five cancer types and the DALYs per 100,000 persons according to age group
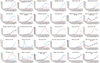
The total burden by age was low until the late 20s and then grew rapidly until 70 years of age followed by a slow decline. The loss of health for women was higher than that for men aged 25–49, owing to female-specific cancers and thyroid cancer. Over age 50, a rapid increase was seen in men compared with women until the age of 70, and over age 70, a significant decrease was seen for men compared with women. The change in the burden of each cancer with age and sex is shown in Fig. 2. The plots of health losses based on both age and sex of each cancer have various shapes in accordance with the characteristics of each cancer.
DISCUSSION
One of the problems with studies based on NHIS data is the lack of validity of coding, which means discrepancies between the real disease of a patient and the code claimed for the disease. Furthermore, the completeness of the data is also important to measure the burden of disease, because the NHIS data only the reveal actual use of the healthcare facilities. To overcome these problems, we used data from the National Cancer Registry, which was evaluated for quality of the registered data by cancer incidence in five continents and published by the International Agency for Research on Cancer (19). One of the Regional Cancer Registries composing the National Cancer Registry reported its completeness and validity as adequate from 2001 to 2010 (20).
The burden of all cancers was the highest burden of all disease types, which was reported by the 2012 Korean National Burden of Disease study (18), which agrees with the findings of the GBD study in 2010 and 2013 and previous Korean Burden of Disease studies (821). Health loss in men is higher than in women, whereas the prevalence of all cancers is higher in women than in men. This is because the differences in health loss are larger for liver (483.96 DALYs per 100,000 persons), lung (397.15 DALYs per 100,000 persons), and gastric (207.74 DALYs per 100,000) cancer. The proportion of YLL per DALY in both sexes implies that health loss from premature death from cancer is similar (0.79 in men vs. 0.80 in women).
Health loss due to thyroid cancer has characteristics that are distinguishable from that due to other cancers. Its prevalence was 24.39% in all cancer patients and 37.32% in female patients. Although there was a prominent prevalence of this cancer, health loss from thyroid cancer was relatively small (a 3% burden for all patients and a 5.6% burden for female patients) because its relative survival rate is not different from that of the cancer-free population and because most patients are diagnosed at an early stage. This may also be because of excessive screening and over-diagnosis (22). According to age, health loss for all cancers was lowest in patients 5–9 years of age, with an increased rate in those aged 30 years and above, which then decreased by 70 years of age because of the decrease in the number of people over age 70 and because case prevalence with age also declined for those over age 70.
The correlation coefficients between the ranks of the burden of cancer in this study and those of the GBD 2010 and 2013 studies were 0.982 and 0.984, respectively, not including 'bone and connective tissue cancer' (C40-41, 49) and 'other urinary tract cancers' (C55-56), which were newly added to this study, and 'other neoplasms'. The health losses from liver cancer and Hodgkin's lymphoma were higher, whereas those from breast and thyroid cancer were lower. Disability weights of this study were valued higher than that of GBD 2010 study, which made morbidity of disease emphasized relatively. Whereas, it is difficult to assess which factors made a difference on DALYs, because there are many differences in the estimated year, data resources, application of comorbidities, and the processes of estimation.
The newly adopted methodology from the burden of disease study was intended to capture all of non-fatal burden that occurred in a year and the calculated health loss distributed among the patients experiencing the consequences of the disease. The disabilities caused by the disease were emphasized, and the disability weights were also evaluated by the general population instead of by the healthcare professionals. In addition, the distributions of disease severity were estimated based on a population-based survey. Considering that the purpose of this study was to provide data to improve decision making in the various fields of healthcare, including decisions regarding the distribution of healthcare resources, and identifying the vulnerable in health, these new approaches could provide more suitable information than previous approaches.
To effectively use the methodology from the new burden of disease study requires accumulated descriptive epidemiologic literature, population-based survey data. However, the Korean Burden of Disease study, as a second mover of the study, has developed a unique methodology using the NHIS data, which is based on the traits of a healthcare system. In the process of the study, the methodology from the Korean Burden of Disease study revealed considerable problems such as lack of validity of coding diseases and completeness of the NHIS data, the garbage codes regarding the mortality data, and inaccuracy of estimations caused by incompleteness of the DisMod II analytic tool, which was used in a previous study. This study, as an extension of the Korean Burden of Disease study, was supposed to overcome the problems of data resources and the garbage codes for the mortality data and to apply the new methodology and results of the new disability weight study. These new methods are the strength and value of this study.
This study has some limitations. First, from the perspective of the GBD 2010 study, the estimation of the distributions of the severity of sequelae and health states should be based on a population-based survey, but the estimation of this study was based on modeling, which used the 5-year survival rate and survival rate by stage of each cancer. This caused a problem in terms of the consistency of the study given that the sequelae were based on assessments of healthcare professionals instead of being based on a survey conducted of the population who had experienced or were currently experiencing the consequences of the disease. Similar problems occurred with respect to the definition of the prevalence of each cancer. Furthermore, prevalence was defined to include all 5-year survivors, although it should be classified individually by cancer type since each cancer has a specific set of characteristics, progress, cure rate, and natural history. The second problem was the uncertainty that the estimated value necessarily developed. The National Cancer Registry data were used for YLD as a common resource. This has the advantage that the accuracy of the incidence data is guaranteed, but several uncertainties likely occurred in the process of estimation that was not reflected in the results. This is a challenge that must be resolved in the future.
For an in-depth analysis of the results, a precise estimation of health loss and serial measurements with homogeneous methodology are needed. The National Cancer Registry data do not provide the health state or stage after the registration of the diagnosis. If the cancer registry provided follow-up data, more precise estimations on the distributions of the sequelae could be possible. In addition, both the estimation of the severity distributions and the modeling strategy, including calculation of uncertainty, should be improved. Furthermore, an accurate measurement of the burden of other diseases without qualified data resources such as the National Cancer Registry is difficult. To resolve this problem, epidemiological data for diseases in our country would be needed. In conclusion, standardized methodology consistent with the characteristics of the healthcare environment of our country should be implemented, and the burden of disease should be measured regularly. The measurement of disease magnitude and prediction based on serial studies would provide significant information for decision making about healthcare policies.
 XML Download