

 PDF
PDF ePub
ePub Citation
 Print
Print


INTRODUCTION
In type 2 diabetes (T2DM), the pattern of adipose tissue distribution is significantly different from individuals without diabetes. Subjects with T2DM have more visceral adipose tissue and lesser subcutaneous adipose tissue than in healthy control subjects (1). Most studies have found that visceral adipose tissue is strongly related to insulin resistance in T2DM. Visceral fat accumulation has a significant negative impact on glycemic control through a decrease in peripheral insulin sensitivity and an enhancement of gluconeogenesis (2) and it is associated with the development of coronary heart disease (3).
T2DM seems to be closely related to the endocrine activity of adipose tissue. Adipose tissue is known to express and secrete a variety of adipokines, such as leptin, adiponectin, resistin, chemerin, retinol binding protein-4 (RBP-4), omentin and adipocyte fatty acid-binding protein (A-FABP). The release of adipokines by adipocytes can lead to a chronic inflammatory state that could play a central role in the development of insulin resistance and T2DM and is associated with the risk of cardiovascular disease (4). However, among these adipokines, the potential role of chemerin on T2DM and adiposity has not been fully examined and remains controversial.
Chemerin is a recently identified adipokine, which may participate in the regulation of adipogenesis as well as the regulation of inflammation. It may also play a role in insulin resistance, glucose and lipid metabolism (5). Previous studies have shown that chemerin is associated with several aspects of the metabolic syndrome (6). Gene expression of chemerin is significantly higher in visceral adipose tissue compared with subcutaneous adipose tissue in normal glucose tolerance animals (6). We previously showed a decrease in total body fat content and serum chemerin levels in overweight and obese patients with T2DM by an intensive lifestyle intervention (7). Recently, a positive correlation between visceral fat accumulation and serum chemerin levels in subjects without diabetes has been shown (8). However, the relationship between serum chemerin levels and body fat composition, in particular visceral abdominal obesity in people with T2DM has not been well studied and this relationship may be different from those without diabetes. Therefore, we investigated whether circulating chemerin levels might be associated with the degree of visceral obesity and other metabolic parameters in patients with T2DM.
MATERIALS AND METHODS
Study participants
In this study, 218 subjects with T2DM participated from the outpatient clinic of Inha University Hospital Diabetes and Endocrinology Center, Incheon, Korea. Diabetes was defined according to the American Diabetes Association diagnostic criteria (9). Eligible participants were aged 20–75 years with T2DM taking oral hypoglycemic agent, but not on insulin therapy. Participants who had a history of type 1 diabetes, active malignancy, infection and severe renal (serum creatinine level > 2 mg/dL) or hepatic disease (alanine aminotransferase or aspartate aminotransferase level greater than or equal to twofold higher than the upper normal limit), and patients taking an anti-obesity drug or a thiazolidinedione were excluded.
Anthropometric measurement
Body weight, height, waist circumference (WC), and blood pressure were measured. Body mass index (BMI) was calculated as weight (kg) divided by the square of height (m). WC was measured at the midpoint between the lower borders of the rib cage and the iliac crest. Blood pressure was measured after the subject has been in rest for at least 10 minutes in a sitting position.
Blood collection and biochemical analyses
Blood samples were collected after an overnight fast of at least 8 hours and stored at -80°C for subsequent assays. Serum glucose was measured by a hexokinase method and hemoglobin A1c (HbA1c) values were determined by high-performance liquid chromatography (HLC-723G7, Tosoh, Tokyo, Japan). Insulin was measured by a radioimmunoassay (TFB, Tokyo, Japan). Serum concentrations of triglyceride, total cholesterol, and high density lipoprotein cholesterol (HDL-C) were measured with an automatic chemical analyzer (Hitachi 7600-110, Tokyo, Japan). Fibrinogen concentrations were measured by a Diagnostica STA analyzer with fibrinogen reagent (STA-fibrinogen). Creatinine clearance (CCr) was calculated by the Cockcroft-Goult equation: [(140-age) × total body weight] / (serum creatinine (mg/dL) × 72) (× 0.85 for females). Chemerin (Mesdia, Seoul, Korea), lipocalin-2 (R&D systems, Minneapolis, MN, USA) and omentin-1 (Biovender Laboratory Medicine Inc, Modrice, Czech Republic) levels were measured by ELISA (enzyme-linked immunosorbent assay). The intra assay CVs were 11.3%, 9.4% and 4.6% respectively. High sensitivity C-reactive protein (hsCRP) was measured by a high-sensitivity latex enhanced, immunonephelometric assay method with a chemical analyzer (Hitachi 7600; Tokyo, Japan). The homeostasis model assessment of insulin resistance (HOMA-IR) was calculated by the following formula: (fasting insulin [IU/mL] × fasting glucose [mmol/L])/22.5.
Measurement of abdominal adipose tissue
Intra-abdominal adipose tissue area was measured by a computed tomography (CT) scan (Lightspeed VCT 64 Rows, GE Healthcare, Waukesha, WI, USA). A 5 mm CT slice scan was acquired at the L4-L5 level with the subject supine. The adipose tissue area was determined electronically by setting the attenuation values for a region of interest within a range of -250 to -50 HU (Hounsfield unit). The subcutaneous fat area was derived by subtracting the visceral fat area from the total abdominal fat area. The visceral to subcutaneous fat area ratio (V/S ratio) was also calculated.
Measurement of baPWV (brachial ankle pulse wave velocity)
baPWV was measured using model BP-203RPE II volume-plethysmographic apparatus (Colin, Komaki, Japan). Each participant rested in the supine position for 10 minutes, and was examined with electrocardiographic electrodes placed on both wrists and cuffs wrapped around both brachia and ankles. Transmission time was calculated as the time for the waveform to travel between the right arm and both ankles, and the transmission distance between the right brachium and ankle was automatically calculated based on the height of the participant. In the present study, the means of right and left baPWV were used for analysis.
Definition of diabetic retinopathy
Diabetic retinopathy was diagnosed by ophthalmologists according to the international classification of diabetic retinopathy as previously described (10).
Statistical analysis
All calculations and statistical analyses were performed using the SPSS for Windows software (version 19.0, Chicago, IL, USA). Data are expressed as the mean ± SD. Baseline comparisons and characteristics according to presence of diabetic retinopathy were assessed by t-test, Wilcoxon rank sum test and χ2 test as appropriate. Partial Spearman’s correlation analysis were used to examine the association between serum chemerin levels and other metabolic variables. To establish the independent factors associated with chemerin levels, multiple linear stepwise regression analysis was used. Chemerin was log transformed and independent variables in the multiple stepwise regression analysis were age, gender, BMI, fasting insulin, HOMA-IR, HDL cholesterol, triglyceride, serum creatinine, CCr, urine albumin/cr ratio, hsCRP, fibrinogen, visceral fat area, and V/S ratio. Results were considered statistically significant if the P value was < 0.05.
RESULTS
A total of 218 subjects (131 men and 87 women) participated in the study. Baseline clinical characteristics of this study subjects are summarized in Table 1. Mean age was 52.2 ± 7.5 years, BMI 25.3 ± 2.9 kg/m2, HbA1c 7.5% ± 1.3%, visceral abdominal fat area 111.7 ± 48.9 cm2, subcutaneous abdominal fat area 153.1 ± 66.6 cm2, and serum chemerin 80.3 ± 22.3 ng/mL. Serum chemerin level was positively correlated with BMI, WC, abdominal subcutaneous fat area, abdominal visceral fat area, V/S ratio, blood pressure, fasting insulin, HOMA-IR, triglyceride, urine albumin/creatinine ratio, hsCRP, fibrinogen, and negatively correlated with HDL-C. However, after adjusting for age, gender and BMI, serum chemerin level was positively correlated with fasting insulin (r = 0.25, P < 0.001), HOMA-IR (r = 0.19, P = 0.006), triglyceride (r = 0.36, P < 0.001), serum creatinine (r = 0.21, P = 0.002), urine albumin/creatinine ratio (r = 0.25, P < 0.001), hsCRP (r = 0.31, P < 0.001), fibrinogen (r = 0.32, P < 0.001), abdominal visceral fat area (r = 0.28, P < 0.001) and V/S ratio (r = 0.30, P < 0.001), and negatively correlated with HDL-C (r = -0.19, P = 0.005) and CCr (r = -0.18, P = 0.009) as shown in Table 2 and Fig. 1. We also examined the association of serum chemerin levels with omentin-1 and lipocalin-2, but no association was observed. Multiple linear stepwise regression analysis showed that abdominal visceral fat area (β = 0.001, P < 0.001), serum triglyceride (β = 0.001, P < 0.001), CCr (β = -0.003, P = 0.001), hsCRP (β = 0.157, P = 0.001), fibrinogen (β = 0.001, P < 0.001) and BMI (β = 0.02, P = 0.008) independently affected log transformed serum chemerin levels (Table 3). When clinical characteristics were compared according to the presence and absence of diabetic retinopathy, there were no significant differences in most parameters except for longer duration in those with diabetic retinopathy. Chemerin, omentin, lipocalin levels were not different according to the presence of diabetic retinopathy (Table 4).
Table 1
Clinical characteristics of the study subjects
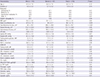
Data were expressed as the mean ± SD. The Wilcoxon rank sum test, t-test and χ2 test were used to compare the baseline characteristics as appropriate.
BMI, body mass index; BP, blood pressure; HOMA-IR, homeostasis model of ssessment - insulin resistance; HDL, high-density lipoprotein; LDL, low-density lipoprotein; hsCRP, high-sensitivity C-reactive protein; CCr, creatinine clearance; PWV, pulse wave velocity; V/S ratio, ratio of visceral to subcutaneous fat.
Table 2
The correlation between serum chemerin levels and abdominal fat area, metabolic variables
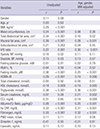
Correlation coefficients (r) and P values were calculated by the partial Spearman’s correlation model.
BMI, body mass index; BP, blood pressure; HOMA-IR, homeostasis model of assessment - insulin resistance; HDL, high-density lipoprotein; LDL, low-density lipoprotein; hsCRP, high-sensitivity C-reactive protein; CCr, creatinine clearance; PWV, pulse wave velocity; V/S ratio, ratio of visceral to subcutaneous fat.
Fig. 1
Relationship between fat areas and serum chemerin levels after adjusting age, sex and BMI. (A) Abdominal visceral fat. (B) Abdominal subcutaneous fat.
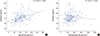
Table 3
Multiple linear stepwise regression analysis for factors associated with serum chemerin level*

Independent variables in the multiple stepwise regression analysis were age, gender, body mass index, fasting insulin, HOMA-IR, HDL cholesterol, triglyceride, serum creatinine, CCr, urine albumin/Cr ratio, hsCRP, fibrinogen, visceral fat area, and V/S ratio.
BMI, body mass index; hsCRP, high-sensitivity C-reactive protein; CCr, creatinine clearance; SE, standard error; R2, coefficient of determination.
*Serum chemerin level was log-transformed.
Table 4
Clinical and laboratory variables according to presence of diabetic retinopathy
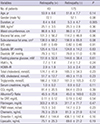
Data were expressed as the mean ± SD.
Wilcoxon rank sum test, t-test and χ2 test were used to calculate P values as appropriate.
BMI, body mass index; BP, blood pressure; HOMA-IR, homeostasis model of assessment - insulin resistance; HDL, high-density lipoprotein; LDL, low-density lipoprotein; hsCRP, high-sensitivity C-reactive protein; CCr, creatinine clearance; PWV, pulse wave velocity; V/S ratio, ratio of visceral to subcutaneous fat.
DISCUSSION
We report for the first time that serum chemerin levels are positively associated with abdominal visceral fat area using CT and fibrinogen was a definite factor associated with serum chemerin levels in patients with T2DM. In a previous study, chemerin level was significantly associated with visceral fat accumulation in subjects without diabetes (8), and other studies reported that chemerin gene expression was significantly higher in visceral adipose tissue compared with subcutaneous adipose tissue in animals (5). However, the relationship between serum chemerin levels and abdominal fat area, especially subcutaneous and visceral fat in T2DM has not been well studied. In our previous study, a 12-week intensive lifestyle intervention significantly decreased total body fat content and serum chemerin level (7). In this study, baseline chemerin level was not associated with visceral abdominal fat and subcutaneous visceral fat. However, the number of participants was too small (n = 35) to explain the association between serum chemerin level and abdominal fat composition, and the participants were limited to only overweight and obese patients with T2DM. Since, there was a possibility that serum chemerin concentration might be associated with abdominal fat area, especially visceral fat compartment in T2DM, we investigated this in a larger number of patients with T2DM and those with a broader range of BMI.
Obesity, and in particular abdominal obesity, plays a major role in the pathogenesis of several metabolic and cardiovascular problems including T2DM, hypertension, atherosclerosis and coronary artery disease (11). Especially, excess visceral adiposity is associated with impaired glucose tolerance, insulin resistance, and atherogenic dyslipidemia (12). In addition, visceral fat has been associated with coronary stenosis, independent of traditional cardiovascular risk factors, in an asymptomatic population without a history of coronary artery disease (13). Even within the normal range of BMI, accumulation of visceral fat remains to be an independent cardiovascular risk factor (14). Visceral fat accumulation may also induce secretion of adipocytokines. Oversecretion of pro-inflammatory adipocytokines, such as PAI-1 or tumor necrosis factor-α (TNF-α) and hyposecretion of defensive adipocytokines, such as adiponectin, might be major mechanisms of insulin resistance and T2DM (15). In recent years, several adipocytokines were newly discovered such as retinol binding protein-4 (RBP-4), vaspin, omentin, chemerin and adipocyte fatty acid-binding protein (A-FABP). Among these adipocytokines, the effect of chemerin on the adipose tissue and glucose metabolism remains controversial.
Chemerin is an adipokine which was recently found that has a role in adaptive and innate immunity, and regulates adipocyte differentiation and metabolism by binding to and activating the seven transmembrane-spanning G protein-coupled receptor (GPCR), chemokine-like receptor 1 (CMKLR1) (5). Serum chemerin levels are increased in obesity (5), and the expression is especially higher in visceral adipose tissue compared with subcutaneous adipose tissue in normal glucose tolerance animals (6). In addition, visceral fat mass quantified by magnetic resonance imaging was significantly associated with genetic variations of RARRES2 which encodes chemerin in subjects with an increased risk for T2DM (16). WC is an easily checkable method, however an imprecise measurement of abdominal adiposity because it is the sum of both subcutaneous and visceral adipose tissue compartments. Our results also found that WC was associated with chemerin level, but after adjusting for age, sex and BMI, the correlation of systemic chemerin level with WC was not significant. Therefore, assessment of visceral adipose tissue area requires imaging with radiographic techniques such as CT or magnetic resonance imaging. In this respect, measurement of chemerin levels which is positively associated with visceral obesity, may conveniently provide a more precise information about metabolic risk compared to BMI, WC or radiographic imaging such as CT.
Patients with diabetes have increased prevalence of hypertrigyceridemia. In diabetes, the impaired ability of insulin to inhibit the release of free fatty-acid leads to hypertriglyceridemia (17). There is a controversy whether hypertriglyceridemia is directly related with cardiovascular disease, however, some studies demonstrate that hypertriglyceridemia is associated with cardiovascular disease, especially in patients with insulin resistance or in patient accompanying other type of dyslipidemias (e.g. increased small dense LDL cholesterol and low HDL cholesterol) (17). Recent studies have shown that serum chemerin levels are associated with metabolic risk factors including serum triglyceride (181920). Takahashi et al. (21) showed that chemerin levels were positively correlated with BMI, total cholesterol, triglyceride levels and negatively correlated with HDL-C in T2DM. Another study showed that chemerin levels were significantly associated with BMI, triglyceride, creatinine, CCr after adjusting for age and gender in patients with T2DM (22). Consistent with previous studies, we found that multiple factors of metabolic syndrome were significantly associated with serum chemerin, especially serum triglyceride was independently affecting serum chemerin levels.
In recent years, it has become clear that obesity is commonly associated with chronic low-grade systemic inflammation and cardiovascular disease (2324). Furthermore, visceral obesity rather than subcutaneous obesity is associated with elevated concentrations of inflammatory cytokines along with the increase in risk of cardiovascular disease and diabetes. Chemerin can contribute to initiation and progression of inflammation in the obese state by stimulating macrophage adhesion to extracellular matrix proteins and by promoting chemotaxis (25). Chemerin synthesis is induced by the overexpression of proinflammatory cytokines such as TNF-α (26) in visceral adipose tissue, and chemerin participates in the recruitment and local activation of inflammatory cells in adipose tissue (27). In addition, Weigert et al. (28) also identified that chemerin level was significantly higher in patients with elevated CRP in T2DM. Our study also identified that higher serum chemerin level was independently associated with higher hsCRP in T2DM. Furthermore, high chemerin levels were associated with increasing risk of coronary artery disease and severity of atherosclerosis independently of other established cardiovascular risk factors (29). In this respect, like other inflammatory factors such as hsCRP, TNF-α and IL-1 which promote atherogenesis, chemerin may be one of several factors that contribute to cardiovascular disease in T2DM. However, long-term prospective studies of cardiovascular outcome associated with serum chemerin level should be investigated.
Plasma fibrinogen is an acute-phase protein, and is likely to increase with inflammation and has been identified as an independent risk factor for cardiovascular disease and it is associated with traditional cardiovascular risk factors (30). Plasma fibrinogen may also be increased in T2DM and be associated with a number of components of the metabolic syndrome (31). These evidences indicate that hyperfibrinogenemia in T2DM could contribute to the excess cardiovascular morbidity and mortality. In the present study, for the first time, we identified that fibrinogen was a definite factor associated with serum chemerin levels in T2DM. In accordance with the above findings, we suggest that serum chemerin levels in T2DM can serve as a predictor of inflammation and cardiovascular disease, like hsCRP and fibrinogen.
Recently, serum chemerin levels were reported to be significantly higher in patients on chronic hemodialysis as compared with healthy subjects, suggesting that determinants of renal function are independently related to serum chemerin levels (32). In addition, both CCr and serum creatinine were significantly associated with serum chemerin levels (22). In accordance with these reports, our data showed that serum chemerin concentrations were significantly correlated with serum creatinine and CCr after adjusting age, sex, and BMI. Moreover, CCr was independently associated with serum chemerin levels. These findings indicate that elevated serum chemerin levels could be a marker of low CCr associated with diabetic nephropathy.
This study has some limitations. First, the study population were Korean subjects with T2DM, therefore the relationship between circulating chemerin level and visceral adipose tissue should be studied further in other populations. Second, we only measured the total form of chemerin. Chemerin is secreted in an inactive form as prochemerin with significantly lower biological activity, and undergoes proteolytic cleavage on the C-terminal by proteases such as neutrophil elastase, cathepsin G and plasmin to become a short form with varying biological activity (6). Adipocytes express the genes that encode for protease that activate chemerin, such as neutrophil elastase, mast cell tryptase, angiotensin converting enzyme, tPA, uPA, and cathepsin K (33). C-terminal-truncated chemerin variants display either more chemotactic or anti-inflammatory effects, which is determined by the cleavage at distinct sites by different classes of proteases (34). Therefore, additional studies are necessary to evaluate the change in chemerin subtypes and the significance of these changes
In summary, abdominal visceral fat area, BMI, serum triglyceride, hsCRP, fibrinogen, and CCr were independent factors affecting serum chemerin levels in T2DM. Our data suggest that serum chemerin which is associated with many metabolic risk factors can be a predictor of the degree of visceral adiposity and may play an important role in inflammation, diabetic nephropathy, and risk of cardiovascular disease in T2DM. Furthermore, the metabolic complications of obesity in T2DM are not fully predictable based on simple anthropometric measurements. Therefore, clinical utility of chemerin as a biomarker of visceral obesity in T2DM could be useful in early detection of these pathological states, and aid in finding candidates for more intensive lifestyle modification and therapy to prevent their unfavorable consequences.
 XML Download