

 PDF
PDF ePub
ePub Citation
 Print
Print


INTRODUCTION
Predicting cancer mortality is important to estimate the needs of cancer-related services and to prevent cancer. The prediction of cancer mortality is a criterion for long-term expenditure plans. Moller et al. (1) predicted the cancer incidence by cancer site in Nordic countries from 1998 to 2022 based on past trends from 1958 to 1997. However, improved methods to predict cancer incidence have been developed, including the Nordpred software (2). As a result, many studies have been conducted to predict cancer incidence and mortality using Nordpred in the UK (345), Canada (6), Switzerland (7) and the USA (8). While short-term (the current year) estimations of cancer incidence and mortality were conducted in 2015 (9), long-term future projections of cancer mortality have not been conducted in Korea. Because there is rapid aging of the population in Korea, future projections of cancer mortality are needed to estimate the future burden of cancer and to set up plans for allocating resources.
The objectives of the current study were as follows. First, cancer mortality was estimated using the Nordpred for each cancer site by sex. Second, the contribution of the overall change in the number of cancer deaths was resolved into the three components: risk, age structure and population size.
MATERIALS AND METHODS
Data
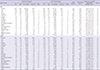
Cancer death data and population projection data were obtained from the Korean National Statistics Office. The cancer death data consisted of all invasive cancers from 1983 to 2012 in Korea (men: 1,007,187 deaths, women: 580,512 deaths). All invasive cancers were categorized into 20 cancer sites (lung, liver, stomach, colorectum, pancreas, prostate, breast, cervix, ovary, uterus, esophagus, leukemia, non-Hodgkin's lymphoma, bladder, oral cavity and pharynx, brain and central nervous system (CNS), multiple myeloma, larynx and malignant melanoma) according to the ICD-10 codes (International Classification of Diseases version 10) of the World Health Organization (shown in Appendix 1). The population projection data consisted of the observed (1983-2010) and projected (2011-2032) population by sex in Korea. The future population projections were conducted by the Korean National Statistics Office using the cohort components method. The cancer death data were aggregated into six five-year periods (1983-1987, 1988-1992, 1993-1997, 1998-2002, 2003-2007, and 2008-2012) by cancer site and sex. The population data were aggregated into ten five-year periods (1983-1987, 1988-1992, 1993-1997, 1998-2002, 2003-2007, 2008-2012, 2013-2017, 2018-2022, 2023-2027, and 2028-2032) by sex. The two datasets were aggregated into seventeen five-year age groups (0-4, 5-9, 10-14, 15-19, 20-24, 25-29, 30-34, 35-39, 40-44, 45-49, 50-54, 55-59, 60-64, 65-69, 70-74, 75-79, and more than 80).
Modeling
Specially programmed software, Nordpred, was used to estimate cancer mortality. The Nordpred is R-based software developed by the cancer registry of Norway. Basically, an APC (age-period-cohort) model with a Poisson regression was written as follows: Rap
= exp (Aa
+ D ∙ p + Pp
+ Cc
). Rap
is defined as the mortality rate in the age group (a) and in the period (p). D is defined as the common drift parameter. Aa
is defined as the age component of the age group (a). Pp
is defined as the non-linear period component of the period (p). Cc
is defined as the non-linear cohort component of the cohort (c). For better predictions, Moller et al. recommended using the power link function instead of the log link function to level off the exponential growth (2). The drift parameters of the first, second, third and fourth 5-year periods were reduced by 0, 25%, 50%, and 75%, respectively, as follows: Rap
= (Aa
+ D ∙ p + Pp
+ Cc
)5. If the observed rates show significant sharp curvatures, the projection based on the recent periods will be more accurate than the entire periods, as follows: Rap
= (Aa
+ D ∙ p + S ∙ Pp
+ Cc
)5. If S is significant, the recent trend (10 years) is used to project the drift component; if not, an average trend from all of the observation periods is used.
The lowest age limits of the model were determined by considering the number of deaths in each cell (shown in Appendix 1). Below the age limits, future rates were projected using the average rates in the last 10 years. The number of periods needed to fit the model was determined by considering the goodness of fit test (selected among the 4, 5 and 6 periods). The age-standardized rates were calculated using the Segi world standard population with little modification, combining the 80-84 and 85+ years groups into an 80+ years group (1011). The deaths of men due to breast cancer were too small to conduct the Nordpred estimation and were therefore excluded.
To determine the effect of risk and population, the overall change in the number of deaths (∆
tot
) was decomposed into the following three components: the difference between the predicted and observed rates (∆
risk
), the difference between the predicted and observed age structures (∆
age
)and the difference between the predicted and observed population size (∆
size
); ∆
tot
= ∆
risk
+ ∆
age
+ ∆
size
. The methods are referenced in Moller et al. (1).
RESULTS
Table 1 shows the observed and projected numbers of deaths by cancer site and the overall change due to risk, age structure and population size. For all cancer deaths in men, the deaths are expected to increase by 35.5% from 2008-2012 to 2028-2032 (226,799 to 307,413 deaths). This overall change is due to the change in risk (-84.3%) and the change in the population structure (119.8%). The positive change in the population overwhelms the negative change in risk. Specifically, the changes in the population are due to the changes in the age structure (115.4%) and changes in the population size (4.4%). The most significant effect on the overall change in the number of deaths is the change in the age structure. The APC (average percent change) by year over 20 years is estimated to be 1.5% from 2008-2012 to 2028-2032.
For all cancer deaths in women, the deaths are expected to increase by 32.3% from 2008-2012 to 2028-2032 (134,533 to 178,033 deaths). This overall change is due to the change in risk (-60.4%) and the change in population structure (92.7%). The change in population is due to the change in age structure (86.3%) and the change in population size (6.4%). The most significant effect on the overall change in the number of deaths is also the change in the age structure. The estimated APC for each year over the next 20 years is 1.4% from 2008-2012 to 2028-2032.
Several cancer deaths are estimated to increase from 2008-2012 to 2028-2032 (lung, liver and gallbladder, colon and rectum, pancreas and leukemia in both sexes; prostate cancer in men; and breast and ovarian cancer in women). However, several cancer deaths are forecasted to decrease from 2008-2012 to 2028-2032 (stomach, esophagus and larynx in both sexes; and cervical cancer in women). For both sexes, lung cancer was the most prevalent type of cancer-related death in 2008-2012, and this trend will continue to 2028-2032.
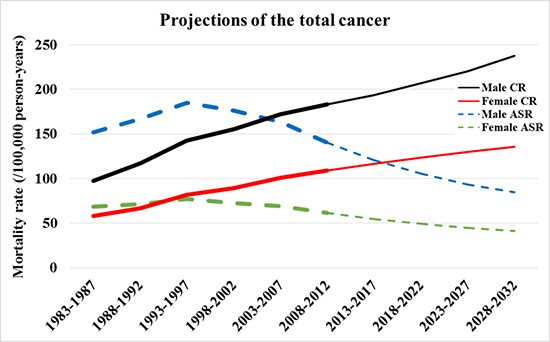
Fig. 1 presents the trends of age-standardized mortality rates and the crude mortality rates in the observed (1983-2012) and future periods (2013-2032) by each cancer site and sex. For all cancer deaths, the crude rates are forecasted to increase from 2008-2012 to 2028-2032 (men: 29.8%; 183 to 237, women: 24.4%; 109 to 136 per 100,000 person-years). However, the age-standardized rates are forecasted to decrease from 2008-2012 to 2028-2032 (men: -39.8%; 140 to 85, women: -33.1%; 61 to 41).
Fig. 1
The crude rates and age-standardized rates in the observed (1983-2012) and predicted periods (2013-2032) by cancer site.
CR, the crude rates (per 100,000 person-years); ASR, the age-standardized rates using the world standard population (per 100,000 person-years).
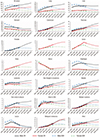
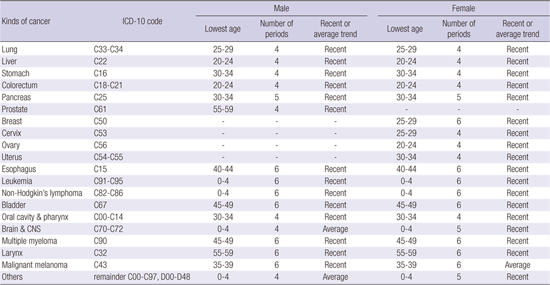
Fig. 2 presents the age-specific mortality rates of all cancer deaths in the observed (1983-2012) and future periods (2013-2032). Furthermore, the older age groups showed a higher mortality rate than younger age groups. Each age-specific rate increased for some initial period and then eventually decreased from 2028-2032, and the younger age groups decreased in earlier periods than the older age groups.
Fig. 2
The age-specific rates of all cancer deaths in the observed (1983-2012) and predicted periods (2013-2032).
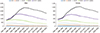
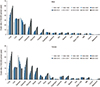
Fig. 3 presents the crude rate trends according to the top 15 types of cancer leading to death in men and the top 18 types of cancer leading to death in women from 1983-1987 to 2028-2032. The major causes of cancer deaths in 2028-2032 are forecasted to include cancer of the lung, liver, stomach, colorectum and pancreas in both sexes, prostate cancer in men, and breast and ovarian cancer in women.
DISCUSSION
The main conclusions of our study are as follows. First, the age-standardized rates of all cancer deaths are estimated to decline, but the numbers of cancer deaths are estimated to rise, from 2008-2012 to 2028-2032 in both sexes. Second, several cancer deaths are expected to increase (lung, liver and gallbladder, colon and rectum, pancreas, and leukemia in both sexes, prostate cancer in men and breast and ovarian cancer in women), whereas others are expected to decrease (stomach, esophagus, and larynx in both sexes and cervical cancer in women). Third, population aging is responsible for the largest contribution to the overall change in the number of cancer deaths.
Our study shows that crude mortality rates and cancer deaths are predicted to increase, while age-standardized mortality rates adjusted to the world population for all cancers are estimated to decline, from 2008 to 2032 (crude mortality rate: males 29.8%, females 24.4%; cancer deaths: males 35.5%, females 32.3%; ASR: males –39.8%, females –33.1%). This finding is due to the difference in the age structure of the Korean population and the world population. The proportion over 65 years of age in Korea will increase in 2028-2032 compared to the previous periods 1983-1987 and 2008-2012 (male: 3.2%, 9.0% and 21.9% in 1983-1987, 2008-2012 and 2028-2032, respectively, female: 5.4%, 13.1% and 26.7%, respectively, Appendix 2). Furthermore, the proportion of the population aged 65 and over in Korea is higher than the world standard population (7.0%) between 2008 and 2032. Our result is similar to that of Olsen et al. (4) in the UK, who reported that the predicted age-standardized rates adjusted to the European population for all cancer deaths are expected to decrease in both sexes from 2003 to 2023 (men -17%, women -16%), while the numbers of cancer deaths are estimated to increase (men: 30%, women: 12%). Our study suggests that population aging will increase cancer deaths in the near future, which implicates the importance of introducing a nationwide prevention strategy.
Our study also shows that deaths due to cancers of the lung, liver and gallbladder, colon and rectum, pancreas, and leukemia in both sexes; prostate cancer in males; and breast and ovarian cancer in females are projected to increase, whereas cancers of the stomach, esophagus and larynx in both sexes and cervical cancer in females are expected to decrease. This result is very similar to that of Olsen et al. (4) in the UK, except in relation to cancers of the esophagus (increasing trend) and breast (decreasing trend).
We deduce the causes or reasons for the increasing numbers of deaths in specific cancer sites such as the lung, colorectal, pancreas, prostate, leukemia, breast, and ovary in Korea.
Lung cancer remains the number one cause of cancer deaths in Korea and will increase for both sexes (36.8% for males, 55.8% for females), which means that Korean people will suffer from lung cancer through 2032, while a steady or slight increase (3% for males, 12% for females) will occur in the UK (4). The main causes of increasing lung cancer deaths in Korea might be the high prevalence of smoking. As a main risk factor for lung cancer, the higher prevalence of smoking is responsible for the increasing numbers of cancer deaths in Korea. Korea has the second highest smoking prevalence in the world, and the smoking prevalence over the next 20 years among men in Korea (44.9%) ranks first of 34 countries (12). The population-attributable fraction (PAF) of the smoking for all cancer deaths in males is 32.9%, and the PAF for lung cancer in males is 71.5% (13).
Population aging reinforces the effect of risk factors such as consumption of a Westernized diet (higher intakes of red and processed meat) and life style factors such as smoking and alcohol drinking for colorectal cancer (14). In addition, smoking, chronic pancreatitis, and genetic factors represent risk factors for pancreatic cancer in Korea (15).
Breast cancer is also related to the aging of population (16). The proportion of women aged 65 and older who died due to breast cancer was 13.48% in 1983, while this rate increased to 28.51% in 2013 and 29.37% in 2014 (17). As the risk factors for breast cancer are determined primarily by the total cumulative exposure of breast tissue to estrogen (18), social changes such as declining marriage and fertility rates, increasing divorce rates, and the growth of single households contribute to increasing rates of breast cancer in Korea. In Korea, the average age at first marriage has increased (men: 32.4, women 29.8 years old in 2014), and the national fertility rate (1.26 babies in 2015) is the fourth lowest among 169 countries. These risk factors are responsible for the increasing trend in the number of breast cancer deaths. In particular, as Korea has stepped into the era of an aging population, the conditions of increasing cumulative estrogen exposure over the lifetime will be related to the increasing occurrence of breast cancer.
In Korea, liver cancer was the second most common cancer for males and the fourth most common cancer for females in 2008-2012. Liver cancer deaths are predicted to remain steady or slightly increase from 2008 to 2032 (men: 2.4%, 3rd in 2028-2032, women: 2.7%, 4th in 2028-2032). Most primary liver cancers constitute hepatocellular carcinoma (HCC) in Korea (19). The hepatitis B virus (HBV), which was classified as a group 1 exposure by the IARC (20), is the most important risk factor for HCC and accounts for approximately 70% of such cancers. HBV is followed by hepatitis C virus (HCV) and alcohol as the major risk factors for liver cancer in Korea (19). We think that the relatively constant projections of liver cancer deaths are influenced by nationwide screening as well as the HBV vaccine. For example, the prevalence of the HBV surface antigen (HBsAg) has decreased from 8-10% in the 1980s to 3.8% in 2007 (21). As a whole, nationwide screening for HBsAg and anti-HCV antibodies, vaccination for HBV, and routine screening for HBsAg and anti-HCV antibodies in all blood products have led to a reduction in the incidence of HCC and are the causes of the constant projections for liver cancer deaths in the future in Korea (19). On the other hand, our study shows that the rates of stomach cancer, esophageal cancer and cervical cancer are expected to decrease in Korea.
Decreasing stomach cancer deaths are remarkable, although this finding is consistent with results from previous studies in the UK (4). The reduction in the number of stomach cancer deaths is a result of the nationwide gastric cancer screening (endoscopy) program supported by the NHI (National Health Insurance) (2223), the decreasing seroprevalence rate of Helicobacter pylori (66.9% in 1998 to 59.6% in 2005) (24), the consumption of less salt and the increasing 5-year survival rate after gastrectomy due to developing medical technologies (2526). For example, the detection rate of early gastric cancer by cancer screening during health examination was 75%-80% between 2001 and 2007 (27). Patients screened by endoscopy were 2.1 times more likely to be diagnosed with localized gastric cancer compared to never-screened patients in Korea (22). The decreasing trend in the number of esophageal cancer deaths is correlated to the decreasing stomach cancer rates as the detection of esophagus cancer increases as a result of upper endoscopy screening during routine health check-ups, which enables early treatment (28).
Cervical cancer deaths have been significantly declining (2930), which has also been described in the UK (4). Because human papilloma virus type 16 (HPV-16) has been classified as a group 1 exposure by the IARC and is associated with carcinoma of the cervix, vulva and vagina (20), a nationwide screening (Pap smear) test to detect cervical cancer has contributed to decreasing cervical cancer mortality rates in Korea since 2001 (31), which is similar to many countries where “organized screening tests have been introduced over the last three or four decades” (30). In addition, below 12 year-old females can get two types of the HPV vaccines for free from 2016 in the NIP (National Immunization Program) implemented by the K-CDC (Korea Centers for Disease Control & Prevention). Therefore, we are expecting that the incidence as well as mortality attributed to cervical cancer will decrease rapidly in the near future.
Our study found that the projection for an increasing number of cancer deaths was mainly due to the aging of the Korean population. The increasing rate of cancers urgently suggests that a worldwide strategy for primary prevention and early detection needs to be established as a national health policy to prevent increasing cancer mortality rates. In addition, the national cancer screening program for the people over 40 should be properly implemented and expanded to detect the gastric, liver, breast, colorectal and cervical cancer. The NHS (National Health Service) should be considered of the balance between the medical expenditures and the better medical technologies for the cancer treatment.
Our study has certain limitations. For instance, the Nordpred predicts cancer mortality by assuming that the trends of the future rates will be reflected by the past trends. The reliability of the cancer predictions using the Nordpred was confirmed in the UK by comparing empirical results (2). However, in Korea, the reliability of this cancer prediction has not yet been confirmed. Uncertain future circumstances that may influence cancer mortality cannot be considered in the Nordpred model. Therefore, the results of our study should be compared to the actual cancer mortality rates in the future, and the estimation model should be modified to predict cancer mortality more precisely.
Future studies aiming to predict the incidence of cancer should compare these results to the cancer mortality rates. Additionally, the prediction of other diseases, such as cardiovascular disease, should be conducted using the Nordpred software.
 XML Download