

 PDF
PDF ePub
ePub Citation
 Print
Print


INTRODUCTION
Breast density is defined as the proportion of fibroglandular tissue in the total breast volume. It can be influenced by age, menopausal status, and ethnicity (123). The proportion of dense breasts tends to decrease as patients’ age and go through menopause (123).
Dense breasts are well known as a risk factor of breast cancer, and it can also negatively influence the accuracy of breast cancer screening with mammography (24). Mammography is the primary imaging modality for breast cancer screening worldwide. Despite being acknowledged as a first-line tool, multiple studies have reported that its sensitivity may be as low as 30% to 48% for dense breasts (456). The reason is that the dense breast tissue can obscure breast cancers on mammography, and this can give false-negative results. This is an important issue for women who have dense breast tissue because a negative mammography does not confirm that the patient does not have breast cancer. This means that women at high risk for breast cancer may need further work-up for breast cancer screening, such as breast ultrasonography or breast magnetic resonance imaging. Recently, several states in the United States have enacted a law requiring radiologists to notify a patient about her breast density, and medical insurance covers more screening examinations for high-risk women; moreover, the number of states with this policy is increasing (7). Therefore, it is important to recognize the exact current prevalence of dense breasts and breast density alterations by age group in our country.
Mammographic density can be measured by qualitative visual assessment or quantitative computer-aided methods (18). Mammographic breast glandular tissue is routinely visually assessed and categorized by four different patterns: type A, entirely fatty; type B, scattered fibroglandular; type C, heterogeneous dense; and type D, extremely dense, according to the guidelines of the Breast Imaging Reporting and Data System (BI-RADS) (9). However, this visual assessment is subjective so it shows varying degrees of inter-observer agreement (10). In comparison, the quantitative computer-aided measurement is objective and can be roughly categorized into area-based measurement and volumetric measurement methods (11). The fully automated volumetric assessment (FAVA) system has recently been developed, and several reports have shown a relatively good correlation between FAVA and the BI-RADS visual density category (81112). Applying the results of FAVA to breast density would be more helpful for personalizing breast cancer screening and developing appropriate national breast cancer screening strategies because breast density is an important risk factor (24).
There was a previous study which compared breast density on mammograms between Korean and Western women according to age (13). However, it was an only report and there has been no study regarding the objective breast density by age using FAVA, which could be used for standard reference.
Therefore, the purpose of this study was to present the mean breast density of Korean women according to age groups using FAVA and to compare it with that of women in other countries.
MATERIALS AND METHODS
Patients
Between August 20 and October 7, 2013, a total of 6,751 women who underwent screening mammography with full-field digital mammography (FFDM) at our institution for private and national breast cancer screening programs were enrolled. This included some women younger than 40 years because they want to perform screening FFDM, although the Korean national breast cancer screening program targeted at women older than 40 years.
The exclusion criteria in this study were as follows: 1) women were younger than 30 years (n = 70); 2) they had a history of breast surgery (n = 68); and 3) they showed the BI-RADS category results of 0 (incomplete), 3 (probably benign), 4 (suspicious abnormality), or 5 (highly suggestive of malignancy) (n = 646).
Finally, a total of 5,967 women who were over 30 years of age and showed BI-RADS category 1 (negative) or BI-RADS category 2 (benign) results were included.
Mammography and mammographic density analysis with FAVA
All FFDMs were performed with standard craniocaudal and mediolateral oblique views of both breasts on FFDM units (Senographe DS, GE Healthcare, Milwaukee, WI, USA; Brestige, MEDI-FUTURE, Seongnam, Korea).
The volume of mammographic density was calculated using Volpara Imaging Software (version 1.5.5, Mātakina Technology, Wellington, New Zealand), which is a FDA-approved program for FFDM images. This software calculates the breast density by computing the x-ray attenuation at each pixel on FFDM by comparing the pixel value at the reference point to the pixel value at each pixel. By adding up all the values in the density map over the image, it can calculate the fibroglandular tissue volume (FTV) in cubic centimeters, breast tissue volume (BTV) in cubic centimeters, and therefore the percentage of the breast that consists of fibroglandular tissue – the volumetric breast density (VBD).
We divided the VBD into four grades as follows: 0%–4.7%, Volpara density grade (VDG) 1; 4.8%–7.9%, VDG 2; 8.0%–14.9%, VDG 3; and 15.0% or higher, VDG 4. Patients with VDG 1 and 2 were considered to have fatty breasts, while those with VDG 3 and 4 were considered to have dense breasts (8).
Data and statistical analysis
All statistical analyses were performed using PASW Statistics 18.0 (IBM, Armonk, NY, USA). The Kolmogorov-Smirnov normality test was used to assess the distribution of data. Categorical data were summarized as frequencies and percentages. We calculated the average values of FTV, BTV, and VBD of both breasts for each patient. The Pearson correlation was used to evaluate the relationships among the mean values of FTV, BTV, and VBD. Statistical significance was established at a two-sided P value < 0.05. Moreover, we calculated the mean, median, and interquartile ranges of age, FTV, BTV, and VBD for all subjects.
We divided the enrolled subjects into six groups according to age as follows: 30–39 years of age, 40–49 years, 50–59 years, 60–69 years, 70–79 years, and 80–89 years. We evaluated the proportion and the mean FTV, BTV, and VBD values of fatty and dense breasts in each age group. Recently, the Korea Centers for Disease Control and Prevention reported that the mean age of menopause in Korean women is 49.4 ± 5.1 years (3). Taking this into consideration, we also subdivided all subjects into groups younger or older than 50 years (14), and evaluated the mean, median, interquartile ranges of VBD, and distribution of the four VDGs in each group, using the chi-square test to assess statistical significance.
RESULTS
There were 4,611 patients from private screening programs and 1,356 patients from the national breast cancer screening program at our institution who were included in our study. The distribution of each age group was as follows: 30–39 years (n = 1,484, 24.9%), 40–49 years, (n = 2,706, 45.3%), 50–59 years (n = 1,138, 19.1%), 60–69 years (n = 489, 8.2%), 70–79 years, (n = 138, 2.3%), and 80–89 years (n = 12, 0.2%).
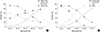
The data of FTV, BTV, and VBD met the hypothesis of normality. The mean and median values of FTV, BTV, and VBD are presented in Table 1. The mean age and VBD were 46.2 ± 9.7 years (range, 30–89) and 15.8% ± 7.3%, respectively. There was a significant correlation between the mean values of VBD and FTV (P < 0.001, r = 0.459), between VBD and BTV (P < 0.001, r = -0.454), and between FTV and BTV (P < 0.001, r = 0.459) (Fig. 1). The mean values of FTV, BTV, and VBD, and the proportion of dense and fatty breasts in each age group are summarized in Fig. 2 and Table 2, respectively.
Table 1
Mean, median values, and interquartile ranges (IQR) of age, FTV, BTV, and VBD in the total 5,967 subjects

| Values | Age, yr | FTV, cm3 | BTV, cm3 | VBD, % |
|---|---|---|---|---|
| Mean ± SD | 46.2 ± 9.7 | 53.7 ± 30.8 | 383.8 ± 205.2 | 15.8 ± 7.3 |
| Median | 44 | 46.9 | 344.3 | 15.3 |
| IQR | 40-51 | 31.6-68.5 | 236.5-490.2 | 9.6-21.7 |
Fig. 1
Correlations of mean fibroglandular tissue volume (FTV), breast tissue volume (BTV), and volumetric breast density (VBD). (A) Correlation of FTV and VBD. (B) Correlation of BTV and VBD. (C) Correlation of BTV and FTV.
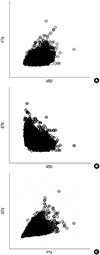
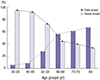
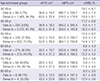
Table 2
Mean FTV, BTV, and VDG values of fatty and dense breasts in each age group
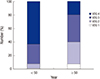
When patients were divided into the two categories by 50 years of age, there were 4,313 patients (72.3%) in the younger group and 1,654 patients (27.7%) in the older group. The proportions of VDG 1, 2, 3, and 4 were 0.8% (mean VBD, 4.3% ± 0.8%), 6.9% (mean VBD, 6.7% ± 0.9%), 29.2% (mean VBD, 11.6% ± 2.0%), and 63.1% (mean VBD, 22.1% ± 4.4%), respectively, in the younger group, and 7.7% (mean VBD, 4.2% ± 0.6%), 32.6% (mean VBD, 6.3% ± 0.9%), 40.3% (mean VBD, 10.8% ± 1.9%), and 19.5% (mean VBD, 20.5% ± 4.7%), respectively, in the older group; and these differences were statistically significant (P < 0.001, Fig. 3). The mean values of VBD were 17.8% ± 6.8% (median, 17.9%; interquartile range [IQR], 12.2%–23.2%) and 10.7% ± 5.8% (median, 9.1%; IQR, 6.3%–13.3%) in the younger and older groups, respectively.
DISCUSSION
Mammographic breast density reflects the glandular and stromal component of breasts. On mammography, fat appears dark, whereas fibroglandular tissue appears bright due to different attenuation of X-rays. Extensive bright breast density may lower the sensitivity of screening mammography by obscuring masses (1115). In this study, more than 90% of Korean women under 50 years of age, 72% of women in their 50s, and about 40% of women in their 60s and 70s showed had dense breasts. The proportion frequency of dense breasts was about 83.2% (4,967/5,967) in all of the enrolled subjects in our study; and our values are higher than those Kim’s study (13). Kim et al. (13) showed the distribution of mammographic density according to age group in asymptomatic Korean women with qualitative visual assessment; and their results were as follows: 78.3% (40–44 years), 61.1% (45–49 years), 30.1% (50–54 years), 21.1% (55–59 years), and 7.0% (60–64 years) of women were found to have dense breasts in 2000 (Fig. 4). There result of the overall tendency with aging was similar to our results, but their number of dense breasts per each age groups was small. The overall frequency of breast density might have been increasing for the past 15 years; and it may be due to changes in diet and environment or hormone replacement therapy. When considering that the method used in our study, FAVA, is more objective. We can conclude that most Korean women have dense breasts, as the frequency in our study was 83.2%, and this can be a cause of hindrance to lowered sensitivity of breast cancer screening with screening mammography. In Korea, a national breast cancer screening program was launched in 2002, and interest in screening mammography has greatly increased. When we consider that mammographic density has an influence on the sensitivity of mammography, the higher breast density in women in their 40s and 50s can be a major factor in reducing the overall breast cancer screening sensitivity in Korea, compared to other western countries (1316). Moreover in Korea, the reported incidence rates of breast cancer have continued to increase and are highest in patients in their late 40s and early 50s, whereas the incidence rates in Western women continue to increase with age (17). The incidence rates in Korea differ from those in the United States or United Kingdom (44.7, 92.9, and 95.0 per 100,000 women, respectively) (1819).
Fig. 4
Comparison of mammographic parenchymal density according to age. (A) Mammographic parenchymal density difference between current Korean women of our study and Western women*. (B) Chronological changes of mammographic parenchymal density in Korean women: comparison of previous† (1998) and current (2014, our study) women. * Data from Stomper et al. (20) in 1996. † Data from Kim et al. (13) in 2000.
In our study, the frequency of women with dense breasts in Korea was higher than 91% until patients reached their late 40s, and then there was a sharp decrease in frequency between the ages of 40 and 59 years. This characteristic change was unique compared to Western women, and similar to results observed in a study by Kim et al. (13) (Fig. 4). In the study of Kim et al. (13), there was a much greater proportion of dense breast, with an abrupt decrease in patients aged between 40 and 54 years. In western women, the proportion of women with dense breasts tends to decrease steadily with age but without abrupt changes; this is true even for patients who are in the 40–54 year age group (1520). After menopause, as a normal aging process, mammographic breast density decreases due to regressed glandular tissue (22122). The mean age of menopause is different among countries, which is especially earlier in Asian than in western women. Reports have shown that the values are 50–51 years in Italy, Iran, Slovenia, and the United States, while 47–50 years in Korea, Lebanon, Singapore, Greece, Morocco, Mexico, Taiwan, and Turkey (23). We evaluated breast density in the younger and older than 50 year age groups because the recently reported mean age of menopause was 49.4 years in Korea (14). In our study, the younger group had a much greater prevalence of dense breasts (92.3%) with higher VBD (mean, 17.8%) than the older group (59.8% with 10.7% VBD). Our study only considered age and not menopause; however, we suggest that menopausal status itself also plays a role in changing mammographic density.
We demonstrated that there is a much higher proportion of dense breast in Korean women than in women in other countries, including other Asian countries. Carmen et al. (24) reported a higher density in Asian women, and a lower density in African American women, and this difference was statistically significant. However, the VBD was much higher in our study than in the Saharan African, Asian, White, and African American groups in the study by Carmen et al. (2425). Ishihara et al. (26) reported that among Japanese women, the frequency of dense breasts was 43% at a mean age of 53.3 years.
Extensive bright breast density may also increase cancer risk by about 4–6-fold (1115). Several breast cancer risk assessment models have been developed using BI-RADS density (22227); however, this is a subjective method that does not consider exact numerical values. The area-based quantitative method is limited because breast thickness is not considered. The recently developed FAVA method is a highly reproducible volumetric method that takes breast thickness into consideration, and several reports have shown relatively good agreement between BI-RADS density and FAVA (81112). Moreover, several studies have reported a high correlation of FAVA with magnetic resonance imaging, a 3-dimensional objective method (2829). Recently, Ellison-Loschmann et al. (1) reported the distribution of breast density in asymptomatic New Zealand women according to ethnicity and age using FAVA. This was the first study written in English, which demonstrated an accurate VBD value in screening women using Volpara Imaging Software. It reported median VBDs according to age, with results of 5.6% for 55-year-old Europeans, 6.3% for 52.5-year-old Pacific Islanders, and 10.2% for 52-year-old Asians. In our study, the median VBD according to age was much higher at 15.3% for 44-year-old women, even though Asian women have the greatest risk of dense breasts. A younger median age could be the cause of the higher VBD; however, the mean VBD of our 50–59-year-old women was 12.4%, which was higher than that of 52-year-old Asian women in New Zealand. This fact also supported our hypothesis that Korean women have much higher breast densities and greater prevalence of dense breasts.
The FTV, BTV, and VBD values are obtained by calculating the difference between the amount of X-ray absorbed by the fibroglandular tissue and fat tissue (30). We evaluated the mean FTV, BTV, and VBD of both breasts. By summing up quantitative values across the breast, FAVA can calculate the volume of fibroglandular tissue and the volume of the breast in cubic centimeters. The VBD is then calculated by multiplying FTV by 100 and dividing the product by BTV. Therefore, FTV is positively correlated with BTV. Additionally, a positive correlation was found between VBD and FTV, whereas a negative correlation was found between VBD and BTV.
This study has several limitations. First, it was a retrospective study and included only patients with normal or benign results on screening mammography during a 1.5-month period of our cancer-screening program; thus, a selection bias might exist. However, this is overcome by the relatively large sample size, as well as inclusion of patients from both the national and private screening programs at our institution. Second, we applied the average values of both breasts into one representative level with FTV, BTV, and VBD. Moreover, we used two different FFDM units; thus, a generalized error might also exist. However, Gweon et al. (8) found no difference in FAVA data between two different FFDM units. Third, we evaluated only FAVA data and age without considering other multiple factors that can influence breast density, such as parity, menopausal status, history of hormone replacement therapy, body mass index, etc. Despite these limitations, our study is meaningful in that it is the first English-written study regarding mammographic density in a large sample of Korean women using quantitative FAVA. In the future, larger-scale clinical studies that consider the above factors should be performed.
The mean VBD decreased with aging or menopause, and was about 16% for 46-year-old Korean women, much higher than those in women from other countries. The proportion of dense breasts sharply decreases in Korean women between 40 and 69 years of age.
 XML Download