

 PDF
PDF ePub
ePub Citation
 Print
Print


INTRODUCTION
Although mild cognitive impairment (MCI) has been regarded as an intermediate state between normal and Alzheimer's disease (AD), all MCI patients do not progress to AD at a similar rate and some patients never convert to AD (1). In terms of early diagnosis for early therapeutic intervention, it is invaluable to predict whether or not a certain MCI case will convert to AD within a certain period. Many longitudinal studies have been conducted to identify meaningful predictors for AD conversion in MCI patients including clinical and neuropsychological measures (2, 3), genetic factors (4), cerebrospinal (5) and neuroimaging biomarkers (6, 7).
Biomarkers derived from various neuroimaging modalities in particular could be very good candidates as predictors given their important clinical advantages such as non-invasiveness, very high test-retest reliability, strong validity for AD pathological process, and clinical popularity. Reduced regional cerebral metabolism (CMgl) measured by fluorodeoxyglucose positron emission tomography (FDG-PET) (6, 8, 9), regional gray matter (GM) atrophy measured by MRI (7, 10), decreased fractional anisotropy (FA) for regional white matter (WM) tract derived from diffuse tensor imaging (DTI) (11) were reported to significantly predict AD progression in MCI population.
A combination of various neuroimaging measures may improve the prediction ability of any single measure given that each one reflects quite different stages of AD process (12). A couple of studies examined the effect of combining the modalities on the accuracy of AD prediction in MCI population. For example, one study explored the additive benefit of neuropsychological test score, FDG-PET, MRI, and CSF proteins on MCI to AD prediction, and found only significant combination effect of FDG-PET and episodic memory test score (13). Recently, another study compared FDG-PET, MRI, CSF proteins, and their possible combinations for AD prediction in MCI (14). The authors reported that while a model combining clinical information with MR imaging, FDG-PET, and CSF markers yielded the highest accuracy for predicting future MCI conversion, the most efficient model included only FDG-PET with the clinical covariates.
To our knowledge, however, no studies investigated the AD prediction abilities of the three following neuroimaging methods including DTI as well as MRI and FDG-PET simultaneously for the same MCI cohort. In this study, we examined AD progression of MCI patients after a 2-yr follow-up period and compared baseline regional CMgl, GM volume, and WM FA between MCI individuals who converted to AD (MCIc) and those who did not convert to AD (MCInc). We then tried to determine the most efficient, non-invasive AD prediction model through systemic comparisons of various models with single or multiple neuroimaging biomarkers and cognitive test.
MATERIALS AND METHODS
Subjects
Thirty two amnestic MCI individuals were recruited from a dementia and memory disorder clinic at Seoul National University Hospital. MCI was diagnosed according to the National Institute of Aging and Alzheimer's Association (NIA-AA) criteria for the clinical and cognitive syndrome of MCI (15): (1) concern regarding a change in cognition by patient or informant or clinician, (2) impairment in one or more cognitive domains, (3) preservation of independence in functional abilities, and, (4) not demented. In terms of criterion (2), a performance score for at least one of the four episodic memory tests was 1.5 standard deviation (SD) below the respective age-, education- and gender-specific normative mean (16, 17). The four episodic memory tests that were included in the Korean version of the Consortium to Establish a Registry for Alzheimer's disease (CERAD) neuropsychological battery were, the Word List Memory (WLM), Word List Recall (WLR), Word List Recognition (WLRc) and Constructional Recall (CR) test. Among 32 MCI patients, single domain amnestic MCI patients were 18 and multi-domain amnestic MCI patients were 14. All MCI individuals had an overall clinical dementia rating (CDR) index (18) of 0.5 as well as CDR memory score of 0.5.
The following exclusion criteria were applied to all subjects: (1) any evidence of present serious medical, psychiatric, or neurological disorders that might affect mental function; (2) any evidence of focal brain lesions other than white matter changes on MRI; (3) illiteracy; (4) severe visual or hearing loss; and, (5) no reliable informants.
Baseline clinical assessment
All subjects were examined by a psychiatrist with advanced training in neuropsychiatry and dementia research according to the protocol of the CERAD clinical assessment battery (17, 19). To acquire accurate information, a reliable informant was necessarily interviewed as well as the participant. A panel consisting of four psychiatrists with expertise in dementia research made clinical decisions, including the assignment of CDR index (18).
Baseline neuropsychological assessment
All subjects were administered the eight cognitive tests included in the CERAD neuropsychological assessment battery (17, 19) by clinical psychologists who were blinded to the psychiatrist's clinical assessment. The eight tests included were as follows: the Verbal Fluency test ("Animal category": VF), 15-item Boston Naming Test (BNT), Mini-Mental State Examination (MMSE), WLM, WLR, WLRc, Constructional Praxis (CP), and CR test.
Baseline image acquisition
Details of the neuroimaging data acquisition, including the FDG-PET and MRI, were described previously (20). Briefly, FDG-PET was performed using the ECAT EXACT 47 scanner (Siemens-CTI, Knoxville, TN, USA), which has an intrinsic resolution of 5.2 mm full width at half maximum (FWHM) and the images of 47 contiguous transverse planes with a 3.4 mm thickness for a longitudinal field of view of 16.2 cm. Before administering FDG, transmission scanning was performed, using three germanium-68 rod sources to correct the attenuation. Static emission scans began 30 min after the intravenous injection of 370 MBq (10 mCi) FDG and were continued for 30 min. All of the FDG-PET scans were performed in a dimly lit room with minimal auditory stimulation during both the injection and PETs canning. The subjects were in the supine position with their eyes closed during the scanning in order to minimize the confounding effects of any activity. The transaxial images were reconstructed using altered back-projection algorithm employing a Shepp-Logan filter with a cutoff frequency of 0.3 cycles/pixel as 128× 128×47 matrices with a size of 2.1×2.1×3.4 mm.
MRI was applied using a 3.0-T GE whole body imaging system (GE VH/I; General Electric, Milwaukee, WI, USA). A three-dimensional T1-weighted spoiled gradient recalled echo (SPGR) sequence was obtained (TR=22.0 ms, TE=4.0 ms, slice thickness/gap=1.4/0 mm, matrix=256×192, FOV=240 mm, Flip angle=40°). A dual spin-echo echo planar imaging (EPI) sequence was used to acquire DTI images. MR images with 25 non-collinear diffusion gradients and without diffusion gradient were acquired (TR=10,000 ms, TE=77.1 ms, B-factor= 1,000 s/mm2, matrix=128×128, slice thickness/gap=3.5/0 mm, FOV=240 mm, slice number=38). Additionally, fluid-attenuated inversion recovery (FLAIR) and T2-weighted images were also obtained for qualitative clinical reading.
Follow-up assessment
Each subject performed two serial clinical assessments at 12- month intervals by a psychiatrist according to the CERAD protocol. After each follow-up evaluation, the same consensus panel as the baseline assessment reviewed all the available clinical data obtained from current follow-up evaluation and made a clinical diagnosis and rated a CDR. Separately from the clinical assessments, the subjects performed the same battery of neuropsychological tests as in the baseline evaluation at each visit by clinical psychologists blinded to the psychiatrist's clinical evaluation. The subject's condition was considered to have progressed to AD if he or she met the NIA-AA diagnostic criteria for probable or possible Alzheimer's disease dementia (21). The final classification of converted (MCIc) and not converted group (MCInc) was based on the clinical status at the end of the 2-yr follow-up period.
FDG-PET and MRI data processing
FDG-PET imaging data were analyzed using Statistical Parametric Mapping (SPM) 8 (Institute of Neurology, University College of London, UK) implanted in the Matlab (R2011b; Mathworks Inc, Natick, MA, USA). Before statistical analysis, all images were spatially normalized to the Montreal Neurological Institute (MNI, McGill University, Montreal, CA, USA) space to correct inter-subject anatomical variability. Global metabolism was normalized by the count of each voxel to the total count of the brain using proportional scaling. Normalized images were smoothed by convolution using an isotropic Gaussian kernel with 12 mm full width at half maximum (FWHM) to accommodate inter-subject differences in gyral and functional anatomies and to increase dataset signal to noise ratios.
In case of MRI data, preprocessing of the three-dimensional T1 SPGR images were performed using SPM8 implemented in Matlab. A customized VBM approach was implemented following the combination of the VBM8 toolbox (http://dbm.neuro.uni-jena.de/vbm/) and the Diffeomorphic Anatomical Registration through Exponentiated Lie Algebra Toolbox (DARTEL) (22). The VBM8 toolbox provides ways to minimize the noise level of the segmentation. The DARTEL toolbox provided a high-dimensional normalization protocol that is expected to increase registration accuracy. Images were corrected for bias field inhomogeneities, registered using affine transformation, and tissue-classified into GM, WM, and CSF. The segmentation procedure was refined by applying two denoising methods. The first method is a spatially adaptive nonlocal means denoising filter, which removes noise while preserving edges (23). The second method is a classical Markov random field approach, which incorporates spatial prior information of adjacent voxels into the segmentation estimation (24). Registered rigid-body aligned tissue segments for each image in the MNI template space were produced and input into DARTEL in order to create a customized DARTEL template for all subjects. Then, DARTEL registered the individual tissue segments to the template in order to obtain the individual deformation fields. We applied those deformation parameters to warp and modulate each subjects' GM tissue maps for nonlinear effects in order to account for brain sizes. Each voxel in the resulting images represents an absolute amount of brain volume; and, because nonlinear spatial registration is applied, the same voxel location in each image can be assumed to correspond to the same brain structure. Finally, GM images were written with an isotropic voxel resolution of 1.0 mm×1.0 mm×1.0 mm and smoothed with a 10 mm FWHM kernel. After preprocessing procedure was completed, the obtained smoothed modulated normalized data were used for the statistical analysis.
Differences in regional CMgl and GM density between MCI subgroups were estimated on a voxel by voxel basis using ANCOVA with sex, age and education as covariates. We applied P value <0.005 (uncorrected for multiple comparisons) as a significance height threshold and 50 voxels as a cluster size threshold to decrease the probability of detecting false positives (25). For further model selection analyses, we extracted regional CMgl or GM density values at the local maximum of voxel clusters showing significant differences between the MCIc and the MCInc.
DTI data processing
Voxel-wise statistical analyses of the FA data were performed by Tract-Based Spatial Statistics (TBSS) (26) which is provided in FSL software package (http://www.fmrib.ox.ac.uk/fsl/) to compensate prior alignment related problem using non-linear registration. Before carrying out TBSS, eddy current and head motion were corrected and all images were aligned with each other. Using DTIfit program, the diffusion tensor model was fitted to product the FA images. The FA images were applied non-linear registration to FMRIB58 FA standard space template. The mean FA image was created, and then thinned to create mean FA skeleton image with a FA threshold 0.2. Finally, all subjects' non-linearly aligned FA images were projected onto mean FA skeleton image. After these steps, voxel-wise cross-subject statistical analysis was used to do group comparisons: MCInc vs. MCIc. In all comparisons, the null distribution was generated through 5000 permutations, and significance was tested at P< 0.005 level, uncorrected for multiple comparisons and threshold-free cluster enhancement (TFCE) (27).
Other statistical analysis
The mean age, years of education, and scores of all the neuropsychological tests were compared by t-test and the ratio of sex and domain subtypes were compared by Fisher exact test between the MCIc and the MCInc.
Logistic regression analyses were conducted to examine the ability of neuropsychological tests, neuroimaging measures, and various combinations of these measures to predict conversion to AD in MCI patients. We conducted the differences of -2 log likelihood (-2LL) to compare the predictive ability among various models with different numbers of independent variables statistically similar to previous study (20). The -2LL is derived from the logistic regression procedure and is directly proportional to the contribution of variables to the discrimination of groups. A smaller -2LL means a better predictive ability of the model. The -2LL difference can be used to compare the prediction models directly to those with different complexities (28). We included age and years of education as covariates in every logistic model as they are known to be related to progression to AD (29, 30).
RESULTS
Baseline characteristics of Alzheimer's disease-conversion group and non-conversion group
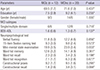
Of the 32 MCI patients who entered into the study, 12 (37.5%) converted to AD and 20 (62.5%) did not convert during the two-year follow-up period. The baseline characteristics of the MCIc and MCInc groups are shown in Table 1. There were no significant differences in age, years of education, sex ratio, the ratio of single vs. multiple domain subtypes of amnestic MCI, and the Blessed dementia scale-activities of daily living (BDS-ADL) score (17, 31). The MCIc had a significantly lower MMSE scores (t[30]= -3.19, P=0.003) than the MCInc. No significant group differences were found in other neuropsychological test scores. When we analyzed the z score of the neuropsychological tests, only the MMSE showed significant difference between two groups (mean z scores [SD] were -2.84 [1.85] in MCIc and -1.20 [1.15] in MCInc, P=0.004).
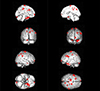
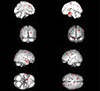
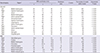
In terms of the baseline neuroimaging measures, the MCIc showed significantly lower CMgl in the frontal, temporal, uncus, inferior parietal, posterior cingulate, and precuneus regions than the MCInc (Table 2, Fig. 1). The MCIc showed significant lower GM density than the MCInc in multiple cortical areas including frontal, temporal, parietal and occipital regions (Table 2, Fig. 2). However, we did not find WM regions with significant differences of FA values between the two MCI groups.
Selection of prediction models for conversion to AD
First, we selected neuroimaging measures as the independent variables for logistic regression analyses in our model selection. Considering relatively small number of subjects included in the study, we used mean CMgl or GM density value of all the brain regions with significant MCIc vs. MCInc group differences as a candidate variable instead of selecting any specific region with the biggest between-group difference. In order to compute the mean value of all the significant regions, the average CMgl or GM density of each cluster was first extracted and then multiplied by the number of voxels of the cluster. The resulting values of all clusters were then summed and divided by the total number of voxels.
We did not select any regional FA values as candidate-independent variables because significant FA differences were not found between the two MCI groups. In addition to neuroimaging measures, we chose MMSE as an additional candidate-independent variable for further model selection process because it showed significant baseline MCIc vs. MCInc differences.
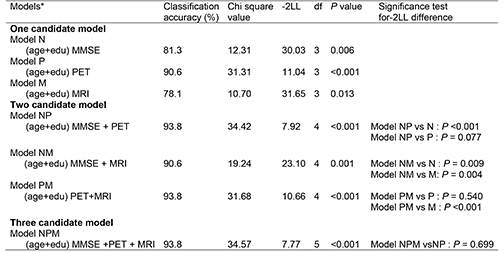
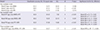
The logistic regression analyses for the prediction model selection were conducted in three phases (Table 3). In the first phase, we evaluated the following "one candidate models"; the model N including MMSE (neuropsychological measure), the model P including CMgl value (PET measure), and the model M including GM density value (MRI measure). Of the three "one candidate models", the model N and the model P were statistically significant. In the second phase, we compared the -2LL between the "one-candidate models" and each of the "two-candidate models", which included two variables among MMSE, CMgl, and GM density. The MMSE combined with CMgl model (model NP) was significantly better than the model N and showed trend towards significance of differences with the model P. The MMSE combined with GM density model (model NM) was significantly better than the model N and the model M. Of the "two-candidate models", the model NP showed high classification accuracy and the lowest -2LL value among them. In the third phase, the "three-candidate model" (model NPM), which included all three variables, was compared with the model NP, which had the lowest -2LL value in the three "two-candidate models" with statistical significance. The model NPM was not significantly different from the model NP. Table 4 shows the logistic regression model (model NP) that was finally selected.
Although no baseline neuropsychological tests except MMSE showed statistically significant differences, we additionally conducted similar model selection process using each of WLR and CR instead of MMSE, because previous reports demonstrated the predictive value of delayed recall tests in non-dementia individuals (32). The WLR- or the CR-alone model showed lower classification accuracy than the model N (i.e., MMSE-alone model). The combination models including either the WLR or the CR with GM density also had less accurate prediction than the model NM whereas the combination models including each delayed recall test with CMgl showed the same prediction accuracy and higher -2LL compared to the model NP (data not shown).
DISCUSSION
We followed MCI patients for 2 yr to compare the predictive ability of the FDG-PET, the MRI, and the DTI measures and to determine the most cost-effective, non-invasive AD prediction model through systemic considerations of the three neuroimaging modalities together with cognitive tests. Through a series of model selection steps including logistic regression analyses, we demonstrated that the baseline CMgl and the MMSE score combination model was the most efficient to predict conversion to AD in MCI patients.
In this study, 12 (37.5%) MCI patients converted to AD within two years. This rate is generally comparable to the results from previous studies looking at MCI to AD progression. Recent reports based on Alzheimer's Disease Neuroimaging Initiative (ADNI) showed a conversion rate of 17.2% annually (13) and 35% after a 2-yr follow-up (33). In 3-yr follow-up data reported the conversion rates of 26 to 48% (34, 35).
The MCIc had lower baseline CMgl than the MCInc mainly in the temporo-parietal, medial parietal (posterior cingulate and precuneus), and frontal regions. This finding is largely in line with the results from previous FDG-PET studies (6, 8, 9). These regions also correspond with the typical areas of hypometabolism observed in AD patients (36, 37).
In terms of baseline GM volume measured by structural MRI, the MCIc showed decreased GM density in multiple cortical areas including the frontal, temporal and parietal regions than the MCInc. These regions are largely similar to those reported in previous studies that applied the same voxel-based image analysis method (i.e., VBM analysis) (10, 38). In addition to GM loss in the frontal and lateral temporo-parietal regions, however, several studies reported that the degree of medial temporal atrophy at baseline was associated with the progression from MCI to AD (7, 34, 38), whereas other studies including the current study did not find such a relationship (13). The differences of image processing methods and subject characteristics between studies could partly explain the discrepancy.
Very few studies have focused on WM FA as AD predictors in MCI individuals. Although a region-of-interest (ROI) study reported that FA of temporal WM region at baseline can distinguish the MCIc and the MCInc after two years (11), no previous studies have investigated baseline WM FA of the MCIc compared to the MCInc through a voxel-based analysis. We conducted the voxel-based FA comparison using TBSS but did not find any significant baseline FA differences between the converters and non-converters. This negative finding may be associated with the facts that FA value is a very sensitive imaging measure. Its alterations begin to occur at a very early stage of AD process and show a floor effect even earlier than brain metabolic or volumetric changes (20). FA is believed to reflect the micro-structural integrity of WM fibers including axon and surrounding myelin (39). More recent studies have observed axonal injury at the very early or preclinical stage of AD (40, 41).
Among eight cognitive tests, only the MMSE was selected as a candidate variable for AD prediction and was included in the final prediction model with the FDG-PET variable. This indicates that global cognitive impairment level is important in forecasting the conversion of MCI to AD. Episodic memory task is most commonly reported as a good predictor for AD prediction in a non-demented state (3, 32), whereas we did not find significant baseline differences in episodic memory tests between the converters and non-converters. This may be related to small sample size. Two delayed recall measures, such as WLR and CR, showed trends towards significance of differences between the MCIc and the MCInc (Table 1). In addition, the floor effect for the two delayed recall tests due to relatively lower educational level of the subjects and the strict criteria of amnestic MCI itself which primarily depends on lower episodic memory scores (1.5 SD below the respective age-, education- and gender-specific normative mean of any episodic memory test scores) may also contribute to the similarity of test scores between the MCIc and the MCInc.
Based on the results from the analyses for each of the three imaging measures and cognitive tests, we selected CMgl, GM density, and the MMSE as potential candidate variables for the model predicting AD in MCI patients. In addition, we used mean CMgl or GM density of all the brain regions with significant MCIc vs. MCInc group differences as an independent neuroimaging variable instead of adopting predetermined regional CMgl and GM density values based on previous studies (e.g. temporo-parietal CMgl or hippocampus GM density). Our data-driven approach could minimize potential errors resulting from biased or unfair selection of predetermined regional values for MRI and PET, although predetermined regional approach would meet general interest for some popular regional values.
Through a series of systemic logistic regression analyses, we selected the model including CMgl and the MMSE (model NP) as the final model with the discrimination accuracy of 93.8%. The three-candidate model including GM density, CMgl, and the MMSE (model NMP) showed the same discrimination accuracy (93.8%), this model included MRI as well as FDG-PET. However, cost-effectiveness was decreased compared to the model NP. Taken together, this finding suggests that the combination of CMgl of FDG-PET and the MMSE score can predict AD conversion in MCI individuals most efficiently. The combination of CMgl with delayed recall test score also showed the same prediction accuracy with the model NP although each individual delayed recall test itself had less accurate prediction than the MMSE. Our finding of the additive effect of FDG-PET information to clinical information on MCI to AD prediction is very similar to those from previous studies (13, 14).
There are some limitations in this study. First, we should be cautious to generalize the results given that relatively small sample size possibly increases the type II error. Second, we used quantitative values for neuroimaging measures to compare and select the prediction models instead of relying on qualitative or semi-quantitative rating by neuroimaging experts as done in real clinical situation. Therefore, the results from this study may not be exactly the same with those based on less quantitative rating or reading of MRI and FDG-PET. In similar context, image processing methods or image data quality itself may also influence on the results. Finally, amyloid PET was not applied. As a result, we could not confirm whether all our MCI participants had amyloid deposition and were in the course of AD. If we studied on MCI subjects with sufficient amyloid deposition (prodromal AD or MCI due to AD), the results could be different.
In conclusion, the findings of this study indicate that the combination of regional CMgl measurement based on brain FDG-PET and global cognitive assessment with MMSE is probably the most accurate and/or efficient, non-invasive method to predict clinical AD in MCI elderly individuals after a two-year follow up period.

 XML Download