

 PDF
PDF ePub
ePub Citation
 Print
Print


INTRODUCTION
Recent evidence suggests that a restrictive spirometric pattern is relatively common and related to increased morbidity and mortality due to impaired lung function (1, 2). Epidemiological studies have shown that approximately 7 to 13% of adults have spirometrically-defined restrictive ventilatory defect (1, 2). However, there are few population-based studies on these topics.
Spirometry is a useful method to detect the pattern of airflow limitation. Total lung capacity measurement is essential to rule out or diagnose restrictive lung diseases. However, it is time consuming and not available for the screening of large populations (3). A low Forced Viatal Capacity (FVC) together with a normal or high forced expiratory volume in one second (FEV1)/FVC ratio (fixed ratio), has traditionally been classified as a restrictive abnormality (3). Fixed ratio clearly has an important role in detecting and grading airway obstruction in chronic obstructive pulmonary disease (COPD), however a role for screening of the restrictive ventilatory defect has rarely been examined (4, 5, 6). One study showed that contrary to popular opinion, a restrictive pattern on spirometry did not accurately predict true restrictive disease. Patients with a classic spirometric restrictive pattern have a <60% probability of true restrictive disease (5). However, studies on spirometry data and a recent study in Spain showed that 12.7% had restrictive ventilator defect (7). The US National Health and Nutrition Examination Survey (NHANES) III 2007-2010 study showed that 5.7% of the general population had restrictive spirometry results (8). There is a rising incidence of restrictive lung disease and studies have identified its association with morbidity and heart disease, such as COPD (9, 10). We determined the prevalence of restrictive lung disease from nationwide stratified random sampling data in Korea.
MATERIALS AND METHODS
Study design
KNHANES IV-2, 3 and V was a cross-sectional, nationwide survey performed by the Division of Health and Nutrition Survey, Korea Centers for Disease Control and Prevention (KCDC), between 2008 and 2012. The survey had a stratified, multistage, clustered probability sampling design and was composed of a health examination, health interview survey, and nutrition survey. Direct standardized physical examinations and a health interview survey were conducted in mobile examination centers, and trained interviewers visited subject houses for the nutrition survey (11). Subjects aged ≥40 yr from KNHANES IV-3, and V were selected for spirometric testing.
Sampling strategy in the KNHANES IV and V
The sampling plan followed a multi-stage clustered probability design and systemic sampling method (11). Two hundred from the 2008 survey and 192 from the 2009-2012 survey primary sampling units (PSUs) were drawn from approximately 200,000 geographically defined PSUs of the entire country. Twenty-three target households from the KNHANES IV-2, 3 (2008, 2009) and 20 households from KNHANES V (2010-2012) were sampled for each PSU, which consisted of 60-80 households. Individuals aged ≥1 yr were targeted in selected households. The samples were weighted to adjust for over-sampling, non-responders and post-stratification.
Spirometry
Participants were provided a detailed explanation of the spirometry procedure. The procedure was conducted by 4 technicians, each of whom underwent 2 education sessions on pulmonary function test (PFT) and quality control. Spirometry was performed using dry rolling seal spirometers (Model 2130; SensorMedics, Yorba Linda, CA, USA); the American Thoracic Society (ATS)/European Respiratory Society (ERS) repeatability criteria were used for quality assessment and standardization of PFT (12). Spirometric prediction equations were derived from survey data on nonsmokers from a Korean population with normal chest radiograph findings and no history of respiratory disease or symptoms (13). Individual spirograms were acceptable if they satisfied all the following criteria: 1) extrapolated volume <5% of FVC or 0.15 L (whichever was less), time for peak expiratory flow rate of >120 ms, 2) no cough during the spirometric examination, or glottis closure that influenced the measurement, 3) no early termination or cut-off, defined as any volume change that could not be found at least in one second or a reasonable exhalation time, 4) no Valsalva maneuver or cut-off during the examination, 5) No leak, 6) Unobstructed mouthpiece, and 7) maximal subject effort throughout. Reproducibility was defined as both, the difference between the largest FVC and the smallest, and difference between largest and smallest FEV1 of <150 mL.
Acceptable readings were recorded and transferred to the review centre on the internet. A trained technician further assessed whether or not the data met the criteria for acceptability and reproducibility, and provided quality control feedback to the study technicians. Data were finally confirmed by the principal investigator and saved in the Korea Center for Disease Control and Prevention's data management system.
Body mass index
Weight and height were measured at the examination. Body mass index was calculated by dividing each participant's weight in kilograms by the square of the height in meters. The following standard classification of the Korean Society for the Study of Obesity and Asian guideline was used: <18.5 kg/m2 (underweight), ≥18.5-22.9 kg/m2 (normal), 23-24.9 (overweight, at risk), 25-29 kg/m2 (moderate, obese I), ≥30 kg/m2 (severe, obese II).
Criteria for the assessment of spirometrically-defined and lower limit of normal (LLN)-defined restrictive ventilatory defect
Pre-bronchodilator FEV1/FVC≥70% and FVC<80% was defined as spirometrically-defined restrictive ventilatory defect (fixed-ratio criterion), according to the ATS criteria (14). Data which met 2 acceptable spirometry curves accurately showing the start of the test and expiration for ≥6 sec, and a greatest difference between 2 measurements of FEV1 or FVC of <150 mL, were included in the final analyses. We separately verified by the LLN criterion of prevalence, to resolve the concerns of over-diagnosis of restrictive ventilatory defect according to age. A prediction equation previously reported by Hwang et al. was used for assessing the prevalence of the LLN-defined restrictive ventilatory defect (15). A patient with an FVC<the LLN, and an FEV1/FVC ratio>the LLN was categorized as having restrictive ventilator defect. The severity of spirometrically- and LLN-defined restrictive ventilatory defect were assessed by the measured FVC %, as reported in the ATS/ERS guidelines (14).
Definitions for variables; smoking status, place of residence, income, and education level
A current smoker was defined as one who had smoked ≥100 cigarettes during his or her lifetime and reported current smoking. A former smoker was defined as one who had smoked<100 cigarettes during his or her lifetime, but reported having stopped smoking. A never smoker was defined as one who had not smoked during his or her lifetime.
Place of residence was classified as urban and rural. The place of residence was defined as rural if a subject's address was located in a Eup or Myeon, and urban if it was in a Dong. The smallest administrative districts in Korea are the urban Dong, and rural Eup and Myeon.
Income was categorized by ranking according to gender and age group in 5-yr intervals. Each subject's income calculated by dividing the total household income by the square root of the number of members in the household, was categorized as low, low-middle, middle-high and high (16). Educational level was divided into elementary school, middle school, high school, and college or higher according to the Korean educational course curriculum.
Radiologic examination results
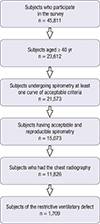
Screening chest radiography performed at age ≥15 yr since KNHANES IV-3 (2008) was used to investigate the prevalence of TB; hence we analyzed KNHNES IV-2, 3 and V data (2008 to 2012). The results of chest radiography had the possibility of error, therefore qualified pulmonologists and radiologists independently interpreted the presence of lung disease, including previous TB sequele. Individual readings were compared weekly and finally, 6 radiology specialists re-analyzed and confirmed the results. Spirometry was measured in 15,073 survey participants (6,526 males and 8,547 females) aged ≥40 yr, and 13,602 (90.2%) subjects had identifying reading results on the chest radiography.
Statistical analyses
The results for each variable were shown as the mean with standard deviation, in the case of continuous variables; and the number of cases per category and frequency of responses in the case of categorical variables. The prevalence of restrictive ventilatory defect and its 95% confidence interval (CI) were calculated. Comparisons between variables were tested using the chi-square test or Student's t-test. We performed a logistic regression model with restrictive ventilatory defect as the dependent variable, and age, gender, smoking history, BMI, place of residence, education level and previous TB history as independent variables. A forward selection method was used to exclude multi-colinearity of each variable. Odds ratio (OR) were calculated with SPSS 21.0 (SPSS Inc., Chicago, IL, USA).
RESULTS
Baseline characteristics and overall prevalence of restrictive ventilatory defect according to the fixed ratio and LLN criterion
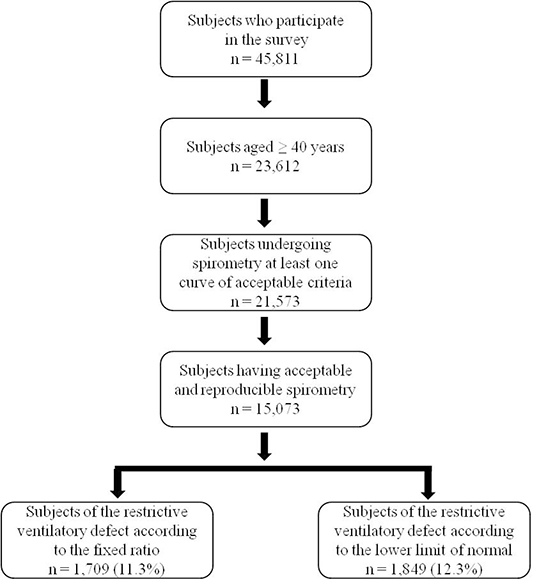
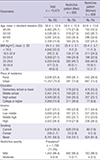
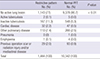
A total of 45,811 subjects participated in the survey during the 5 yr of screening. Of these, 23,612 subjects were aged ≥40 yr and 21,573 (91.3%) had spirometry with at least one acceptable curve. There were no statistical demographic differences, except age, between those who performed spirometry and those who did not. Thus the subjects who performed spirometry and were included for analysis were representative of the total population. Chest radiologic examinees (≥40 yr old) excluding subjects with an indeterminate pattern of spirometry (normal, obstructive, restrictive), included 15,073 subjects, aged ≥40 yr (mean age 56.9±10.9 yr) who satisfied the criteria for acceptability and reproducibility. Of the included subjects, 11.3% (n=1,709) had restrictive ventilatory defect with fixed ratio (Fig. 1); and 99% (n=1,831) of these were included in the mild restrictive category. Additionally, 12.3% (n=1,849) had a restrictive ventilatory defect according to the LLN criterion (data not shown). Of these 1,709 subjects, 85.6% (n=1,464) were included for final severity analysis after excluding missing values in any of the spirometric parameters (FVC, FEV1, FEV1/FVC). Most subjects with restrictive ventilatory defect (99.4%, n=1,455) had a mild restrictive ventilatory defect and the others had a moderate restrictive ventilatory defect. Participants with a restrictive ventilatory defect had a mean age of 60.2±10.8 yr (59.4±10.9 yr in men, 60.8±10.6 yr in women); 46.8% (800/1,709) were men; and mean BMI was 25.4±3.4 kg/m2 (0.7% in men and 1.7% in women with morbid obesity [BMI>35 kg/m2]) (Table 1). Male subjects in the restrictive ventilatory defect were more likely to be current smokers (79% in men vs. 7.6 % in women, P<0.05) (Table 1).
Risk factors for spirometrically-defined restrictive ventilatory defect
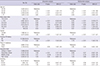
Univariate analysis for risk factors of the spirometrically-defined restrictive ventilatory defect showed that older age (in 50-59 yr; OR, 1.54; 95% CI, 1.33-1.79, in 60-69 yr; OR, 2.72; 95% CI, 2.35-3.15, in ≥70 yr; OR, 3.82; 95% CI, 3.25-4.48), underweight (BMI <18.5 kg/m2; OR, 0.398; 95% CI, 0.26-0.62), overweight (BMI 23-24.9 kg/m2; OR, 0.58; 95% CI, 0.37-0.89, BMI ≥35 kg/m2; OR, 3.03; 95% CI, 1.49-6.2), and previous TB history (OR, 1.86; 95% CI, 1.54-2.24) were associated with restrictive ventilator defect (Table 2). The male gender, rural residence compared to urban residence, low education level, and current smokers were also independently associated with restrictive ventilator defect (Table 2). Multivariate analysis showed that older age (in 50-59 yr; OR, 1.59; 95% CI, 1.35-1.86, in 60-69 yr; OR, 2.91; 95% CI, 2.44-3.42, in ≥70 yr; OR, 4.49; 95% CI, 3.68-5.40), underweight (BMI <18.5 kg/m2; OR, 0.46; 95% CI, 0.29-0.73), overweight (BMI 23-24.9 kg/m2; OR, 0.65; 95% CI, 0.41-1.04, BMI 25-29.9 kg/m2; OR, 0.98; 95% CI, 0.62-1.55, BMI 30-34.9 kg/m2; OR, 2.22; 95% CI, 1.28-3.52, BMI≥35 kg/m2; OR, 4.91; 95% CI, 2.34-10.33), male gender (OR, 1.57; 95% CI, 1.31-1.87), and previous tuberculosis history (OR, 1.78; 95% CI, 1.45-2.18) were statistically significant variables (P<0.05) (Table 2).
Radiologic diagnosis matching in subjects with spirometrically-defined restrictive ventilatory defect
Seventy-seven % of subjects with restrictive ventilatory defect had no active lung lesion according to the chest radiograph reading; 11.3 percent had inactive TB; 7.4% had other pulmonary diseases; 2.2% had cardiac disease and 2.0% had previous operation scar or radiation injury and/or mediastinal disease. These were significantly different compared to the subjects with normal pulmonary function. Those with "other pulmonary disease" (Table 3) included active lung disease other than TB and inactive TB, which meant past lung disease other than TB.
DISCUSSION
This was the first, general population-based study, to the best of our knowledge that provided a prevalence of the restrictive ventilatory defect accompanied with radiologic verification. The KNHANES study cohort had 11.3% subjects with fixed ratio criterion, and 12.3% of the general population with LLN criterion had a restrictive ventilatory defect at enrollment that was associated with previous TB history in multivariate logistic regression analysis after adjustment of covariate such as gender, smoking, aging, increasing or decreasing BMI. A study conducted in a large clinical laboratory at a university teaching hospital in the US also showed a similar prevalence i.e. 12.3% (6). According to a recent study in Korea using KNHANES IV, the prevalence of obstructive lung disease was 13.4% (17). Restrictive ventilatory defect prevalence might be comparable to the extent of obstructive lung disease. However, studies for restrictive ventilator defect have rarely been conducted worldwide.
Disorders causing restrictive ventilatory defect may be categorized into intrinsic lung diseases that cause inflammation or scarring of the lung tissue i.e. interstitial lung disease, or fill the airspaces with exudates or debris i.e. acute pneumonitis; extrinsic disorders such as chest wall or pleural disease (e.g. pleural effusion, obesity, pneumonectomy); and neuromuscular disorders (e.g. muscular dystrophy, kyphosis, scoliosis, ankylosing spondylitis). The history, physical examination and, chest radiograph are often helpful in distinguishing these disorders. Spirometry can also be used to detect these disorders (6, 18). However, low FVC by spirometry may be found in a proportion of normal subjects who complete spirometry using sub-maximal inspiratory effort and in subjects with obstructive lung diseases, such as asthma and COPD. Most subjects, in our study, with restrictive ventilatory defect showed normal chest radiography; only 11.3% had previous TB sequele and 7.4% had other pulmonary disease, 2.2% had cardiac disease, and 2.0% had lung cancer and/or mediastinal disease which were suspected for restrictive lung disease. Aging related over-diagnosis of obstructive lung disease has been reported using the fixed ratio, and differences could be meaningful in some reports (15, 19). The use of fixed ratio alone could be more problematic in restrictive ventilatory defect (7). For this reason, we additionally used LLN-defined prevalence of restrictive lung disease in our analyses. The results were similar to those obtained from fixed ratio (12.3% vs. 11.3%). Spirometry results were convincing and stringently quality-controlled (17). These results suggested that despite the likelihood of a high false positive rate in the restrictive spirometry results of the large population screening studies, the spirometry results from our study of KNHANES possibly reflected a real restrictive ventilatory defect including physiologic restrictive lung disease. Furthermore, we could verify the results by chest radiography.
Our study showed that aging and BMI might have an additive role in increasing the prevalence of restrictive ventilatory defect, reflecting a physiologic phenomenon rather than false positives. Despite being significantly associated with restrictive ventilatory defect in multivariate analysis, aging and BMI presumably caused physiologic changes leading to reduced FVC. A recent study showed associations between body weight and various respiratory diseases supportive of our results, except in very severe obesity where restrictive patterns emerged due to the impact of fat on respiratory function (20, 21, 22, 23, 24). Our study also showed a strong correlation of restrictive ventilatory defect with severe obesity (BMI≥35 kg/m2; OR, 10.68; 95% CI, 5.87-19.45). It is difficult to generalize due to the small number of subjects (n=47 [0.4%]). However other mild to moderate obesity and underweight factors also increased the risk of restrictive ventilatory defect in multivariate analysis, which suggested the possible association between body weight, even mild to moderate obesity, causing restrictive ventilatory defect. Further study would be needed to confirm these results.
FEV1 and FVC decline with age, but the decline in FEV1 is greater. Thus, the FEV1/FVC ratio also declines with age (25). Some older patients may not experience these symptoms even in the presence of lung disease because they instinctively limit their activities to avoid exertion that might lead to occurrence of symptoms. Additionally, a study conducted to assess the accuracy of spirometry showed that classical spirometric pattern of restriction could be misleading, since it represents a true restrictive defect in <60% of cases (8). Especially in this large population study, it was reasonable to compare with LLN criterion and to have radiologic support for the interpretation of spirometry results, in older adults and obese subjects.
Cautious interpretation of restrictive pattern in a study of general population is necessary. Heart failure is another largely unknown factor that is causally linked to spirometric restriction (26). Data on heart failure were not available in our study, but hypertension and increased total cholesterol level at enrollment were 41% and 21.5% respectively, in the restrictive group, a minority of whom presumably suffered from heart failure. A comparative, dynamic spirometry study on obstructive and normal lung function showed that the restrictive pattern had a high risk of serious co-morbidities (9). Restrictive ventilatory defect is also known for its association with increased cardiovascular mortality, and increased prevalence of diabetes and hypertension (1, 10). Further study would be needed for the association of restrictive ventilator defect with these variables.
Determination of the association of TB with restrictive respiratory ventilatory defect is important in Korea due to intermediate burden, and the many who suffer from either functional or structural respiratory sequele (27). One study conducted in Korea suggested that simple spirometry results may accurately estimate the extent of lung destruction. An obstructive pattern was found in 64% and restrictive pattern in 32% of the subjects (28). We used a scoring system adjusted to the chest CT to identify the extent of TB damaged lung, however, in a large population study chest radiography is the more useful and cost effective method. For instance, Lam et al. found that the existence of inactive TB on chest radiography was associated with a higher risk of airflow obstruction, independent of smoking status (29). Collectively, multicenter, retrospective study in Korea showed that the TB damaged lung could be screened by routine spirometry and chest radiography; the obstructive pattern (76.8%) was more prevalent than the restrictive pattern (30).
The major strength of this study was chest radiography as an additive tool for the interpretation of spirometry results, especially in the large, general population-based study. Both tools collectively provided added information and increased cost effectiveness, as discussed above. Cautious interpretation of chest radiography accompanied by the spirometry results, increased the accuracy of interpretation and provided a useful screening tool. The second strength was that the reliability of the spirometry results due to stringent quality control. Thirdly, LLN together with the fixed ratio for defining the restrictive ventilatory defect avoided misinterpretation.
The limitation of this study was that interpretation and categorizing of the chest radiology were somewhat not matched with our study purpose of confirmation of restrictive lung disease, since it was not designed as a prospective study targeting restrictive lung diseases alone. In fact, 7.4% of the restrictive ventilatory defect was categorized as "other pulmonary disease". This might have resulted from the difficulties in interpretation of chest radiography alone, without information on the subject's medical history or spirometry. Even clinicians, who have easy access to the subject information, frequently experience similar difficulties in the interpretation of chest radiography alone. Nonetheless, other pulmonary disease category had the possibility of including restrictive lung disease, such as interstitial lung disease. This study could form the basis of other large population studies for further development of resource utilization.
Early identification of unknown disease is important if early restrictive lung disease can be modified, but most restrictive diseases, including TB sequele and interstitial lung disease, cannot be modified at the time of notification when patients complain of respiratory symptoms. Accordingly, it appears reasonable and cost-effective to identify abnormal chest radiographic findings consistent with restrictive lung disease, especially in large population studies. This could be helpful for early rehabilitation and management prior to the development of severe respiratory defect. It could be additionally be helpful in improving the quality of life in patients with restrictive lung disease.
 XML Download