

 PDF
PDF ePub
ePub Citation
 Print
Print


INTRODUCTION
One of the latest advancements in magnetic resonance imaging (MRI) technology is the application of diffusion-weighted imaging (DWI), which offers quantitative evaluation of the apparent diffusion coefficient (ADC) (123). DWI, a technique involving measurement of the in vivo mobility of water molecules using motion-sensitizing gradients, is sensitive to such tissue characteristics as cell density, membrane integrity, and microstructure. Therefore, DWI is another approach that may improve MRI lesion characterization, and has the potential to yield physiologic information about the functional environment and movement of water in normal versus abnormal tissue (1234). Restricted water movement in tumors with high cellularity usually leads to higher signal intensity on DWI and smaller ADC values (2). On DWI, the ADC is measured by acquiring the MR signal at least twice with the following formula: ADC = [ln(S0)-ln(Sb)]/b, in which S0 and Sb are the signal intensities on DWI with and without diffusion weighting, respectively (5).
The potential role of quantitative ADC measurements using DWI in breast lesions has been reported recently. ADC measurement was reported to be helpful in differentiating benign from malignant breast lesions, and to be valuable as a biomarker that may allow the prediction and early detection of treatment response of malignant breast tumors (6789). There have been a number of studies concerning the quantitative DWI technique to improve the specificity of contrast-enhanced MRI for the diagnosis of malignant breast lesions. These studies have confirmed that the ADC is significantly lower in malignant tumors than in benign breast lesions and normal tissue (678). Some studies have focused on the power of DWI for predicting response to chemotherapy (10). However, since ADC can be influenced by certain factors, such as image noise and motion or susceptibility artifacts, ADC measurements on DWI can include errors resulting from these factors (111213). Therefore, in order for the ADC of breast lesions to be used as a clinical biomarker for the diagnosis of malignancy or the monitoring of treatment response, the reproducibility of quantitative ADC measurements needs to be determined, since this will elucidate the magnitude of ADC changes that can be detected confidently (213).
Despite many previous studies concerning DWI of the breast, little is known regarding its reproducibility. Some studies of other body parts suggest that ADC measurements may not be generally applicable because of many other factors, such as imaging techniques, tumor location, tissue types, and location of the region of interest (ROI) (131415). A recently published study suggested DWI of the breast based on readout-segmented echo-planar imaging for higher image quality and lesion conspicuity, compared with single echo-planar imaging (1617). Another recent study provided reproducible ADC values in normal fibroglandular tissues (18). However, to our knowledge, variability of ADC values in malignant breast lesions has not yet been reported. Therefore, the purpose of our study was to evaluate the reproducibility of ADC measurements in malignant breast masses, and to investigate the influence of mammographic parenchymal density on this reproducibility.
MATERIALS AND METHODS
Subjects
Between October 2010 and February 2011, 85 consecutive breast cancer patients who were referred for preoperative MRI were prospectively enrolled in our study. Among these patients, we excluded those who demonstrated a non-mass enhancement (NME) pattern on MRI (n = 16), those with inflammatory breast cancer (n = 2), and those with bilateral breast cancer (n = 1). Finally, 66 patients (all women; mean age, 52.5 yr; age range, 29-82 yr) were enrolled in our study.
MRI protocol
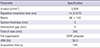
Each patient underwent MRI with a 3.0-T system (Achieva; Philips Healthcare, Best, The Netherlands) with a dedicated 4-channel breast coil (MRI device; Wurzburg, Germany). DWI was performed twice, in addition to the routine breast MRI protocol. Images were obtained in the following order: The first DWI was performed. Next, routine unenhanced MRI, including T1-weighted axial and T2-weighted fat-saturated fast spin-echo acquisition (TR/TE, 2,300/65) sagittal imaging, was performed. The second DWI was then performed without patient repositioning. The time between the first and second DWI sets was approximately 20 min. Finally, dynamic contrast-enhanced T1-weighted sagittal fat-suppressed images were obtained after intravenous bolus injection of gadodiamide 0.1 mM/kg of body weight (Omniscan; GE Healthcare, Ireland Cork, Ireland). For both the first and second DWI sets, the same single-shot echo-planar imaging parameters were used (Table 1). Fat suppression was achieved by using a chemical-shift selective fat-suppression technique. DW gradients (i.e., b factors of 0 and 800 sec/mm2) were applied in 3 orthogonal directions.
Imaging analysis
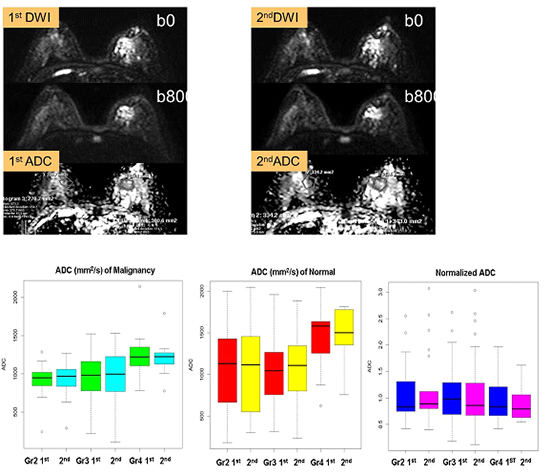
One radiologist with 5 yr of experience in interpreting breast MR images selected malignant masses for ADC measurement by using all MR sequences of each patient. The malignant breast lesions were identified initially on contrast-enhanced high-spatial-resolution images. For each malignant lesions, the radiologist manually drew ROIs encompassing as much of the lesion as possible on the corresponding target lesion on the ADC map. One ROI on 1 target lesion image showing the largest diameter of the malignant mass was used. ROI measurements of the ADCs of target lesions were performed by 2 radiologists, with 6 and 3 yr of experience interpreting breast MR images, independently. ROIs were readjusted for each DWI sequence in the same manner for 2 measurements. The dedicated software automatically calculated the ADCs by using the signal intensity within the manually drawn ROI with the following equation: ADC = [ln(S0)-ln(S800)]/800, in which S0 and S800 were the signal intensities on DWI with b values of 0 and 800 sec/mm2, respectively (Fig. 1 and 2). In order to prevent inaccuracies, we avoided including central necrosis and hemorrhage.
We added normal breast tissue ADCs to adjust the malignant ADC value. The same process was repeated for normal glandular tissue of the same size in the contralateral breast. In normal breast tissue, ROIs were chosen carefully so that they were as far as possible from the lesion in the same quadrant as the contralateral breast. For each lesion, the mean absolute ADC of the malignant lesion (ADC l) and of the contralateral glandular tissue (ADC g) was calculated. The normalized ADC (ADC n) then was calculated as follows: ADC n = ADC l/ADC g (19).
We also retrospectively reviewed the radiographic and pathologic reports to assess mammographic parenchymal density, microcalcifications, and the coexistence of a ductal carcinoma in situ (DCIS). The radiographic report of mammographic parenchymal density and microcalcifications was based on the Breast Imaging Reporting and Data System (BI-RADS) classifications.
Statistical analysis
On repeated DWI, mean ADCs were compared between the first and second DWI sets by using the paired t-test. The difference in mean ADCs between malignant masses and normal parenchyma was also evaluated by using the paired t-test. The reproducibility of ADC measurements was then evaluated by using the intraclass correlation coefficient (ICC) for the DWI pair (20); an ICC greater than 0.75 was considered to represent good agreement. To estimate the magnitude of change in ADCs that can be detected confidently in a single individual, the 95% limits of agreement between the ADCs measured on the first and second DWI sets were obtained according to the Bland-Altman method (21), and were expressed as a percentage of the mean ADCs. Interobserver agreement between the two readers was assessed by using ICCs and 95% Bland-Altman limits of agreement.
The effects of mammographic parenchymal density, histology, and lesion size on reproducibility also were assessed by ICCs between repeated ADC measurements of reader 1. To evaluate the differences in the reproducibility of ADC measurements on the basis of lesion size, all target lesions were categorized into 1 of 3 groups (≤20 mm in diameter vs. 20-40 mm in diameter vs. >40 mm in diameter). Mammographic parenchymal density, the coexistence of mammographically detected suspicious microcalcifications (more than BI-RADS category 4b), and the existence of a DCIS component in final pathology were also used to categorize the patients into subgroups for further evaluation. The differences in the ICCs between the 2 measurements for each characteristic were then compared by using the z test.
Statistical analyses were performed by using commercial software (SPSS, version 21; IBM Corporation, Armonk, NY, USA; and Med-Calc; MedCalc Software, Mariakerke, Belgium). A P value <0.05 was considered to indicate a significant difference.
RESULTS
Our study included 66 malignant breast masses in 66 patients; all masses were invasive ductal carcinomas with a mean diameter of 28.92 mm (range, 6-89 mm).
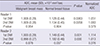
The ADCs of the malignant breast masses are summarized in Table 2. The mean ADC value of the malignant breast masses was significantly lower than that of the normal breast tissue for both readers (P≤0.006). In the case of reader 1, there was no statistically significant difference in the mean ADC measurement of malignant breast masses and normal breast tissue between the first and second imaging sets (P≥0.804). The normalized ADC was calculated as 1.051 (SD, 0.53) for the first measurement and 1.083 (SD, 0.65) the second time; there was no statistically significant difference between the first and second imaging sets (P=0.379). In the case of reader 2, there was no statistically significant difference in the mean ADC measurement of malignant breast masses (P=0.878). However, there was a significant difference in the mean ADC measurement of normal breast tissue between the first and second imaging sets (P=0.037). The normalized ADC was calculated as 1.114 (SD, 0.94) for the first measurement and 1.013 (SD, 0.49) for the second measurement; there was no statistically significant difference between the first and second imaging sets (P=0.276).
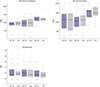
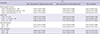
The overall reproducibility of repeated ADC measurements was good in all tissues, with ICCs ranging from 0.863 to 0.961. Reproducibility of ADC measurements in malignant breast masses was good for both measurements, with a mean ICC of 0.876; similarly, the corresponding agreement for normal breast tissue was good for both measurements, with a mean ICC of 0.947 (Table 3). The 95% limits of agreement between the ADC measurements on repeated DWI of malignant breast masses was 31.9% of the mean ADCs, ranging from 31.0% to 32.8% (Fig. 3), whereas the 95% limits of agreement between those of normal breast tissue was 31.8% of the mean ADCs, ranging from 30.2% to 33.4% (Fig. 3).
Interobserver agreement of ADC measurements between the two readers was moderate to good for malignant breast masses, with a mean ICC of 0.751 (range, 0.573-0.855). Agreement for normal breast tissues also was moderate to good, with a mean ICC of 0.655 (range, 0.474-0.782) (Table 3).
Regarding mammographic density, the ADC measurements were less reproducible for the lesions in extremely dense breasts. The ICCs of repeated ADC measurements in malignant breast masses in extremely dense breasts was moderate, with a mean ICC of 0.651 (range, 0.153-0.885) (Table 4). This value showed a tendency to be adjusted when compared using normalized ADC values (Fig. 4). Lesion size, coexistence of mammographically detected microcalcifications, and coexistence of a DCIS component on final pathology showed no significant relationship with ADC reproducibility (Table 4)
DISCUSSION
Quantitative ADC measurements using DWI are a promising tool for improving the specificity of MRI for the diagnosis of malignant breast masses. Recent studies concerning this technique show the potential for improving the positive predictive value (PPV) of breast MRI for lesions of various types and sizes (672223). According to one study, applying an ADC threshold of 1.81×10⁻³ mm2/sec for 100% sensitivity produced a PPV of 47% vs. 37% for dynamic contrast-enhanced MRI alone (22). Moreover, ADC measurements have the potential to allow monitoring of the malignant breast mass and evaluation of the response to antitumor treatment (10). However, the practical application of ADC measurements remains controversial and requires standardization according to the imaging equipment and institutional protocol (24). Therefore, knowledge of the reproducibility of ADC measurements is of great importance for accurate interpretation of changes in the ADCs. For example, changes in the ADC values on follow-up DWI could result from measurement error or from actual changes caused by the tumor's response to treatment.
We prospectively studied the short-term reproducibility of ADC measurements in malignant breast masses. In our study, we excluded NME type because of the inevitable involvement of normal tissue and difficulties in ROI location. However, we thought that the selection of ROIs in NME lesions could cause greater potential bias in the evaluation of ADC measurement reproducibility. We used a combined b value of 0 and 800 sec/mm2 for ADC determination, according to a similar DWI study protocol performed using a 3.0-T system (10). However, in another study using a 3.0-T imager (TIM Trio; Siemens, Erlangen, Germany), the researchers suggested a combined b value of 50 and 850 sec/mm2 for high accuracy in the differentiation of breast lesions (25). Our ADC measurements were affected by some tissue capillary microperfusion at a lower b value. Theoretically, ADC measurements with DWI are ideally obtained with multiple b values. Pereira and colleagues (26) found that it is not necessary to use multiple b values because the sensitivity of ADC measurements with two b values is equivalent to that with multiple b values. Further studies regarding the effect of the number of b values on the reproducibility of ADC measurements may be worthwhile.
In our study, the overall short-term reproducibility of ADC measurements was good in malignant breast masses, with a mean ICC of 0.876 (range, 0.823-0.959), and also good in normal breast tissue, with a mean ICC of 0.947 (range, 0.786-0.976). The agreement of ADC measurements in normal breast tissue between the two readers was worse than that in malignant breast masses, with mean ICCs of 0.655 (range, 0.474-0.782) and 0.751 (range, 0.573-0.855), respectively. Relatively low interobserver agreement of ADC measurement in normal breast tissue could not be overcome by using the normalized ADC value, which resulted in a mean ICC of 0.553 (range, 0.203-0.730) (Table 4). In our data, the 95% limits of agreement between the ADCs of malignant breast masses measured on repeated DWI sets ranged from 31.0% to 32.8%, whereas those of normal glandular breast tissue ranged from 30.2% to 33.4%. This result implies that repeated ADC measurements within this range could be interpreted as a measurement error. Our findings may suggest some guidelines for the future application of quantitative ADC measurements using DWI: If the ADCs of malignant breast masses are to be used to monitor treatment response, it would be preferable to perform follow-up DWI with the same imaging technique as the initial DWI in order to achieve an accurate comparison of the ADCs. Our ADCs and obtained normalized ADCs were not significantly different and are in good agreement with previously published data using comparable diffusion-weighted parameters (161925).
In the case of normal breast tissue, there was a significant difference in the mean ADC values obtained by reader 2; the ICC values of interobserver agreement were relatively lower than those for malignant breast masses (0.642-0.667 vs. 0.739-0.763). However, the short-term reproducibility of ADC values in normal breast tissue of reader 2 was good, with a mean ICC value of 0.961. Malignant breast masses showed relatively good agreement between observers and repeated measurement.
We also evaluated several factors possibly affecting the reproducibility of ADC measurements; we considered mammographic parenchymal density, coexistence of mammographically detected microcalcifications, and coexistence of a pathologically proven DCIS component. We postulated that breast parenchymal density and microcalcifications could affect the diffusion capacity physically, while DCIS-accompanied malignant breast masses could have more chance of technical error with respect to lesion selection and size measurement. We found that mammographic density did affect the reproducibility of ADC measurements in malignant breast masses: ADC measurements tended to be relatively less reproducible in extremely dense mammographic parenchymal backgrounds, with an ICC of 0.651. This could be adjusted with the normalized ADC value, with an ICC of 0.809 (Fig. 4). The reproducibility of ADC measurements in malignant breast masses, normal tissue, and adjusted ADC value was good irrespective of lesion size, coexistence of mammographically detected microcalcifications, and coexistence of a DCIS component.
Our study had several limitations. First, the purpose of our study was to evaluate the reproducibility of ADC measurements over a short-term duration, which differs from that used in actual clinical practice. Moreover, sequential DWI was performed without patient repositioning. Second, DWI at a 3.0-T or higher magnetic field strength has the potential to increase the signal-to-noise ratio and spatial resolution, which can result in increased artifacts and magnetic field inhomogeneity. However, some studies reported good diagnostic accuracy with DWI using a 3.0-T MR system for evaluating breast masses (1925). Third, in our study, there was no case with fatty mammographic parenchymal density. Our study had a prospective design. Given the time constraints of clinical practices, we could not include such a case. Fourth, we selected mammographic findings as factors for representing the parenchymal density and coexistence of microcalcifications. However, there might have been microcalcifications that could not be detected on mammography only. Mammographic parenchymal density is considered subjective and not quantitative data. We believed this limitation could be compensated for by using a computer-aided diagnosis system. Fifth, our exclusions in the patient population are a limitation. Moreover, our data sample size was small. We controlled the condition as mass appearance for better comparison. Further studies are recommended to strengthen the power of this study. Finally, our study was performed by using the same MR scanner from a single vendor.
In conclusion, ADC measurements are highly reproducible in malignant breast masses in the short term. However, mammographic parenchymal density may potentially influence this reproducibility, especially in extremely dense breasts. This can be adjusted with the normalized ADC value. ADC changes of less than approximately 32% fall into the range of measurement error.

 XML Download