

 PDF
PDF ePub
ePub Citation
 Print
Print


INTRODUCTION
The physician workforce or adequacy represents the proper number of physicians available for relevant local area. Adequate physician density has been issued again because of the accelerating growth of the elderly population. Increasing number of primary care practitioners improves the clinical outcomes (123). An adequate number of physicians is also important for medical care. Nationwide physician density has stabilized. However, the distribution in local provinces remains uneven (45), with an oversupply of physicians in metropolitan areas and a shortage of physicians in rural areas (45).
This uneven distribution of the physician work force according to country characteristics has been studied (67). Despite financially supportive policies in rural areas, uneven high distribution in metropolitan areas has continued (8). This pattern of physician distribution directly affects disease-specific mortality. Higher primary physician density has been related with better health outcomes including lower mortality (910). However, the county level analyses have shown mixed associations between physician density and mortality (111).
Several recent studies showed the significance of adequate urologist density and also their distribution related with disease care (121314). Similar to uneven national distribution of other types of physicians, urologist density is also proportionally higher in metropolitan areas (12), which can have an influence on mortality due to cancer such as prostate cancer, bladder cancer, and kidney cancer (121314). Few reports, however, have examined the uneven distribution of urologist density (121314).
While there are concerns about the number of urologists in rural areas, to the best of our knowledge there are no published data exploring urologist distribution using small geographic units. We assessed the geographic distribution of urologists across Korea at the county level including small geographic units to determine county characteristics associated with increased urologist density considering time. We also investigated factors affecting the distribution.
MATERIALS AND METHODS
Geographic groups and characteristics
We used an ecological study design in which the unit of observation was a group of individuals mainly based on the definition of public administration that these units demonstrate the demographic, geographic and environmental characteristics of county level. The geographic units comprised metropolitan cities, non-metropolitan cities, and rural areas, according to the Korea Ministry of Security and Public Administration. Officially, there are 163 units. However, the present analysis conducted from 2007 to 2011 considered 165 country units comprising 7 metropolitan cities, 78 non-metropolitan cities, and 80 rural areas. The difference reflects the change of some rural areas into cities and the merger of some cities in current scenario. Ministry of Security and Public Administration defines that a metropolitan city, a non-metropolitan city, and a rural area have a population size exceeding 1,000,000, exceeding 50,000, and less than 50,000 respectively.
The number of doctors and urologists in each country unit was obtained from records of the National Health Insurance Service, Ministry for Health, Welfare and Family Affairs. Urologist and doctor density was defined as the number of urologists and doctors, respectively, per 100,000 individuals at the county level.
In the United States, the American Medical Association (AMA) Master file provides the number of physicians (15). The Korea government does not have such a Master file which necessitates data acquisition by Ministry for Health, Welfare and Family Affairs. Population data was obtained from the Population Census Division, National Statistical Office. Total product sum of each country unit and individual income data were obtained from the Survey Management Bureau, National Statistical Office.
Local temperature was obtained from National Atmospheric Administration. Republic of Korea is located in the southern part of the Korean Peninsula, which extends about 1,100 km (680 mi) from the Eurasian continent. The country, including all its islands, lies between latitudes 33° and 39°N, and longitudes 124° and 130°E. Its total area is 100,188 square kilometers (http://www.ngii.go.kr/kor/board/view.do?rbsIdx=103&idx=66). Local temperature was defined as the average temperature for 1 yr including the four distinct seasons of spring, summer, autumn, and winter.
Statistical analysis
The primary outcome measurement was the number of urologists per 100,000 individuals at the county level from 2007 to 2012. Maps were generated using X-Ray Map for Web GIS software (http://biz-gis.com/XRayMap). The level of urologist density was classified as 0, 0 to 2, 2 to 4, 4 to 6 and greater than 6 urologists per 100,000 populations in one map. The level of doctor density was classified as 0 to 80, 80 to 120, 120 to 160, 160 to 200 and greater than 200 doctors per 100,000 populations in the other map.
To investigate the factors influencing urologist density, two-way ANOVA was performed. Country unit characteristics of metropolitan cities, non-metropolitan cities, and rural areas, and time as year were independent variables. Urologist density was the dependent variable. To adjust the time sequence longitudinally, regression analysis with Fitted plot was performed. Year was an independent variable. The difference or ratio of urologist density between those two different country unit was the dependant variable. ANCOVA was performed including the covariates of country unit characteristic, time (year), total product sum, individual income and local temperature as independent variables. Urologist density was the dependant variable.
RESULTS
Urologist density from 2007 to 2012 according to county unit characteristics
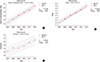
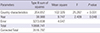
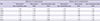
Urologist density was higher in metropolitan cities than non-metropolitan cities and rural areas from 2007 to 2012 (Table 1). Two-way ANOVA revealed that urologist density was affected by country unit characteristics (P<0.001) and year (P=0.048) (Table 2). Fig. 1 depicts the geographic distribution of urologist density in Korea. Comparison of the geographic distribution in 2007 and 2012 revealed an overall increase in urologist density, with a density of 2 to 4 per 100,000 people in 2007 and 4 to 6 per 100,000 in 2012. Consideration of metropolitan cities, non-metropolitan cities, and rural areas revealed a significant increasing pattern of urologist density (Fig. 2). For metropolitan cities, the correlation coefficient was 0.996 (P<0.001), regression equation equaled '-318.6+0.1609×year', and coefficient of determination (R-square) was 99.2%. The respective values for non-metropolitan cities were 0.997 (P<0.001), '-265.1+0.1337×year', and 99.5%. For rural areas, the respective values were 0.958 (P=0.003), '-253.5+0.1274×year', and 91.8%.
Relative urologist density from 2007 to 2012 according to country unit characteristics
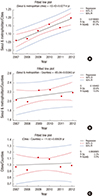
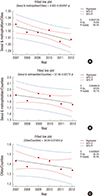
Relative urologist density including differences and relative ratio between two different country units is summarized in Table 2. Differences of urologist density between two different country units and the relative ratio of urologist density between two different country units are summarized in Fig. 3 and 4, respectively.
The difference of urologist density between metropolitan cities and non-metropolitan cities (urologist density of metropolitan cities - urologist density of non-metropolitan cities) had a correlation coefficient of 0.948 (P=0.004), regression equation=-53.42+0.027×year, and coefficient of determination (R-square)=89.8%. The correlation coefficient for the difference of urologist density between metropolitan cities and rural area (urologist density of metropolitan cities - urologist density of rural area) was 0.571 (P=0.236). The correlation coefficient for the difference of urologist density between non-metropolitan cities and rural area (urologist density of non-metropolitan cities - urologist density of rural area) was 0.151 (P=0.755).
The relative ratio of urologist density between metropolitan cities and non-metropolitan cities (urologist density of metropolitan cities/urologist density of non-metropolitan cities) had a correlation coefficient of -0.828 (P=0.042), regression equation= 10.50-0.0045×year, and coefficient of determination (R-square)=68.6%.The correlation coefficient of the relative ratio of urologist density between metropolitan cities and rural area (urologist density of metropolitan cities/urologist density of rural area) was -0.700 (P=0.122). The correlation coefficient of the relative ratio of urologist density between non-metropolitan cities and rural area (urologist density of non-metropolitan cities/urologist density of rural area) was -0.603 (P=0.205).
Covariate variables affecting urologist and doctor density besides country unit characteristics
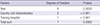
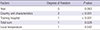
Affecting covariate variables including the presence of training hospital (P<0.001) for urologist density aside from country unit characteristics (P<0.001) are presented in Table 3. Table 4 summarizes the affecting covariate variables including training hospital (P<0.001), total product sum (P=0.0282), and local temperature (P=0.0416) for doctor density, aside from the country unit characteristics (P<0.001).
DISCUSSION
The present study is the first attempt to find urologist density at the county level and factors associated with the distribution in Korea. The country is a densely-populated developing nation that features heavily and lightly populated regions.
The geographic distribution of urologists was uneven. This could be directly relevant to urologic disease-related mortalities. Such as association has been described in the US for cancer-specific mortality; counties that had more than zero urologists evidenced a 16% to 22% reduction for prostate cancer, 17% to 20% reduction for bladder cancer, and 8% to 14% reduction for kidney cancer with increasing urologist density, compared to counties with no urologists (1213). In the US, rural residence and low urologist density were associated with increased kidney and renal pelvis cancer mortality at the county level in the state of Illinois, USA (14). In the US, the uneven distribution of urologists is reportedly affected by preexisting medical infrastructure, referral patterns, and the growth of group practices to share calls and assist with surgery, and predominantly by provincial characteristics including metropolitan vs. non-metropolitan regions (12).
Findings from two-way ANOVA show a similar nationwide uneven distribution of urologists. Detailed regression analysis using Fitted plots adjusted by years (Fig. 2,3,4) revealed that this uneven distribution originated from the differences between metropolitan cities and other areas.
In cross-sectional analysis, the present results are similar to previous reports from the US. However, longitudinal analysis with regression over years produced different results. There could be several reasons for the difference. First, it might be caused by the different social economic situations between the US and developing Asian countries including Korea. In contrast to the US, Korea features a greater population dichotomy between metropolitan and non-metropolitan regions including general cities and rural locales. The second reason is that previous US reports did not include longitudinal data (121314).
Until now, urologist density and general physician density have increased overtime, with an evident uneven geographic distribution (Fig. 1 and 5). To determine the influential factors for the uneven distribution of urologist density, we performed an ANCOVA, which revealed that the presence of training hospitals was the major factor. For general practitioner, the presence of a training hospital and the total product sum of the relevant region were determining factors for distribution (Table 5). Clustering of physicians has been attributed mainly to resource allocation and ability for maximum remuneration (11). Income was the main determinant for physician distribution. Unemployment and insurance coverage were not determinants for urologist distribution. Similarly, in this study, the uneven distribution was not restricted to urologists, but rather applied more widely to physicians. Recent studies about the uneven distribution of primary care providers have shown that this phenomenon is widespread, which possibly has a substantially negative influence on the inequality between clinician distribution and patients in the point of view for national public health (31617).
For this setting, more detailed tests are needed to confirm whether the presence of training hospital or average income are determinant factors for uneven distribution of urologist in Korea. Moreover, our analysis did not consider specific different conditions of Korea compared with those of other Organization for Economic Cooperation and Development (OECD) countries (18). The increasing rate of doctor density estimated as 40% is much higher than that of general population estimated as 7.5%, which shows five times higher between 2000 and 2010. Uneven distribution of doctor density also exists in Korea (Fig. 5), which results in the meaningful difference in geographic distribution rather than absolute doctor density in rural area.
The adequacy and proper distribution of physicians can only be properly estimated by analyzing the objective patient basic biological data and clinical outcomes. However, this approach is not easy to take. As a result, most reports (including this one) have assessed the distribution by national statistical data concerning each country unit. The only published study that is close to our approach addressed the relationship between urologist density and patient outcomes including prostate cancer mortality, but still suffered from the limitation of defining at the state level, with the inherent local variations (1314). Further detailed studies focusing on additional patient outcomes in smaller and more precise geographic units are necessary to provide the real proper adequacy and distribution of urologists.
The uneven distribution of urologists and physicians is anticipated to worsen as older urologists in less populated regions retire and younger urologists increasingly seek to practice in large metropolitan areas (12). Younger urological and surgical trainees are more apt to choose urban locales with the increasing emphasis of lifestyle in career choices (19). Although there is broadly increasing medical school enrollment and residency trainees in the US, the disparity in distribution of physicians will be aggravated because only 3% of trainees choose rural practice (11). Thus rural regions would be disproportionally served by older physicians (20).
The adequate number of urologists has not been established yet because the increasing number of urologists in a given region does not guarantee to lessen urologic cancer-related mortality. Although the presence of urologists is associated with lower mortality for urologic cancers in relevant country units, increasing urologist density is not necessarily related to further improvements of urologic cancer-related mortality. Adequacy and proper distribution of physicians in the future work force are important issues that could be influential in public health improvement.
A higher local workforce of primary care physicians has a generally positive benefit for general populations, with showing greater benefits of service quality than simply quantitative service due to the increasing number of physicians (21). The authors also emphasized the weak connection of the numbers of physician trainees with the numbers of primary care physicians for planning and research, and for actual delivery of ambulatory primary care services. This means that not just the number of physicians, but the adequacy and quality of physicians, could improve the public primary health.
Although many studies have investigated the adequacy and proper distribution of physicians, few studies have addressed the relevant issues for urologists. More detailed studies about urologist density are needed. Moreover, creative solutions are needed to address workforce issues including urologists as well as primary care clinicians relating to urologic disease mortalities.
How to overcome the current disparity of distribution of urologist or primary care clinicians remains elusive. Teleconsultation/telementoring programs and evidence-based telemedicine in rural area or restriction of national health care service in high doctor density areas could be realizable alternatives. However, those alternatives require exploration and validation about their efficacy and tolerability. One favorable fact for Korean medical circumstance regarding this issue of uneven distribution of medical service is that Korea has high medical care access rate among OECD countries (18).
In conclusion, uneven distribution of urologists throughout Korea reflects the relatively small number of urologists in rural areas. The discrepancy reflects the increasing tendency of urologists to practice in urban settings. The presence of training hospitals and lifestyle decisions were predominant reasons. However, more detailed investigations are needed to conclude that these factors are determinant for uneven distribution of urologist. Future studies are warranted to explore the effect of this uneven distribution on specific clinical outcomes.


 XML Download