

 PDF
PDF ePub
ePub Citation
 Print
Print


INTRODUCTION
Injury is a leading cause of death and disability in children and adolescents worldwide (1). According to the Statistics Korea, injury (external cause) was the second common cause of death in those younger than 10 yr old and was the leading cause of death in teenagers (2). The incidence of unintentional injuries in daily life was 17,606 per 100,000 persons and severe injuries were 286 per 100,000 (3). In this telephone survey, children and adolescents were most vulnerable to injures out of all the age groups, and those who lived in rural areas were more vulnerable than those in urban area (3). Annually about one million patients visited emergency centers for unintentional injuries (4). Injured children constitute about 30% of all pediatric patients presenting to the emergency departments (EDs) in Korea (5). Even though many research and reports such as consumer injuries surveillance system by Korea Consumer Agency and injuries surveillance system by KCDC had published in Korea, the nationwide report for pediatric unintentional injuries who visit emergency department has not yet reported (67891011). As pediatric injuries are considered to be preventable, most strategies seeking to prevent it focus on the identification of risk factors. Unintentional injury is affected by environmental factors such as region of residence, age and gender (1213141516).
Therefore, the purpose of the current study was to investigate the epidemiologic characteristics of the Korean pediatric unintentional injuries presenting to the emergency department by age, gender and regions. At the same time, the present study is expected to serve the basis for an in-depth epidemiological investigation in high risk regions.
MATERIALS AND METHODS
Study design
A cross-sectional, retrospective study was conducted. Data collected from January 2010 to December 2011 was extracted from the National Emergency Department Information System (NEDIS) of Korea. We included unintentional injuries in patients aged < 20 yr from 128 out of 140 emergency centers in Korea.
Status of NEDIS
The NEDIS has been in operation since 2003 and collects data from more than 130 Korean emergency centers, which are managed by a national center. In 2010, Korea had a total of 466 emergency institutes which included 16 regional emergency centers (1-2 centers in every large city or province), 121 local emergency centers including 4 special emergency centers (1 center per million inhabitants in cities and 1 per 500,000 people in rural areas), and 329 local emergency institutes (4). NEDIS included about 40% of patient data out of all emergency rooms in Korea (4).
Data and variables
NEDIS data include information on patient age and gender; geographic location of the ED; pre-hospital and ED treatment, including the times and dates of ED admission and discharge; use of the 119 emergency medical service (EMS) ambulance; mechanism of injuries; disposition of emergency care; and results of admission. The mechanisms of injuries were classified into motor vehicle collision (MVC), collisions, slip down, penetration, burning, poisoning, asphyxia/hanging, drowning, other, and unknown in NEDIS. Patients injured in motor vehicle collisions were divided into passengers, pedestrians, cyclists, motorcyclists, others, and unknown. We defined the children and adolescents as younger than 20 yr old; and they were divided into the following age groups: <1 yr, 1-4 yr, 5-9 yr, 10-14 yr, and 15-19 yr. Regions of injuries were divided into seven metropolitan/large cities and nine large provinces based on administrative boundaries on the year 2010; seven metropolitan and large cities (Seoul, Incheon, Busan, Daegu, Ulsan, Gwangju and Daejeon); nine provinces (Gangwon, Gyeonggi, Gyeongbuk, Gyeongnam, Chungbuk, Chungnam, Jeonbuk, Jeonnam and Jeju). Regional emergency centers were located in 16 provinces and cities.
We considered patients as critically injured when they were admitted to intensive care units (ICUs), underwent emergency operations, or died. Patients who were dead on arrival or died in the ED after admission were also included in the critical injury group.
Statistical analysis
We used SPSS software (version 20; IBM Corporation, Armonk, NY, USA) for all statistical calculations. Frequencies and proportions of categorical variables and means and standard deviations of continuous variables are presented. The chi-square test was used to explore the significance of differences between patients with critical and non-critical injuries, and Student's t-test was used for the comparison of continuous variables.
RESULTS
Demographics of pediatric unintentional injuries in the ED
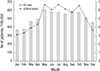
During the study period, a total of 764,411 injured pediatric patients visited the 128 EDs in Korea. Most (n=723,718, 94.7%) injuries were unintentional. Excluding patients who were transferred to other hospitals, total participants were 697,590 patients (330,965, 366,625 in each year). Regional emergency centers treated an annual average of 14.3% of all patients. The median age was 5 yr (IQR 2-12) and males constituted 64.7% of all patients. By definition of critical injuries, 1.0% (n=6,845) of all injuries were considered to be critical. The largest proportion (40.1%) of patients was aged 1-4 yr, followed by those aged 5-9 and 15-19 yr. Table 1 shows the incidence of ED visits and critical injuries for pediatric unintentional injuries of 0- to 19-yr olds by age and gender. The rate of ED visits of pediatric unintentional injuries was 6,097 per 100,000 and 0-4 aged children were the most common age group (13,980 per 100,000). Male adolescents of 15-19 yr were the most frequent age group of critical injuries (122 per 100,000). The proportion of referred-in patients was 4.5% (n=31,610). The most common type of insurance was national insurance 86.9%, traffic accident insurance 8.1%, and medicare 2.5%. The most frequent month of ED visits was May and followed by June, September, as shown in Fig. 1. Critical injuries occurred most frequently between May and August. Non-critical injuries between May and October were 1.5 times more frequent than those in the other 6 months.
Acute outcomes of pediatric unintentional injuries
A total of 93.9% (n=608,525) children were discharged from the EDs. The admission rate of unintentional injury was 5.8% and ED mortality rate (not including mortality after admission) was 0.05% (n=381). Others type of disposition was 0.2%. Critical injury was occurred in 59.8/100,000 and mortality was 5.4/100,000. Of all admitted patients, 6.8% (n=2,781) were admitted to ICUs and 9.1% (n=3,666) underwent emergency operations, respectively (Fig. 2). Additionally, 16.6% (n=608) of patients who underwent emergency operations were admitted to ICU. Over the 2-yr period, 615 (0.1%) patients died before or after visiting EDs; 26.3% (n=162) of these patients were dead before ED arrival, 35.7% (n=219) died after ED resuscitation, and 38.0% (n=234) died after admission.
Mechanisms of pediatric unintentional injuries
The common mechanism of unintentional injury was collisions (26.5%), followed by other injuries (19.8%), slip down (18.5%), and motor vehicle collisions (MVCs, 11.8%). The injury mechanisms were different by age group and gender. In patients aged 0-4 yr, injuries were caused most commonly by falls, collisions, and burns. Most injuries in those aged 5-14 yr were caused by collisions, followed by slip down, penetration, and MVCs. MVCs caused most common injuries in patients aged 15-19 yr, followed by collisions and slip down. The mechanisms of critical injuries differed from those of non-critical injuries. The most common causes of critical injuries were falls in aged 0-4 yr whereas they were MVCs in other age groups (Table 2). A total of 36.1% of critical injuries caused by MVCs were affected by motorcyclists and 32.2% affected by pedestrians. MVC passengers and bicyclists sustained 18.5% and 12.2%, respectively, of all critical injuries. Of all critical injuries, 94.8% of all motorcycle accidents happened in 15-19 yr adolescents and male constituted 91.8%. Bicycle injuries were the most common type of injuries (39.0%) in those aged 10-14 yr.
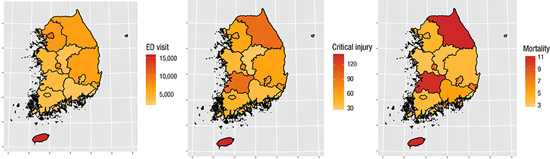
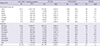
Regional distribution of pediatric unintentional injuries (Table 3, Fig. 2)
Of all administrative regions, Seoul, Incheon and Gyeonggi provinces constituted 60% of all ED visits with unintentional injuries. Of seven metropolitan/large cities, the ED visit rate of three cities (Seoul, Daejeon, Incheon) was higher than average rate. Of nine provinces, the ED visit rate of four provinces (Jeju, Gyeonggi, Gangwon, Gyeongbuk) was higher than average rate. The rates of ED visits, critical injury, and mortality were all highest in Jeju. Excluding Jeju, the rate of ED visits was highest in Seoul with 9,416.5/100,000 and followed by Daejon (7,337.4), Gyeonggi (6,906.4), and Incheon (6,587.8). The rate of critical injury was highest in Jeju (144.5) with over two times than average rate. Next highest areas were Jeonbuk (96.8), Gangwon (96.4), Gwangju (86.3), and Daejeon (77.1). The mortality rate was highest in Gangwon (11.3), and followed by Jeju (11.1), Jeonbuk (10.9), and Gwangju (10.1). The rates of critical injury and mortality were highest in Jeju, Gangwon, Gwangju, and Jeonbuk than those in other areas.
DISCUSSION
This analysis is the first epidemiological study of ED unintentional pediatric injuries in Korea. The rate of ED visits for pediatric unintentional injury was 6,097 per 100,000 and critical injury was 60 per 100,000 (<20 yr population). The mortality rate was 5.4 per 100,000. The hospital admission rate was 5.8% and the rate of critical injury was 1.0% in ED pediatric unintentional injuries. The mortality rate of pediatric unintentional injury presenting to ED was 0.1% including the field death and hospital death. Unintentional pediatric injuries occurred most commonly in those aged 0-4 yr and were predominantly caused by collisions. Male motorcyclists aged 15-19 yr formed a high-risk group for critical injury and mortality.
For every ED fatally injured children and adolescents (<20 yr) in this study, an average of 66 required hospitalization (an average 11 patients needed ICU hospitalization or emergent operation) and a further 1,130 children were seen in an ED. Gallagher et al. (17) reported that for every fatally injured child aged ≤19 yr, 45 children required hospitalization and a further 1,300 were seen in EDs and discharged in the USA. Another survey in Southeast Asia found that, for each death, 12 children were admitted to hospital or became permanently disabled, and 34 required medical care or missed schools or work because of injuries (18). Although the child injuries pyramid varies by national socioeconomic status and culture, the analysis by year will reflect the change of severity and mortality in each country (19). If nationwide ED-based injury surveillance system is established, it could provide an efficient and useful way to determine and compare injury incidence in a defined area (20).
We also found that age, gender and mechanisms of injury differed in those with critical and non-critical injuries. Most patients with non-critical injuries presenting to EDs were boys and girls aged 1-4 yr. Their parents could be considered to a target group for ED-based injury prevention programs. In infants aged <1 yr, falls were the most common mechanism of critical and non-critical injuries (>20% of all injuries). Motor vehicle accidents (MVCs) accounted for about 67% of fatalities and 44% of critical injuries in patients aged >1 yr. However, the type of MVCs differed by age group. Motorcycle crash injuries were the most common type of injuries in males aged 15-19 yr. Bicycle crash injuries were very common in those aged 10-14 yr and pedestrian injuries were common in those aged 5-9 yr. The mortality rate was higher in males than in females and transportation injuries were the leading cause of death in Korea (2). Our results should be used to draft an injury prevention strategy for children and adolescents.
Korea lacks a community trauma system, and pre-hospital EMS systems simply bring patients to the nearest hospital, regardless of its capacity to treat critical pediatric injuries. The critical injury patients need high level trauma management than those with non-critical injury. Several studies reported the differences of trauma mortality according to geographic area, socioeconomic status, races, and availability of medical care (212223). According to several reports, inter-facility transfer causes a delay of definitive pediatric trauma care and affects outcomes after cares (242526). Therefore, it is necessary to establish a trauma system in communities and appropriate field triage by EMS provider. The trauma system could avoid unnecessary inter-hospital transportation and may improve the outcomes of injured patients. Because of large numbers of visiting or traveling people, not habitant populations, we found that Jeju province needed more resources for prevention and management of pediatric unintentional injuries. Also EDs in Gangwon and Jeonbuk had a lot of critical injuries patients including mortality cases. These acute outcome of ED pediatric unintentional injuries must be considered to build a community based trauma system.
Our study had several limitations. First, we did not include all unintentional injuries suffered by young people in Korea in the analysis. However, the NEDIS contains data from all regional and over 100 local emergency centers (annually over 10 million registered people). Our data are thus reasonably representative of Korea as a whole. Second, the mortality data constituted just 42.9% of all injury related mortality cases (excluding intentional injury related mortality) during the study period (2). Because the causes of mortality from the Statistics Korea were categorized into MVCs, falls, drowning, fire, poisoning, and others, we used NEDIS data for in-depth analysis of the causes. Third, NEDIS data do not include severity scores (e.g., Abbreviated Injuries Scale or Injuries Severity Score). We defined critical injuries in terms of ED disposition only not including critical procedure or severe diagnosis. Therefore, the actual frequency of critical injuries will be higher than we assumed. Fourth, the NEDIS data on geographic location of injuries did not indicate the patient's place of residence, but rather the location of the NEDIS-participating hospital visited. For example, Jeju Province is the most popular vacation area in Korea and had the highest rates of unintentional and critical injuries per head of population. We suspect that a significant proportion of injured victims in this province were visitors, not local residents. Although patients' addresses were not included in NEDIS data, the information provided was useful in planning regional trauma system preparedness. Fifth, mechanisms of injuries were classified as "other/unknown" in more than 20% of cases, reflecting incomplete data collection and analysis. This proportion was similar to those reported from other countries (1319).
In conclusion, the ED visit rate of pediatric unintentional injuries was 6,096 per 100,000 (<20 yr). For every ED fatally injured child, 11 children had critical injury and about 1,100 children visited ED for injury. High-risk groups by age and gender, specific mechanism (e.g. 15-19 aged male, motorcycle) should be targeted to prevent pediatric injuries in Korea. Also the region specific programs must be designed to reduce pediatric injuries.

 XML Download