

 PDF
PDF ePub
ePub Citation
 Print
Print


INTRODUCTION
A breast cancer is one of leading cancers for the Korean women and its incidence rate has been rapidly increasing every year (1). An early diagnosis of breast cancer is a crucial step in reducing the mortality rate because the breast cancer survival rate rises to 95.6% (2) if breast cancer is detected during stage I. Various researches on the early diagnosis of breast cancer have been conducted and the National Cancer Institute (NCI) in the United States has released a Web-based Breast Cancer Risk Assessment Tool (3). The tool is based on the Gail Model (4) and it is purely based on the epidemiologic data. A drawback of the NCI Tool maybe relatively low accuracy in prediction (i.e., 58%-59%) (5). However, it could be a still good prediction tool since the women can check the risk of breast cancer at home without visiting hospital.
Recently, computational discrimination methods have been applied for clinical classification and regression analysis (67) of risk factors. Emerging artificial intelligent algorithms have the potential to extract meaningful information or identify differences among the enormous amount of data. Previously, a considerable amount of research regarding risk assessments of breast cancer using computational discrimination methods has been performed. Bayesian network (BN) and artificial neural network (ANN) are used to calculate survivor rates for breast cancer patients, and these modeling techniques show high sensitivity and specificity (8). These breast cancer risk assessment models are helpful for clinical diagnosis and breast cancer treatment planning (9). Hybrid models of ANN and BN using clinical data (especially mammography) have been previously used in the risk analysis and diagnosis of breast cancer (1011). BN models based on a number of risk factors have been previously investigated for Korean women (812). However, these studies have limitations in their generalizability because of small sample sizes. However, a discrimination of breast cancer using only epidemiological risk factors based on case-control study data set has not been performed previously.
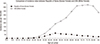
Breast cancer risk assessment requires the analysis of different characteristics that depend on race (13). Particularly, the incidence of breast cancer in Korean women is lower than in Western women, and the incidence in Korean women begins to decrease after the age of 50, whereas the incidence in Western women increases gradually with age until 80 yr old, as shown in Fig. 1 (1415). The Gail model based on western women data would have to be recalibrated to rates of breast cancer in Korea to make it applicable. Therefore, a Korean breast cancer risk assessment tool (KoBCRAT) which is more applicable to Korean women than the Gail model based on western populations has been developed using a case-control study (Seoul Breast Cancer Study, SeBCs) with 4,647 cases and 4,601 controls (16). Although the same raw data from SeBCs has been used to develop each model, there are two main differences between the KoBCRAT and the breast cancer risk classification algorithm proposed in this research. First, unlike the KoBCRAT, the proposed algorithms in this research were developed and validated with a rich data set, which were 2,291 cases and 2,283 controls through different selection criteria. Breast cancer risk classification algorithms for Korean women were developed considering those rates as well as augmenting risk factors for Korean women. Data were separated with respect to age groups and risk factors were selected according to the methods. Secondly, KoBCRAT has been developed based upon Gail model's equation while the three different classifiers such as the support vector machine (SVM), ANN, and BN are being considered in this research. Further, the results of three different methods were compared for two different reasons; 1) to find out which method is the best and 2) to validate a method comparing with the other two methods.
Results showed that area under the curve (AUC) values of receiver operating characteristic (ROC) curve are calculated as 60%-64%. Accuracy, sensitivity, specificity, single iterative calculation time, and contribution of a specific risk factor to models are presented in detail. Although the true diagnosis of breast cancer cannot be replaced by proposed model for predicting the risk of breast cancer, the proposed model can encourage potential breast cancer prone women to go the hospital for diagnostic tests.
MATERIALS AND METHODS
Acquisition of epidemiological data and study subjects
This study is based on cases and controls recruited from 1994 to 2007 in the SeBCS, which is a community-based breast cancer case-control study. The cases (n=4,647) consisted of female patients diagnosed with histologically confirmed breast cancer, who were admitted to three major general hospitals in Korea. The controls (n=4,601) were selected from a cancer-free health examinee population. Only non-invasive information was obtained through survey questionnaire for the controls. From these groups, frequency matching by 5-yr age groups and enrollment years (1994-1997, 1998-2002, 2003-2007) was performed and 2,370 patients and 2,370 controls were selected as a trial set. A total of 166 subjects were excluded in the trial set because they did not have a sufficient number of risk factor variables. Finally, 4,574 subjects were used in this study, including 2,291 cases and 2,283 controls. All trial sets were divided into training set and test set. A training set was used to train the three classification algorithms. Then, a test set was evaluated by trained classification algorithms for receiver operating characteristic (ROC) curve. From a test set, cases correctly classified into the case category were considered as true positives (TP), controls correctly classified into the control category were considered as true negatives (TN), controls classified into the case category were considered as false positives (FP), and cases classified into the control category were considered as false negatives (FN).
Major risk factor selection
A variety of risk factors have been associated with breast cancer risk. Demographic characteristics, reproductive factors, and lifestyle habits (1718) were assessed by trained interviewers after receiving informed consent from the patients.
The trend of incidence rate for Korean women differs from that for American white women, as shown in Fig. 1. The incidence rate of breast cancer has a different aspect, depending on the age group, compared with the incidence rate of other cancers (19). Therefore, we divided our data into two the datasets to select major risk factors for Korean women, with one dataset including subjects under the age of 50 and the other including subjects at and over the age of 50, because the trends of incidence rates differ around the age of 50 among Korean women. The major risk factors of breast cancer were selected by computing the odds ratios (ORs) and 95% confidence intervals (95% CIs) by repeating univariate and stepwise multivariate logistic regression analyses. The risk factors included in the final model were based on Wald tests for individual parameters (20) and on information from previously established breast cancer risk factors.
The age of first full-term pregnancy (AFFP), the number of children (NOC), the age of menarche (AOMn), body mass index (BMI), family medical history of breast cancer (FMH), menopausal status (MS), regular mammography (RM), and regular exercise (RE) were considered as major risk factors in the trial set. In addition to these factors, lifetime exposure to estrogen (estrogen exposure duration, ED), the age at menarche and gestation period for premenopausal and postmenopausal women, and the age at menopause for postmenopausal women were considered. In case of AFFP, age of subjects was considered as numeric data. Input value of 'No children' subjects was set to be 0. Numeric data were used for input of NOC, AOMn, BMI, and ED risk factors. Several risk factors in forms of non-numeric data such as FMH, MS, RM, and RE, were assigned as 0, 1, or 2 in forms of numeric data.
In total, 4,599 calculations were performed in this study. The raw data obtained from the epidemiological data set were separated by three age group models: under the age of 50 (U50), equal to or over the age of 50 (O50), and all ages (ALL). The analysis methods were developed according to the classification algorithms (SVM, ANN, and BN). These methods were configured differently depending on the selected combination of risk factors to find the optimal combination of selected risk factors. Based on all of the risk factor selection combinations (selecting from one to nine risk factors), the performances of a total of 511 combinations (Sum of 9Ci [I=1, 2, 3, ..., 9]) were analyzed by each classification algorithm. One thousand iterations were performed for each calculation to yield a total of 4,599,000 iterations (3 classification algorithms ×3 age groups ×511 risk factor selection combinations ×1,000 iterations).
Configuration of classifiers: Support vector machine
SVM is a classification algorithm based on a statistical machine learning technique. This method was first introduced in 1995 and has since rapidly spread to be used in various applications (212223). Breast cancer diagnosis using clinical data was also developed (24). Given a set of training data, SVM finds hyperplanes in a higher dimensional feature space, and the optimal hyperplane with the largest distance to the nearest training data provides a high generalization of the performance of the classification or regression. The non-linear kernel functions can be applied to the algorithm to classify linearly inseparable problems. After a preliminary comparison test (linear function, radial basis function, and polynomial function), we used a nonlinear third-order polynomial kernel function in this study since all SVM models (SVM-ALL, SVM-U50, and SVM-O50) showed a better performance with polynomial, linear, and radial basis function, respectively. Among the polynomial functions, third-order polynomial function which showed highest mean values was chosen for three SVM models.
Configuration of classifiers: Artificial neural network
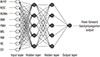
ANN is a classical artificial intelligence algorithm that has a structure of simulated neurons that are connected together in a similar manner as neurons in the biological brain. Each neuron of the ANN receives inputs either from a number of other neurons or from an external stimulus. The output of a neuron is a function of the weighted sum of the connected neurons, and the weighting factors between neurons are iteratively trained to output an optimal result by the back-propagation procedure. For a preliminary test on layer structures, single layer structures (number of nodes: 5, 9, 18) were simulated, but the result was slightly lower than the one of double layer structures. Therefore, several simulations were conducted for the double layer structures to find the optimal layer structure. A layer structure with 3 or over hidden layers did not improve the classification performance. As a result, a double hidden layer neural network was established with 9 nodes in the input layer and 5 nodes in the hidden layers, as shown in Fig. 2. A hyperbolic tangent sigmoid function was applied for the hidden and output layers as the transfer function. A resilient back-propagation algorithm (Pprop) (25) and a mean square error with regularization function (msereg) were used to train the neural network.
Configuration of classifiers: Bayesian network
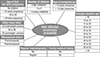
BN is a directed, acyclic graph that compactly represents a probability distribution (26). The use of BN is a powerful framework for addressing complexity and uncertainty. In addition, the relationships among the variables can be deduced intuitively, and decision making can be supported by listing states combined with probability. Each node is associated with a probability function that takes as an input a particular set of values for the node's parent variables and outputs the probability of the variable represented by the node. In this study, all risk factors were selected through Wald tests for all of the parameters of the epidemiological data, and all risk factors were assumed to be independent from one another. As a result, a naïve Bayesian classifier was used in which the target node is the parent of all the other nodes, as shown in Fig. 3. The breast cancer incidence rate of Korean women that was used as the conditional probability variable of our BN was obtained from the annual report of cancer in Korea (15).
Performance evaluation of classifiers
The training set was randomly selected from 90% of the epidemiological data set, and the remaining 10% were used as the test set. To reduce the randomness of the training and test set selection, all of the calculations are iterated 1,000 times for each combination by a repeated random sub-sampling validation. After training a classifier, the trained algorithm classified each subject of the test set into either the case or control category. Then, accuracy, sensitivity and specificity were calculated by TP, TN, FP, and FN as follows:


The performances of a computational discrimination method can be evaluated by the ROC analysis. ROC analysis provides criteria for selection of the optimal model and clinical decision. The ROC curve is presented at varying thresholds to balance sensitivity and specificity. For plotting the ROC curve, simulation results of ANN and BN which were evaluated as varying threshold values were calculated by Pprop & msereg and probability function, respectively (2526). In SVM, threshold controlled by bias which was intercept of the hyperplane. The prediction validity can be estimated by the AUC of the ROC curve. The AUC was calculated using a numerical integration of the ROC curve.
To compare the performance between the methods, a single iterative calculation time was measured from the total iterative processing time divided by 1,000 according to the classification algorithms, age division models and risk factor selections. All calculations were conducted in Matlab (The Mathwork, Inc., Natick, MA, USA) using a Windows 7 64-bit operating system on an Intel Xeon E5405@2.00 GHz CPU with 8 GB RAM.
RESULTS
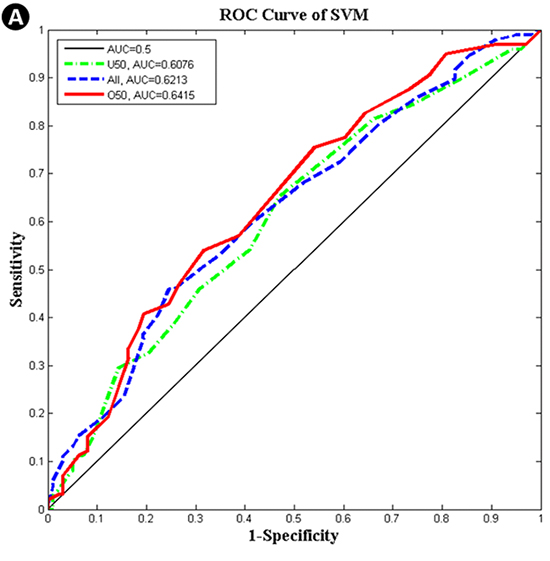
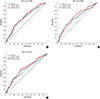
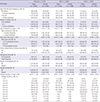
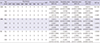
The characteristics of major risk factors from the trial set of the SeBCS are summarized in Table 1. Breast-feeding per child has been found to reduce the breast cancer risk, but it is a controversial issue because of the different results among the subjects with differing age groups, control characteristics and yearly trends from 1994 to 2007. Risk factors, such as smoking, postmenopausal hormonal replacement therapy, non-steroidal anti-inflammatory drug use, oral contraceptives and ionizing radiation, were not associated with the risk factors of breast cancer, but must be further evaluated among Koreans. Finally, nine risk factors were observed to be statistically correlated with age in Korean women. The maximum AUCs by three classifier algorithms (SVM, ANN, and BN) and three age division models (ALL, U50, and O50) using specific risk factor combinations are shown in Table 2. The SVM-O50 model produced the highest AUC of 0.6415 among all of the combinations. The O50 models resulted in higher values than those of the other age division models; the AUC values from SVM, ANN, and BN were 0.6415, 0.6383, and 0.6290, respectively. The AUC values for ALL models were 0.6213, 0.6173, and 0.6101, respectively. U50 models resulted in lower values than those of the other age division models; 0.6076, 0.6060, and 0.6027, respectively. All models that were performed for one thousand iterations were demonstrated as normal distribution by Shapiro-Wilk Test (27). A comparison of statistical significance based on the classification algorithms, one-way Analysis Of Variance (ANOVA) of which significance level was set to be 0.05, was conducted for three age groups: ALL (SVM-ANN-BN), U50 (SVM-ANN-BN) and O50 (SVM-ANN-BN) using a SPSS software (IBM Corporation, Armonk, NY, USA). As a result, significance probabilities for the 'Test of Homogeneity of Variances' were estimated as 0.641 (ALL age group), 0.284 (U50 age group) and 0.704 (O50 age group), respectively, which means that the hypothesis for homogeneity of variances is satisfied. The P values, which were obtained by ANOVA, were indicated as '<0.001' for all age groups. This result stands for the fact that each model has not the same mean value. In addition, there was a significant difference founded by the Tukey's Honestly Significant Difference in the most of results (Multiple comparisons: P<0.05), except for the case of U50 (ANN-BN), whose significance probability was 0.278. Based on the above values, it was demonstrated that the values from SVM were highest, the values from ANN were second highest, and the values from BN were lowest. The corresponding ROC curves for the maximum AUC achieved in each method are presented in Fig. 4. The SVM algorithm provided the highest AUCs of the all-age division models.
Maximum accuracy was acquired from each ROC analysis by using the optimal combinations of risk factors that achieved the highest AUCs in Table 2. The maximum sensitivity and specificity were attained using the threshold that achieved the maximum accuracy. In contrast to the AUC results, the highest accuracy was achieved in ANN-O50 (0.6230). In the other age division models, ANN resulted in higher accuracy than the other classification algorithms. The highest sensitivity and specificity were observed in BN-U50 (0.6192) and BN-O50 (0.6833), respectively.
The single iterative calculation times are shown in Table 2. The calculation measurements were mainly influenced by the number of participating subjects. The ALL models required more calculation time than the other age division models, U50 and O50, because the subjects of the ALL models (n=4,574) consisted of the sum of the U50 models (n=2,622) and the O50 models (n=1,952). For example, to perform a single iterative calculation, ANN-ALL, ANN-U50, and ANN-O50 required 9.9536 s, 5.4916 s, and 3.9561 s, respectively. The ANN-ALL model required approximately twice as long a calculation time as that of ANN-U50 or ANN-O50. Similar results were obtained using the BN methods. In particular, the SVM methods were more influenced by the number of subjects than the other classification algorithms. The calculation time of the SVM algorithm was notably longer than the other classification algorithms, and the SVM-ALL model required a three-to-four times longer calculation time than either the SVM-U50 or SVM-O50 models.
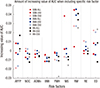
The contribution of a specific risk factor on the AUC was demonstrated by the amount of increased AUC in the case of including the specific risk factor compared with that when the specific risk factor was not included in the risk factor selection as shown in Fig. 5. RM had the greatest effect on increasing the AUC among all risk factors. NOC, AOMn, BMI, MS, and RE had no observable effect on increasing the AUC. FMH, ED, and AFFP exhibited different results depending on the classifier algorithms and age division models. FMH exhibited the greatest effect on decreasing the AUC of the BN-O50 model. ED exhibited only negative effects on the AUCs of the BN-U50 models for all of the classification algorithms, and AFFP exhibited a remarkable negative effect on the AUCs of the SVM-O50 and ANN-O50 models.
DISCUSSION
The discrimination of breast cancer for Korean women was performed with computational classifier algorithms based on an epidemiological data set and demonstrated that the SVM algorithm produced the best AUC among the three classifier algorithms. In the SVM-O50 model, an AUC of 0.6415 was achieved when the ED risk factor was excluded. Although ED negatively affected AUC in this model, the combinations that included most of the other risk factors generally elevated the AUC and accuracy. RM contributed to a remarkable increase in the AUC compared with other risk factors. Furthermore, RM was included in all the optimal combinations of risk factors according to the classification methods and age division models. These observations imply that RM is the most important risk factor in in creasing the prediction performance of breast cancer discrimination. ED and AFFP contributed considerably to increasing the performance as well. These two risk factors are commonly related to the effect of the estrogen hormone. This observation of the connection to estrogen is in accordance with previous literature (28). Although certain risk factors are viewed as negative contributions to the AUC, the optimal AUC was achieved when most of the risk factors considered in this study were included. Therefore, although a certain risk factor may have an undesirable effect, the combination of risk factors provides a synergistic effect that increases the AUC. This observation implies that when the AUC is not improved by a particular risk factor, combining several risk factors and using a proper classifier algorithm can improve the prediction validity. The AUC value between 0.6027 and 0.6415 seems lower considering other studies, but the proposed method in this research is a prediction technique without using any clinical data while others are mainly dependent on clinical data. Because of the fact that SVM is applied to epidemiological case-control data concerning the breast cancer, these AUC values are improved comparing with the conventional method, logistic regression. Therefore, the developed model in this study could be considered as an efficient, handy method in predicting breast cancer risk because the model is purely dependent on the survey questionnaire. The better results are expected when the genetic information, mammographic image, or biopsy are added to the model developed in this study.
The O50 model exhibited better performance than the other age division models. This result was due to a characteristic of our epidemiological data. Some risk factors considered in the classifiers were affected by age. For example, AFFP, NOC, MS, and ED might not yet be determined for the subjects in U50. Therefore, more ascertainable risk factors could be collected from O50.
O50 is also the lowest time-consuming age model, as indicated in Table 2. This result was due to a smaller sample size. The O50 dataset included only 1,952 subjects, whereas the U50 and ALL datasets included 2,622 and 4,574, respectively. Because the ALL models consisted of a large size of subjects, they required the longest computation time among all the classification methods.
Most of the previous breast cancer risk analysis studies were based on Western population data. These methods were inappropriate for Koreans because of the different characteristics of risk factors, in particular the lower incidence rates, different age-specific incidences, and different mortality patterns. Among the entire models, the highest AUC was achieved using the SVM method. We observed an even prediction validity with the AUC of 60%-64% compared with the AUC of 59%-64% achieved by logistic regression based on identical epidemiological data (29). In particular, the following models, SVM-U50, ANN-U50, BN-U50, and SVM-O50 produced a higher AUC than those of models using logistic regression analysis.
Classification algorithms for pattern recognition and discrimination problems are usually regarded as 'black-boxes'. Therefore, the consideration of all possible risk factors and transfer functions in an algorithm is a difficult and tremendously time-consuming process. Optimization of all of the possible approaches would take more than several months, even with high performance personal computers. However, after the final training of an algorithm with the optimal selection of risk factor combinations, the assessment of an individual woman would take under several seconds. For further enhancement of the classifier performance, ensemble methods using SVM, ANN, BN, and other classification algorithms could be employed. The main idea of the ensemble method is that the performance of combining the classifiers is superior to that of each individual classifier in a certain discrimination problem (30).
The expected benefits of the present method are described below. Only simple interviews or direct inputs of questionnaire regarding a subject's status are required to perform a discrimination of breast cancer risk. However, regular mammography inspections are required for the detection of a newly developed cancer. The proposed methodology does not determine the onset of breast cancer, which can be performed through mammographic diagnosis. However, it can encourage potential breast cancer-prone women to go the hospital for diagnostic tests. Therefore, the early diagnosis of breast cancer will be more effective, and the mortality rate of breast cancer will decrease. Additionally, if the present method is designed in the form of a web-based or smartphone application, women who want to know their own risk of breast cancer will be able to access this information easily in daily life.
 XML Download