

 PDF
PDF ePub
ePub Citation
 Print
Print


INTRODUCTION
Gliomas, which include astrocytic tumors, oligodendrogliomas, mixed oligoastrocytomas, and ependymomas, are the most common primary malignancy of the central nervous system (CNS) and account for 78% of cases (1, 2). A wide spectrum of clinical behavior occurs among individual patients within each tumor group. Although chemotherapy, radiation therapy, and surgery have been attempted, improvements in patient survival have been limited. From a therapeutic point of view, the differential diagnosis among these entities is of clinical importance to predict biological behavior and to determine the optimal treatment protocol. However, distinguishing glial subtypes based on nuclear and cellular morphology alone is subjective, with significant interobserver variability, even among highly experienced neuropathologists (3, 4). Recent studies have suggested that these variable prognoses can be partly explained by different molecular profiles, especially detecting chromosomes 1p and 19q (1p/19q) as a specific molecular signature strongly associated with an oligodendroglial phenotype and a favorable prognosis (5). The glial subtypes have been recently been shown to be mediated by a specific translocation (t[1;19][q10;p10]). The genetic characteristics, the 1p/19q codeletion, and epidermal growth-factor-receptor (EGFR) gene amplification are mutually exclusive in gliomas (6, 33).
Alpha internexin (INA) is a 66-kDa intermediate protein that maps to 10q24.33. It is a component of the primary neurofilament triplet proteins (NFTPs) of the cetral nervous system (CNS); a low-molecular-weight neurofilament subunit (68 kDa), middle-molecular-weight neurofilament subunit (160 kDa), and a high-molecular-weight neurofilament subunit (205 kDa). INA is also abundantly expressed in the peripheral nervous system. INA overexpression has been observed in neurodegeneration and neuronal cell death (7, 8). Ho and Liem (9) stated that the neurofilament-protein expression pattern is a good marker for identifying tumor cell origin and differentiation status. In recent studies, the relationship between tumor phenotype and genetic characteristics was examined based on a microarray and RNA extraction. Ducray et al. reported evidence of neuronal differentiation in oligodendrogliomas (ODGs) with a 1p/19q codeletion. In an immunohistochemical study, the most differentially expressed neuronal gene, INA, clearly distinguished the two groups of gliomas. That is, 1p/19q codeleted INA-expressing gliomas, and 1p/19q non-codeleted INA negative gliomas (10, 11). The aim of this study was to verify whether INA is strongly related to chromosomal 1p/19q status in a large series of glioblastomas (GBMs) and ODGs. The prognostic value of INA for gliomas was also evaluated.
MATERIALS AND METHODS
Patients and Samples
Cases were selected from pathologically proven low grade ODGs, anaplastic ODGs, and GBMs operated on at Seoul National University Hospital, Republic of Korea. A total of 230 patients who underwent a neurosurgical operation from July 1995 to June 2008 were included when complete clinical information and tissue paraffin blocks were available. Tumor histology was classified according to the 2007 WHO classification by neuropathologists (JH Suh and SH Park). Clinical information was extracted from the medical records, which showed secondary operations for recurrence, chemoradiation therapy status, and follow-up data.
Tissue microarrays and immunohistochemical staining
Each tumor tissue sample was fixed with formalin and embedded in paraffin. Representative paraffin blocks were selected and mounted on slides with hematoxylin and eosin (H&E) staining before they were prepared for the tissue microarray. Cores from representative areas of each tumor were marked on both an H&E stained tissue section and an original donor block. Three 2-mm diameter tissue cores were extracted from the marked area of each donor block and placed in 60 tissue cores. A 4-µm thick section was cut from each array block.
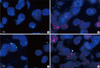
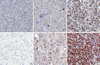
Immunohistochemical INA studies were conducted with antibodies purchased from Leica Microsystems (Newcastle, UK). Pre-treatment for antigen retrieval before staining with antibody was performed by autoclaving in 0.01 M citrate buffer, pH 6.0 and then placing the sections in 0.5% hydrogen peroxide/methanol for 10 min. Immunostaining was performed with an automated immunostainer, Dako TechMateTM 500 plus (Glostrup, Denmark) with INA antibody (1:200). Slides were incubated in diaminobenzidine, which served as the chromogen to visualize immunostaining. Finally, the slides were counterstained with Meyer's hematoxylin.
We developed criteria for positive staining using strongly positive (2+) and weakly positive (1+) grading. Strong positivity was defined when positive tumor cells constituted more than 10% of all tumor cells in each core. Weak positivity was defined when positive tumor cells were confined to less than 10% of all tumor cells in the same field. Negative staining indicated that none of tumor cells was completely stained.
Fluorescence in situ hybridization (FISH)
The same tissue arrays were subjected to FISH analysis, which was performed in the following manner. Briefly, tumor sections were deparaffinized by dehydration and microwaving in citrate buffer, pH 6.0, for 10 min, digested in pepsin solution (4 mg/mL in 0.2 N NaCl, pH 1.5) for 15 min at 37℃, rinsed in 2 × standard saline citrate (SSC) at room temperature for 5 min, and air dried. Dual-probe hybridization was performed for the 1p deletion analysis using a Spectrum Orange-labeled, locus-specific 1p probe and a Spectrum Green-labeled 1q probe (Vysis, Downers Grove, IL, USA). Similarly, a Spectrum Orange-labeled, locusspecific 19q probe and a Spectrum Green-labeled 19p probe (Vysis) were used for the 19q deletion analysis. Probes and target DNA were denatured simultaneously in a 73℃ oven for 5 min, followed by an overnight incubation at 37℃. Slides were then washed in 1.5 M urea/0.1 × SSC at 45℃ for 30 min and in 2 × SSC at room temperature for 2 min. After washing, the digoxigenin-labeled probes were detected using a rhodamine detection kit (Oncor, Gaithersburg, MD, USA). Nuclei were counterstained with 4, 6-diamidino-2-phenylindole and the antifade compound p-phenylenediamine. A Zeiss (Thornwood, NY, USA) Axioplan microscope equipped with a triple-pass filter (DAPI/FITC/orange; Vysis) was used to assess the number of FISH signals for each locus-specific FISH probe. Signals for each probe were counted under a microscope equipped with a triple-pass filter (DAPI/FITC/orange; Vysis) and an oil immersion objective. Approximately 60 non-overlapping nuclei were enumerated per hybridization.
To evaluate EGFR gene status, dual-color FISH analysis using the LSR EGFR Spectrum Orange/CEP 7 Spectrum Green Probe (Vysis) was performed in other paraffin sections from the same tissue array. Briefly, paraffin sections were deparaffinized, dehydrated in graded ethanol, and air dried. The sections were digested with protease K (0.5 mg/mL) at 37℃ for 28 min. The slides were denatured at 76℃ for 8 min, with an overnight incubation at 37℃ in the HYBriteTM hybridization chamber (Vysis). Simultaneous probe/specimen denaturation at 76℃ for 8 min was processed before hybridization. Slides were hybridized overnight at 37℃ and washed in 2 × SSC/0.3% NP40 at 73℃ for 5 min. The nuclei were counterstained with DAPI (1,000 ng DAPI/mL in antifade mounting solution; Vysis). The EGFR gene copy number was counted in 100 non-overlapping tumor cell nuclei in the paraffin sections. The mean signal number for the EGFR gene and CEP 7 was calculated for each case, followed by calculating the EGFR gene/CEP 7 ratios. The EGFR gene was considered amplified in individual cells when the EGFR control signal ratio was greater than 2. When the number of EGFR gene copies was more than 4 in at least 40% of tumor cells, high polysomy of the EGFR gene was recognized by applying a Colorado scoring system, as previously described (12).
Statistical analysis
Correlations between INA and 1p/19q codeletion status were determined using Fisher's exact test or Pearson's chi square test. The Kaplan-Meier and log-rank methods were used to assess overall survival (OS) and progression-free survival (PFS) with compared strata. A Cox-regression test was used for the multivariate analysis. Statistical significance was defined as P < 0.05. The statistical analysis was performed with SPSS version 17.0 (Systat, Chicago, IL, USA).
RESULTS
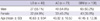
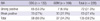
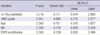
A total of 230 consecutive GBMs and ODGs, including anaplastic and low-grade tumors, were examined. The mean ages with standard deviations and gender compositions of patients are shown in Table 1. All tumors showed a male predominance (1.2: 1 in ODGs, 1.5: 1 in GBMs). The mean ages were 42.2 yr old and 47.5-yr old for the ODGs and GBMs, respectively.
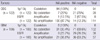
Immunohistochemical staining and FISH were undertaken in 228 of the 230 studied cases; two cases were excluded because the available core was too small to analyze the immunohistochemical staining or we were unable to determine the FISH signal count. The results of the FISH and INA immunohistochemical staining are shown in Tables 2 and 3.
In the ODG group, 1p/19q codeletion was detected in 77% (97/122), and EGFR gene amplification in 6.6% (8/122) of cases, which were anaplastic. The 1p/19q codeletion was seen in six of 108 cases (5.5%) in the GBM group. In contrast, EGFR gene amplification occurred in 32 cases (29.6%) (Fig. 1).
INA expression was found in 80.3% and 34.9% of ODGs and GBMs, respectively. Among them, strong INA expression was found in 53.3% and 6.5% of the ODG and GBM groups, respectively. Of the ODGs, all of the cases that did not express INA (INA negative) were the anaplastic type (Fig. 2).
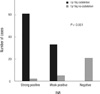
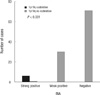
A high correlation between INA and 1p/19q codeletion in the ODG group was observed (P < 0.001) (Fig. 3). INA was detected in 100% (100/100 cases, 67 strong, 36 weak) of 1p/19q codeleted ODGs and GBMs compared with 29.2% (38/130 cases; three strong, 35 weak) in the gliomas without an 1p/19q codeletion. INA was also highly correlated with 1p/19q codeletion in the GBM group (P < 0.001) (Fig. 4).
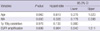
The specificity and sensitivity of INA expression for 1p/19q codeletion was 70.8% and 100%, respectively, with a 72.5% positive predictive value and a 29.2% negative predictive value for all tumors, including 122 ODGs and 108 GBMs. However, INA was also detected in 25% (7/28; two strong, five weak) and 30.4% (31/102, one strong, 30 weak) of the ODGs and GBMs without 1p/19q codeletion, respectively. Therefore, INA expression specificity for 1p/19q codeletion was 75% in ODGs, with a sensitivity of 100%, a positive predictive value of 91.3%, and a negative predictive value of 25%. Also, as in the GBMs, INA expression specificity for 1p/19q codeletion was 69.6%, sensitivity was 100%, positive predictive value was 16.2%, and negative predictive value was 30.4% (Table 4).
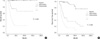
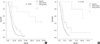
A Kaplan-Meier survival analysis revealed that INA expression was correlated with better PFS (28.9 vs 154.4 months [P = 0.001]) and OS (37.8 vs 172.3 months [P = 0.0001]) in all 230 tumors (Fig. 5). Patients in the GBM group with INA expression had significantly better OS (patients with strong INA expression: 116.3 months, patients with weak INA expression: 20.2 months) than patients with INA immunonegativity (14.6 months) (P < 0.001). PFS was also correlated with the INA immunohistochemical findings (Fig. 6). PFS was significantly correlated with INA positivity (P = 0.02) in the ODG group (Fig. 7A). A strong positive INA finding was better for PFS (162.7 months) than was weak INA positivity (76.6 months) and INA-negative staining (67.8 months) (Fig. 7B).
The median OS of patients with ODGs was calculated with a life table because only seven of 122 patients (5.7%) died from the disease, of whom three (2.4%) showed weak INA expression, and the remaining four cases were INA negative. The median OS of patients expressing INA (175 months) was significantly longer than that of INA negative cases (95.3 months, P = 0.01) (Fig. 7A).
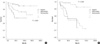
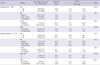
A 1p/19q codeletion was strongly related to better OS in patients with GBMs (103.5 vs 16.9 months, P = 0.001) and better PFS in those with ODGs (142.7 vs 94.5 months, P = 0.017). In contrast, EGFR amplification showed a significantly poor OS in the GBM (15 vs 22.9 months, P = 0.030) and poor PFS in the ODG (26.8 vs 112.8 months, P < 0.001) groups. The strongest prognostic factor was age in both the GBM and ODG groups. In the GBM group, patients less than 50 yr of age had a significantly longer OS (15.8 vs 23.6 months, P = 0.014) than did those over 50 yr, but PFS was not significantly longer (33.9 vs 27.9 months, P = 0.096, data not shown) than that for age over 50-yr. No difference in PFS by the age criteria of 50 yr was found in the ODG group (97.5 vs 127.9 months, P = 0.207) (Table 5).
A multivariate analysis was conducted with age, INA, 1p/19q codeletion status, EGFR status, and WHO grade (especially in the oligodendroglioma group) (Tables 6 and 7). INA was significantly related to longer OS in the GBM group when other factors such as age, 1p 19q codeletion status, and EGFR amplification were considered. INA and patient age were significantly related to a longer PFS in the ODG group.
DISCUSSION
For the prognostic and predictive values of the adult gliomas, oligodendroglial phenotype is sufficient to determine a treatment option (13). The oligodendroglial phenotype indicates a better prognosis and more chemosensitivity than astrocytic tumors, but the histological diagnosis is subjective and suffers from interobserver variability and discrepancies (2, 14). 1p/19q codeletion status, which is related to an unbalanced t(1;19) (q10;p10) translocation, is mutually exclusive with EGFR gene amplification (15) and is a diagnostic, prognostic, and predictive marker for ODGs. In our study, none of the 1p/19q codeleted cases showed EGFR amplification, and all cases revealed that EGFR amplification was not consistent with 1p/19q codeletion. However, either 1p or 19q deleted cases were present among the EGFR amplified cases; two 19q-deleted and one 1p-deleted GBM, and two 1p-deleted and one 19q-deleted ODG. In our series, patients with a 1p/19q codeletion had a better prognosis than did patients with the 1p/19q non-codeletion whether the tumors were oligodendroglial or astrocytic. 1p and 19q deletions are common in ODGs (75%-85%), but not in GBMs, which have a lower frequency of 1p/19q codeletion (5%-10%). In contrast, EGFR amplification is common in GBMs (25%-35%), but low in ODGs (6.6%) (16, 17). Comparative genomic hybridization array analysis (14, 18), loss of heterogeneity analysis, multiplex ligation-dependent probe amplification (19, 20), and FISH are available to identify a 1p/19q deletion (2, 6), but they have been rarely performed in clinical practice. 1p/19q codeleted ODGs do not grow well, so it is unrealistic to perform a karyotype. Moreover, these are complex, sophisticated and expensive techniques, and all have limitations, such as contamination with normal cells or poor sensitivity and specificity (21, 22). Therefore, diagnostic, prognostic, and predictive markers are needed that can replace 1p/19q deletion INA has been mainly studied in the field of neurodegenerative diseases, which has implications for INA overexpression. INA overexpression leads to the accumulation of neurofilaments. Recently, the pathophysiology of INA in brain tumors is beginning to be known as a neurodegenerative disease. INA is helpful to distinguish neuroblastomas from other small round cell tumors (23). INA is expressed in the majority of medulloblastomas and atypical teratoid-rhabdoid tumors, indicating that these primitive tumors usually exhibit neuronal differentiation (24). Ikeda and Yoshimoto showed that metaplastic expression of INA in an anaplastic meningioma, resulted in a decrease of epithelial membrane antigen expression and loss of the typical architecture of the meningioma (30). Previous genetic profiling studies of GBMs and ODGs have suggested that INA expression could be a surrogate marker for 1p/19q codeletion in gliomas because they are well correlated, but other studies indicate that INA plays the role of helping to define more homogeneous groups of patients (25). We were unable to find any studies about the relationship between INA and 1p/19q codeletion. In our study, a clear correlation was observed between INA and 1p/19q codeletion in 230 cases of ODGs and GBMs. In addition, INA was well correlated with better survival rate and inversely correlated with EGFR amplification, which corresponded with previous studies (10). Therefore, INA is a good prognostic marker and even more an excellent discriminating factor for long-term survivors with GBM. As we know, 3 to 5% of the patients with GBM survive for more than 3 yr, who are referred to as long term survivors (31). The exact clinical and molecular genetic factors that bring to such long-term survival are still unknown. However, younger age and a high Karnofsky performance scale (KPS) are considered favorable prognostic factors (32). If they live longer than 5 yr, they eventually fully recovered from GBM. Evaluating INA expression rather than 1p/19q codeletion can be done quickly from a simple biopsy, is inexpensive, and does not require any special equipment. Our data revealed that the sensitivity of INA expression for 1p/19q codeletion in both ODGs and GBMs was 100%. When INA was strongly positive in tumor cells (more than 10% of the cells expressed INA), only two cases were absent the 1p/19q codeletion of 65 INA strongly positive ODGs. So, expression of INA indicated a 96.9% chance of a 1p/19q codeletion in the ODG. Only one case in the GBM group showed no 1p/19q codeletion in seven INA positive cases, which represents an 85.7% chance of a 1p/19q codeletion in that group. The 16.2% positive predictive value in GBMs was lower than that of ODGs (91.3%) because only six cases revealed strong INA positivity in immunostaining. These results suggest that INA expression highly predicted the presence of 1p/19q codeletion, but did not predict the absence of a 1p/19q codeletion. The expression of proneural genes characterizes a group of malignant gliomas with a better prognosis than the "mesenchymal" subtype (26). In our study, the survival analysis based on 1p/19q codeletion and EGFR amplification status agreed with previously reported results (27, 28).
INA expression was found to be significantly more frequent in ODGs than in GBMs (11), which were also reproduced in our study. Additionally, our results revealed that INA-positive GBMs had a better OS and PFS and that INA expressing ODGs had a better PFS than did INA-negative gliomas (10, 11). Moreover, INA was significant in the multivariate analysis controlling for factors such as age, 1p/19q status, EGFR amplification, and the WHO grading system. As we could not find a glioma study in the English literature with a multivariate analysis including INA expression with other factors, the present study could be novel.
INA expression in both ODGs and GBMs suggests that the progenitor cells of both neuron and oligodendrocyte lineages, so neuronal and glial differentiation could be implicated in gliomagenesis (29). Because the process of the transition from nonneoplastic glial cells to GBM is unknown, more in-depth studies are required for a clear understanding of gliomagenesis. However, INA is not expressed in normal glial or neuronal cells but in axons, suggesting that INA expression in glial tumors should be considered an abnormal feature.
A reasonable positive cut-off value for the immunohistochemical analysis of INA staining is required in a future study. Previous studies set the cut off at 10%, but more variable cut-off values should be attempted.
We showed that INA immunoexpression could be a possible candidate as a surrogate marker for 1p/19q codeletion, good prognosis and long term survival. Further perspective studies are needed to identify INA as a prognostic and predictive factor.

 XML Download