

 PDF
PDF ePub
ePub Citation
 Print
Print


INTRODUCTION
The widespread use of multiparametric flow cytometry (MFC) and the increased availability of reagents for the surface and intracellular staining of specific antigens have provided insights into the pathophysiology of plasma cell myeloma (PCM) that have improved our diagnostic and prognostic capabilities (1-3). Indeed, increasing evidence now exists in the literature for the potential clinical utility of MFC to immunophenotype plasma cells for the diagnosis of PCM or other plasma cell disorders (4-15).
One key biological issue that remains to be addressed is how to use the number of infiltrating plasma cells to accurately measure the tumor burden during the initial staging of PCM patients. Recently, the European Myeloma Network published recommendations regarding the use of MFC to identify PCM markers and unequivocally identify plasma cells among other hematopoietic cells, as well as how to detect aberrant phenotypes and distinguish normal cells from neoplastic plasma cells (NeoPCs) (16). However, no consensus has thus far been reached to quantitate the plasma cell burden. Consequently, the management of patients with plasma cell disorders is still far from becoming a routine practice in many clinical laboratories, despite the demonstrated relevance of using MFC to evaluate PCM.
Here, we report the results of a recommended analytic strategy that was performed on newly diagnosed PCM patients in a single center of Korea. The aim of the current study was to quantitate the proportion of NeoPCs within the overall bone marrow plasma cell (BMPC) compartment using MFC in order to estimate tumor burden, and to compare the prevalence of patients with PCM and those with non-plasma cell disorders. In particular, we sought to determine whether the proportion of NeoPCs/BMPCs could be used to predict the clinical outcomes of PCM patients. In addition, we also assessed the prognostic value of aberrant antigenic expression in myeloma cells.
MATERIALS AND METHODS
Patients and samples
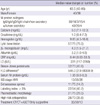
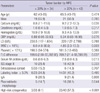
Diagnostic bone marrow (BM) samples were analyzed from 109 patients with PCM (n = 76) or reactive plasmacytosis (n = 33) between November, 2008 and April, 2010, at the Asan Medical Center (Seoul, Korea). A diagnosis of PCM was based on the criteria of the International Myeloma Working Group (17). Reactive plasmacytosis was defined as having a percentage of BMPCs more than 3.0% without evidence of a plasma cell disorder. The conditions accompanying reactive plasmacytosis included non-Hodgkin's lymphoma, leukemia, myelodysplastic syndrome, and carcinoma. Patients with PCM included 40 men and 36 women (median age: 63.5 yr) and patients with reactive plasmacytosis included 20 men and 13 women (median age: 53 yr). Table 1 shows the patient characteristics. At the time of writing, 15 patients (19.7%) had died. The median overall survival (OS) was 20.55 months (95% CI, 0.1-43.1 months), and a median follow-up period of 25.6 months for the survivors.
Cytological examination by light microscopy
BM was aspirated by iliac puncture and smears were directly prepared, air dried, and routinely stained using the Wright-Giemsa procedure, according to standard protocols. Classical differential counts of the BM smears were performed by a hematopathologist using light microscopy (LM) in order to identify plasma cells from a minimum of 500 consecutively nucleated cells in each preparation.
MFC evaluation
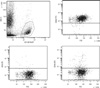
Immunophenotypic studies were performed within 24 hr of sample delivery to the laboratory in order to diagnose the BM aspirates. Immunophenotypic evaluation was performed using a flow cytometer (FACS Canto; BD Biosciences, Palo Alto, CA, USA). Whole erythrocyte-lysed BM samples were stained using the following 4-color surface combinations (FITC/PE/PerCP/APC): CD38/CD138/-/CD45, CD56/CD20/CD138/CD19, and CD27/CD28/CD138/CD117. To assess the surface antigens, an aliquot of approximately 1 × 10⁶ cells was labeled with pretitrated volumes of preconjugated monoclonal antibodies in accordance with the manufacturer's recommendations (BD Biosciences). The cells were then washed with phosphate buffered saline and suspended in 1% paraformaldehyde. Acquisition was performed with at least 0.5-1 × 10⁵ events per tube. Analyses were carried out using the FACS Diva software (BD Biosciences). Irrelevant isotype-matched antibodies were used to determine the background fluorescence. Plasma cells were counted based on the expression of CD138 and CD38. NeoPCs were categorized as having negative CD19 expression, weak or negative CD45 expression, or positive CD56 expression (Fig. 1). Tumor burden (%) was calculated as: BMPC count measured by LM (%) × NeoPCs/BMPCs (as measured by MFC).
Aberrant immunophenotypes were defined to identify immunophenotypic criteria that could be used to differentiate reactive forms of cells from NeoPCs. This included the expression of antigens not normally expressed (CD20, CD56, CD28, and CD117) and a lack of antigens that are normally expressed (CD19 and CD27) by plasma cells in patients with reactive conditions. In patients with PCM, the expression of an antigen was considered positive when ≥ 20% of the plasma cells expressed it at the time of diagnosis.
Comparison of patient characteristics
To evaluate the clinical usefulness of plasma cell immunoprofiling, the clinical and laboratory characteristics determined at diagnosis were compared according to the percentage of NeoPCs. Data collected from each patient's medical records included demographic data, the paraprotein isotype, various clinical and laboratory parameters at diagnosis, OS and progression-free survival (PFS). The reviewed laboratory parameters included serum calcium, serum creatinine, hemoglobin, serum M-protein, serum β2-microglobulin, serum albumin, serum C-reactive protein (CRP), serum lactate dehydrogenase (LD), white blood cell (WBC) count, platelet count, the presence of Bence-Jones proteinuria, differences between the involved/uninvolved free light chains (FLC) that were present in serum, plasma cell labeling index, BMPC count (determined by LM), cell type of plasma cells (plasmablastic vs plasmacytic), and cytogenetics. The identification of high-risk cytogenetic abnormalities was based on the Mayo risk stratification criteria for myeloma (17). The reviewed clinical data included the presence of lytic bone lesions, extraosseous spread, clinical stage, and therapeutic modalities. Clinical staging for the PCM patients was performed according to the International Staging System (ISS), which is the most widely used method of assessing prognosis (17). Chromosome analysis of the BM aspirates was also performed at diagnosis.
Statistical analyses
Statistical analyses were performed using MedCalc (version 12.3.0.0; MedCalc Software, Mariakerke, Belgium). Differences between nominal variables were evaluated using the chi-square test or Fisher's exact test, and differences between continuous variables were evaluated using the Mann-Whitney U test. OS was measured from the diagnosis of PCM until death. PFS was measured from the start of treatment until disease progression or death (regardless of the cause of death), whichever came first. Survival curves were plotted according to the Kaplan-Meier method and compared using the log-rank test. Multivariate analysis was performed using Cox modeling. A two-sided P value of < 0.05 was considered statistically significant.
RESULTS
Quantification of plasma cells and NeoPCs by MFC
Across the total cohort, we identified a median plasma cell percentage of 7.9% (range: 0.2%-83.5%) using MFC analysis, and 15.0% (range: 3.0%-89.8%) using LM analysis, with a significant correlation observed between these 2 techniques (r = 0.806, P < 0.001). In patients with reactive plasmacytosis, the median plasma cell percentages determined using MFC and LM analysis were 1.6% (range: 0.2%-6.5%) and 5.1% (range: 3.0%-31.4%), respectively, whereas in patients with PCM, the percentages were 16.4% (range: 0.9%-83.5%) and 31.6% (range: 4.8%-89.8%), respectively.
The median tumor burden, based on the number of NeoPCs/BMPCs was 25.2% (range: 0.7%-89.7%) in PCM patients and 0% (range: 0%-0.1%) in patients with reactive plasmacytosis. The difference in tumor burden between the two patient groups was statistically significant (P < 0.001). Among PCM patients, 36 patients (47.4%) demonstrated a high tumor burden (> 30%) whereas 19 patients (25.0%) demonstrated a low tumor burden (< 10%). Among those 19 patients, 11 patients (14.5%) demonstrated very low tumor burden (< 5%).
Frequency of aberrant immunophenotype in PCM patients
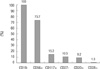
The plasma cells of the patients with reactive plasmacytosis demonstrated a normal immunophenotypic patterns (CD138+, CD19+, CD45+, CD27+, CD56-, and CD20-). For PCM patients, the overexpression of CD56, a marker involved in anchoring plasma cells to stromal structures, was found in 73.7% of cases (56 of 76). CD117, a tyrosine kinase receptor, and CD20, an antigen associated with the early stages of B-cell maturation, were detected in 15.2% (5 of 33) and 9.2% (7 of 76) of cases, respectively. However, CD28, an antigen associated with activated T lymphocytes, was present in only 1.3% (1 of 76) of patients. A lack of CD27 expression, an antigen involved in the differentiation of mature B cells into plasma cells, was found in 10.5% (8 of 76) of cases. The underexpression of CD19, an antigen present on all B cells and most normal plasma cells, was detected in every patient (Fig. 2).
Impact of known parameters and MFC results on patients' prognosis
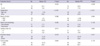
The results of the Kaplan-Meier analysis indicated that patients with ISS stage II-III demonstrated significantly shorter OS times than patients with ISS stage I (P = 0.033; Table 2). Similarly, patients with ISS stage II-III demonstrated shorter PFS times than those with ISS stage I. However, the difference was not statistically significant according to the Kaplan-Meier analysis. Patients with high-risk cytogenetics, based on the Mayo risk stratification criteria for myeloma, also demonstrated significantly shorter OS and PFS times than those without (P < 0.001 and < 0.001, respectively). The Kaplan-Meier analysis revealed that other parameters, such as LD, IgA isotype, plasmablastic histology, and labeling index, did not influence OS or PFS, although patients with factors suggestive of adverse prognosis also demonstrated shorter survival than those without these factors. One exception was that patients with the IgA isotype demonstrated significantly shorter OS than those with other isotypes (P = 0.033). According to the multivariate analysis, only high-risk cytogenetics was an independent prognostic factor associated with both decreased OS and PFS (hazard ratios, 5.9 and 5.5, P = 0.001 and < 0.001, respectively).
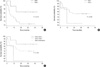
With regard to the MFC results, tumor burden was divided into two groups (low burden and high burden) and evaluated until a significant difference in OS and PFS was observed. Unfortunately, the difference was not statistically significant at any cutoff point identified by the Kaplan-Meier analysis. Instead, patients with > 20% tumor burden demonstrated shorter OS and PFS times than those with tumor burden of ≤ 20% (medians of 18.15 vs 23.6 months for OS and 18.6 vs 25.4 months for PFS, respectively; Table 2). Patients with CD56 overexpression demonstrated shorter OS and PFS times than those without overexpression (medians of 18.85 vs 25.9 months for OS and 20.55 vs 27.2 months for PFS, respectively), although the differences were not statistically significant according to the Kaplan-Meier analysis (P = 0.219 and 0.513 for OS and PFS, respectively) (Fig. 3A). Patients with CD27 underexpression also demonstrated shorter OS and PFS times than those with CD27 overexpression (medians of 1.85 vs 23.55 months for OS and 13.7 vs 24.6 months for PFS, respectively), but, again, these differences were not statistically significant (P = 0.246 and 0.245 for OS and PFS, respectively) (Fig. 3B). A combined analysis of CD56 and CD27 expression demonstrated better discrimination between longer and shorter survival times, although the Kaplan-Meier analysis did not indicate an overall statistical significance (P = 0.102) (Fig. 3C). However, CD56+/CD27- patients demonstrated significantly shorter OS times than CD56-/CD27+ patients (medians of 5.35 vs 26.45 months, respectively; P = 0.045). Patients with other combinations (CD56+/CD27+ or CD56-/CD27-) demonstrated intermediate survival times (Fig. 3C).
Relationship between the MFC results and disease characteristics
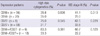
Because the NeoPCs/BMPCs ratio reflects the tumor burden for the patients with PCM, we sought to compare the disease characteristics of the two patient groups with high and low tumor burdens, respectively. A tumor burden of > 20% was associated with a significantly higher frequency of high-risk cytogenetics, lower hemoglobin level, lower WBC count, higher serum M-protein level, higher FLC difference, and higher calcium level (Table 3). All of these features indicate the poor prognosis of PCM. The most significant association was observed between high tumor burden, as determined using the MFC assay, and high-risk cytogenetics (P < 0.001).
The frequencies of high-risk cytogenetics and ISS stage III were not associated with CD56 expression. However, patients with CD27 underexpression were significantly associated with a higher frequency of high-risk cytogenetics (P = 0.045), but not ISS stage III. This association with high-risk cytogenetics was also observed in patients with CD56+/CD27-, although the statistical power was marginal (P = 0.061; Table 4).
DISCUSSION
The present data demonstrate the diagnostic and clinical utility of the characterization and quantification of NeoPCs by MFC for the assessment of patients with PCM. A high level of tumor burden, as determined by the ratio of NeoPCs/BMPCs, was associated with disease characteristics that imply a poor clinical outcome. In addition, CD27 underexpression or a combined pattern of CD56 and CD27 expression seemed to demonstrate a potential prognostic impact and were associated with high-risk cytogenetics, an independent prognostic factor associated with shorter survival times.
Over the past 10 yr, MFC immunophenotyping has been increasingly used for the diagnostic characterization and prognostic stratification of patients with PCM. However, we still depend on morphological features and immunohistochemical patterns to identify NeoPCs. While MFC has become part of the routine diagnostics for most hematologic malignancies in Korea, the use of MFC for the clinical management of PCM patients is not widespread. This is mainly attributed to the variable results observed for clinical correlations between PCM and the designated immunophenotypes of NeoPCs. Considering that MFC immunophenotyping can provide accurate assessment of the expression levels of multiple markers in thousands of plasma cells and allows the clear discrimination between clonal and reactive plasma cells, the application of MFC for the evaluation of PCM patients in Korea is vital.
In our study, the quantification of NeoPCs by MFC allowed us to discriminate between PCM and reactive plasmacytosis, with a high statistical power. It is normal for the BM aspirates from patients with reactive plasmacytosis to contain less NeoPCs as compared with that from PCM patients. Occasionally, however, extensive plasmacytosis may be indistinguishable from low-grade PCM in terms of morphology or the extent of plasma cell proliferation without using the M-protein analysis. Among our patients with reactive plasmacytosis, 4 patients were identified by LM examination as having more than 10% of plasma cells in their BM aspirate. Despite the high proportion of BMPCs identified in this subset of patients, which was above the diagnostic level for PCM, the amount of tumor burden as measured by MFC was definitely minimal. This finding strongly suggests that flow cytometric quantification of NeoPCs in PCM patients is clinically useful as a diagnostic marker and as a marker for estimating tumor burden in PCM patients.
Recently, risk stratification parameters for PCM were suggested, including ISS stage, cytogenetics, fluorescence in situ hybridization, LD, IgA isotype, plasmablastic histology, and labeling index (18). In addition to well-established prognostic factors, here we present tumor burden, as calculated from the NeoPCs/BMPCs ratio, as a potential prognostic marker. Although its statistical significance for predicting patient survival was insignificant, tumor burden of more than 20% was associated with various prognostic factors that indicate poor clinical outcome, including high-risk cytogenetics, low hemoglobin level, low WBC count, high serum M-protein level, high FLC difference, and high calcium level. Among these factors, the association with high-risk cytogenetics was the most significant. High-risk cytogenetics was an independent prognostic factor that was associated with adverse clinical outcomes in this study. This association strongly suggests the clinical significance of tumor burden as determined using MFC as a prognostic marker.
A few previous studies have described the clinical usefulness of an approach like this, i.e., estimating tumor burden rather than studying specific antigen expression levels. Pérez-Persona et al. (6) investigated aberrant plasma cells/BMPCs as a marker for the risk of progression in 500 consecutive patients with monoclonal gammopathy of uncertain significance (MGUS) or smoldering multiple myeloma (SMM). Patients with a marked predominance of aberrant plasma cells/BMPCs (≥ 95%) at diagnosis demonstrated significantly higher risks of progression in both MGUS and SMM. The multivariate analysis of PFS indicated aberrant plasma cells/BMPCs ≥ 95% as the most important independent variable. Paiva et al. (12) reported the prognostic impact of the presence of > 5% normal plasma cells/BMPCs at diagnosis in a large series of symptomatic PCM patients. Patients with symptomatic PCM and > 5% normal plasma cells/BMPCs at diagnosis demonstrated a unique signature that was characterized by high hemoglobin levels, low levels of BMPCs, low levels of M-protein, low frequency of immune paresis, and low frequency of high-risk cytogenetic abnormalities. In addition, this subgroup of patients also demonstrated a greater response rate to autologous stem cell transplantation and significantly longer OS and PFS rates.
Multiple studies have reported the prognostic value of specific antigen expression patterns in NeoPCs. Besides CD45, antigens with reported prognostic value include CD56, CD27, CD28, CD19, CD33, CD44, CD52, and CD117 (1-3). Among these, we analyzed the predictive influences of CD56 and CD27, because these antigens demonstrated sufficiently high expression levels to be used in a comparative analysis. Both antigens are associated with the clinical prognosis of PCM patients, but the expression patterns affecting clinical outcomes are contradictory (1-3): CD56 expression is associated with poor clinical outcomes, as is the lack of CD27 expression. Indeed, CD56 expression is associated with poor clinical outcomes in myeloma patients treated with conventional therapies while no such effects have been reported in other groups of patients who have received autologous stem cell transplantation (1, 19, 20). The expression of CD27 is uniformly seen throughout normal plasma cells and plasma cells in MGUS. The progressive loss of CD27 has been observed along with disease progression in PCM patients, and the lack of CD27 expression at diagnosis is associated with shorter OS times in PCM patients (1-3, 21, 22). Although our study did not confirm the prognostic value of these 2 antigens using the Kaplan-Meier analysis, their expression patterns demonstrated a trend toward shorter survival times. In particular, CD27 underexpression demonstrated a clearer association with a lower OS than CD56 overexpression. CD27 underexpression was also significantly associated with high-risk cytogenetic abnormalities, which could be one of the underlying mechanisms for the correlation between CD27 underexpression and a reduced OS. Interestingly, patients with a combination antigen CD56+/CD27- expression demonstrated lower survival times and were associated with high-risk cytogenetics as compared with CD56-/CD27+ patients. Furthermore, patients with other antigen combinations demonstrated intermediate OS times as compared with patients with CD56+/CD27- and CD56-/CD27+ expression. This suggests and reinforces the clinical relevance of these antigen combinations in patients with PCM.
The major limitation of this study is that the study population was relatively small. We cannot completely exclude possible bias due to the small number of patients. We could not analyze the prognostic values or compare disease characteristics besides CD56 and CD27 expression levels mainly due to the small number of patients. Secondly, the study participants were not a homogeneous group. Therefore, we cannot completely exclude the effect of therapeutic modalities on the clinical outcomes of our patients. In addition, the treatment of PCM has rapidly evolved in the last decade. Despite these limitations, this is the first study to examine the clinical usefulness of the MFC assay for assessing PCM patients in Korea. This work might provide baseline data for its use in future clinical trials that assess MFC in PCM patients in Korea. Due to the increasing occurrence of PCM in the Korean population (23), MFC immunophenotyping may be beneficial for diagnosis, prognostic stratification and the monitoring of minimal residual disease. Confirmation of the potential uses of the MFC assay for evaluating PCM warrants further studies that enroll large numbers of Korean patients.
In conclusion, our results provide the biological and clinical basis for inmunophenotyping and quantifying NeoPCs in PCM patients. The present study reports the diagnostic and clinical value of tumor burden as calculated from NeoPCs/BMPCs, and the potential role of the expression patterns of CD27 and CD56/CD27 combinations for the prognostic stratification in patients with PCM. Thus, MFC analysis can identify groups of patients with aggressive characteristics who could benefit from new treatment modalities. We expect the MFC technique to be incorporated into the routine evaluation and diagnosis of all PCM patients in the near future.
 XML Download