

 PDF
PDF ePub
ePub Citation
 Print
Print


INTRODUCTION
Hyperglycemia in extremely low-birth-weight infants (ELBWIs) is the most common abnormality of glucose metabolism observed in the neonatal intensive care unit (1, 2). Although neonatal hyperglycemia has been linked to increased mortality and morbidity, including intraventricular hemorrhage (3) and retinopathy of prematurity (4), few studies have examined ELBWIs, and a consensus is still lacking on the diagnostic criteria and optimal management of hyperglycemia in ELBWIs. Furthermore, there are no clear evidence-based data concluding that hyperglycemia itself leads to poor outcomes in these immature patients (5). Therefore, further observational studies are necessary to clarify these questions.
Although the definition of hyperglycemia and the safe upper limit of blood glucose in ELBWIs remain matters of debate, clinicians generally agree that blood glucose less than 200 to 216 mg/dL usually does not require intervention (6, 7). Possible adverse outcomes of neonatal hyperglycemia include osmotic diuresis, dehydration, electrolyte disturbances, and brain damage linked to osmolar changes (8). However, blood glucose greater than 360 mg/dL, much higher than the current cut-off level to treat hyperglycemia, may cause significant osmolar disturbances (9, 10). In addition, an increase in blood glucose from 200 to 300 mg/dL results in a change in blood osmolarity of 5.5 mOsm/L, which is relatively small compared to the normal range of plasma osmolarity (280-300 mOsm/L). Furthermore, strict glucose control using early insulin treatment might be harmful in these immature infants (11) . Therefore, it may be pragmatic to monitor clinical abnormalities induced by hyperglycemia and hyperosmolarity instead of targeting the numerical blood glucose level in isolation. Assessments of hyperglycemia and hyperosmolarity status include urine output, urine dipstick test, and serum electrolytes, in addition to blood glucose. These findings taken together may provide more reasonable guidelines for glucose control and treatment than the numerical glucose value only.
In our unit, we have consistently relied upon the assessment of urine output, urine dipstick test, and electrolyte levels, in addition to absolute glucose values, in the management of hyperglycemia of ELBWIs before starting intervening treatment, such as reducing the glucose infusion rate and/or insulin treatment. On the basis of a report that blood glucose of over 360 mg/dL is needed to develop a significant osmotic change (9), the permissive hyperglycemic strategy of allowing blood glucose to reach < 300 mg/dL if there are no concurrent problems (including significant osmotic diuresis, electrolyte imbalance, and signs of dehydration) has been applied to ELBWIs. This approach of permissive hyperglycemia up to < 300 mg/dL in ELBWIs could help avoid not only reductions in the patient's glucose and therefore caloric intake but also additive early insulin treatment in ELBWIs who show blood glucose of 201-299 mg/dL without clinical abnormalities related to osmotic diuresis.
In this study, we retrospectively evaluated this approach in ELBWIs during the first 14 days of life. Our hypothesis is that permissive hyperglycemia up to < 300 mg/dL during the first 14 days of life in ELBWIs is not detrimental and does not lead to poor short-term or long-term outcomes. To test this hypothesis, outcomes of ELBWIs with peak blood glucose of 201-299 mg/dL, who were not treated during the first 14 days of life, were compared with ELBWIs with normal blood glucose (≤ 200 mg/dL) and additionally with hyperglycemic ELBWIs with blood glucose ≥ 300 mg/dL who received insulin treatment.
MATERIALS AND METHODS
Subjects
A total of 260 ELBWIs (birth weight less than 1,000 g) were born and admitted to the neonatal intensive care unit at Samsung Medical Center between January 2004 and December 2008. The medical records of all 260 ELBWIs were reviewed retrospectively.
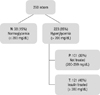
All included ELBWIs received our standard Neonatal intensive care unit (NICU) care with routine assessments of blood glucose at least once a day during the first 14 days of life. The 260 ELBWIs were classified according to their highest blood glucose level observed during the first 14 days of life and whether the treatment for hyperglycemia of reducing the glucose infusion rate or starting sliding-scale intravenous insulin infusion was initiated: the normoglycemia group (N) had blood glucose ≤ 200 mg/dL; the permissive hyperglycemia group (P) had blood glucose 201-299 mg/dL without treatment; and the treated hyperglycemia group (T) had blood glucose ≥ 300 mg/dL with insulin treatment.
Fluid and nutrition
Based on our NICU protocol for the management of ELBWIs, initial fluid was administered at a rate of 60-80 mL/kg/day and increased to 130 mL/kg/day or more during the first 7 days of life. The fluid infusion rate was adjusted twice per day or more, according to changes in serum sodium, body weight, urine output, and insensible water loss. A solution of 10%-15% glucose was started from the first day of life and modified to total parenteral nutrition through the second and third postnatal days. Glucose infusion was started at 6-8 g/kg/day and increased by 1.5-2 g/kg/day up to 17-18 g/kg/day. A 10% amino acid solution and 20% lipid solution were started from 0.5 g/kg/day at the second or third day of life, progressing by 0.5-1 g/kg/day up to 3 g/kg/day. The composition of macronutrients was balanced and adjusted according to the ratio of non-protein calories to nitrogen, which was maintained at 150:1-200:1. All infants except those who experienced asphyxia or severe bowel ileus received enteral trophic feeding starting on day 1 with breast milk or preterm formula at 10 mL/kg/day. The feeding progression depended on the infant's status, with the amount of feeding increasing by 10-20 mL/kg/day.
Glucose control
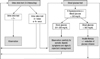
Our NICU protocol on glucose regulation was based on not only the absolute numeric value of the glucose level but also the osmotic diuretic symptoms, with additional emphasis on conserving calories, allowing permissive hyperglycemia up to a blood glucose level of 300 mg/dL (Fig. 1). Blood glucose was measured routinely once a day using a point-of-care blood gas and/or metabolite analyzer (i-STAT System, Abbott Laboratories, Abbott Park, IL, USA) employing amperometry. Urine glucose was measured semi-quantitatively 3-6 times per day routinely during the first 14 days of life by urine dipstick test using the glucose oxidase method (UriScan 10 SGL strips, YD Diagnostics, Yongin, Korea). The dipstick test results of trace, 1+, 2+, 3+, and 4+ usually indicate urine glucose levels of 100, 250, 500, 1,000, and 2,000 mg/dL, respectively (12).
In the daily routine measurements, if blood glucose was 60-300 mg/dL, routine nutritional management was continued. Osmotic diuresis in premature infants could be induced by significant urinary glucose osmotic load, so the presence of glycosuria should be an indication to measure the blood glucose rather than to reduce automatically the glucose intake (10). If the urine glucose dipstick result was 3+ on at least 2 occasions or 4+ once in routine assessment, blood glucose was measured again to decide whether to start hyperglycemic management. If blood glucose was ≥ 300 mg/dL on that occasion, hyperglycemic management of insulin administration and/or reducing the rate of glucose infusion was started. If blood glucose was 201-299 mg/dL on that occasion, cautious clinical assessment was performed to determine whether there were signs of osmotic diuresis or symptoms of dehydration, with repeated urine dipstick tests. If there were no deleterious clinical signs or symptoms, careful observation was continued without increasing glucose infusion. If subsequent blood glucose was ≥ 300 mg/dL with persistently high urine dipstick results on that occasion, then insulin treatment with or without reducing the glucose infusion rate was initiated. In this study cohort, no subjects suffered significant osmotic diuresis or dehydration caused by hyperglycemia, whose blood glucose remained below 300 mg/dL without insulin treatment and were classified as group P.
Variables and definition
We analyzed the following potentially confounding variables: gestational age, birth weight, sex, one- and five-minute Apgar scores, antenatal steroid use, respiratory distress syndrome (RDS), 28-day and discharge mortality, surgery, and bacterial or fungal sepsis within the first 14 days of life (10, 13). Gestational age was determined by the last maternal menstrual period and the modified Ballard test. Small for gestational age (SGA) was defined as birth weight less than the tenth percentile according to a growth curve (14). RDS was defined as surfactant and mechanical ventilation requirement (15). All infants received surfactant therapeutically. Chorioamnionitis was confirmed by histological examination of the placenta, and bacterial or fungal sepsis was determined by positive blood culture. Surgery included ligation of the patent ductus arteriosus or operation for bowel perforation.
Detailed nutritional data were collected daily for the first 14 days of life, including the type and volume of intravenous solutions, the composition of the parenteral nutrition, and the type and volume of enteral feedings. Summarized nutritional variables included the entire nutritional intake from both parenteral and enteral feedings.
Daily urine output and changes in body weight fraction were also collected during the first 14 days of life. Blood urea nitrogen (BUN), serum creatinine, and serum sodium and potassium were measured on postnatal days 7 and 14. Daily body weight and growth velocity, which was operationally defined as the percentage of ([body weight-birth weight]/birth weight), was assessed on days 7, 14, and 28. We also analyzed the following outcome measures: death before 28 days of life, death before discharge, bronchopulmonary dysplasia (BPD) (≥ moderate) (16, 17), intraventricular hemorrhage (IVH) (≥ grade 3) (18, 19), periventricular leukomalacia, necrotizing enterocolitis (NEC) (≥ Bell's stage 2b) (20), and retinopathy of prematurity (ROP) (21) requiring laser treatment. In addition, we evaluated long-term, two-year outcomes, including hearing impairment and cerebral palsy. Cerebral palsy, diagnosed by a pediatric rehabilitation specialist or pediatric neurologist, was defined as a non-progressive neurological disorder characterized by an inability to control posture and movement and abnormal tone in the limbs (22). Hearing impairment was defined as the need for a hearing aid as recommended by an otolaryngologist. Finally, the mental development index (MDI) and psychomotor development index (PDI) according to the Bayley Scales of Infant Development-II (23), assessed at a corrected age of 18 months, were also recorded.
Statistical comparisons
SPSS version 17 was used for all statistical analyses. For continuous variables with normal distributions, such as blood glucose, urine output, weight gain velocity, and caloric intake, ANOVA with univariate general linear analysis for covariate factor correction was used. Nominal variables, such as mortality and morbidity, were compared using chi-square tests with binary logistic regression analysis for correction. Multivariate logistic and linear regression analyses were performed for categorical and continuous independent variables, respectively, to adjust for covariate factors. To compare correlations between continuous variables, Spearman analysis was used. Data are expressed as mean ± standard error of the mean (SEM) or 95% upper confidence interval, and P values less than 0.05 were considered significant.
RESULTS
Incidence of hyperglycemia
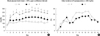
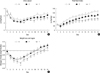
Of the 260 ELBWIs, 38 (15%) were in the N group, 101 (39%) were in the P group, and 121 (46%) were in the T group (Fig. 2). Fig. 3A illustrates the daily peak blood glucose level (mean with 95% upper confidence interval) in each group during the first 14 days of life. While mean peak blood glucose in N remained stable during the first 14 days of life, it trended upwards in T and became significantly higher than P or N after day 2. Blood glucose in P was significantly higher than N on day 2 and after day 4. The incidence of hyperglycemic episodes peaked on day 3 in group P and day 4 in T; then it decreased slightly and reached a second peak that plateaued from day 7 to 11 in both P and T (Fig. 3B).
Demographic data
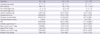
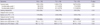
Table 1 lists the subjects' demographic characteristics. In groups P and T compared to N, birth weight and one-minute Apgar scores were significantly lower, and the incidence of RDS, mechanical ventilation at day 14, and antibiotic use within the first 14 days of life were significantly higher. In T compared to N, gestational age was significantly lower, and the incidence of major surgery was significantly higher. However, the incidence of SGA, five-minute Apgar score, antenatal steroid use, and bacterial or fungal sepsis during the first 14 days of life were not significantly different among groups. In multivariate analysis adjusted for gestational age and birth weight, ventilator support and antibiotic use in the first 14 days in P were significantly higher than N, with respective corrected odds ratios of 3.03 and 2.51 (Table 2).
Glucose and caloric intake
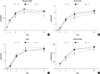
Total calorie and individual nutrient intakes from both parenteral and enteral routes were compared. Total calorie, glucose, amino acid, and lipid intakes in P were not different from N during the first 14 days of life. T presented with consistently smaller nutritional intake than the other groups (Fig. 4). Enteral feeding volume was highest in N and higher in P than T at day 7 (N: 48 ± 32; P: 22 ± 24; T: 11 ± 13 mL/kg) and day 14 (N: 94 ± 46; P: 59 ± 48; T: 34 ± 36 mL/kg).
Fluid, electrolytes, weight, and urine output
Fig. 5 illustrates the time course of daily urine output, the total amount of fluid intake, and the body weight loss and gain in each group during the first 14 days of life. Urine output was not significantly different between N and P. Despite lower intake volume, P consistently displayed less weight loss and higher weight gain in the first 14 days. T showed decreased daily total fluid intake and urine output, more profound weight loss, and slower weight gain than N and P.
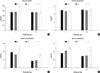
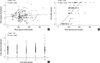
Fig. 6 shows the levels of serum sodium, potassium, BUN and serum creatinine on days 7 and 14. No differences were seen between N and P except for serum potassium, which was slightly lower in P than N. Group T showed significantly higher serum sodium and impaired renal function. Spearman correlation analysis indicated no significant correlation between daily urine output and blood glucose on day 7 (Fig. 7A). Blood glucose was significantly correlated with urine dipstick results (Fig. 7B); however, urine output was not significantly increased when the peak glucose dipstick result was 0 to +4 on day 7 (Fig. 7C).
Growth velocity
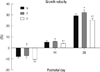
Fig. 8 shows growth velocity at 7, 14, and 28 days. The growth rate was highest in group P and lowest in group T. Although the birth weight of P was significantly smaller than N, P infants gained weight faster than N infants.
Adverse outcomes
No significant differences in adverse outcomes were observed between N and P. The T group had more immature and smaller infants and a significantly higher incidence of III/IV IVH, ROP requiring laser therapy and discharge mortality compared to N and P, and it had a significantly higher incidence of BPD (≥ moderate) compared to N (Table 3). However, in multivariate analysis adjusted for gestational age, birth weight, RDS, and ventilator support/major surgery/antibiotic use in 14 days, there was no significant differences in adverse outcomes between groups (Table 4). T group which received insulin resulted in hypoglycemia (blood glucose < 40 mg/dL) in 4% of subjects in the group.
Live discharges were 34/38 (89%) for N, 90/101 (89%) for P, and 82/121 (68%) for T. Of these, Bayley testing was done in 16 (47%) for N, 35 (39%) for P, and 35 (43%) for T. Long-term follow-up found no significant differences between groups N and P in the incidence of cerebral palsy, hearing loss, or developmental delay, defined as Bayley score (Table 5). No infants developed blindness.
DISCUSSION
There is no standard definition of hyperglycemia for ELBWIs, which may affect the reported incidence. In our study, only 15% of subjects remained normoglycemic (blood glucose ≤ 200 mg/dL) during the first 14 days of life. Our data support the finding of hyperglycemia as the most common glucose abnormality observed in ELBWIs (1, 2) and hyperglycemia occurred in 80% of very low birth weight infants during the first week of life (17). The tissues of the preterm infants are more resistant to insulin as demonstrated by the findings that after birth, the preterm infant has higher plasma glucose and insulin levels than the term infant. Furthermore, preterm infants produce glucose continuously despite high glucose and insulin level (15). Recently Chacko et al. reported that gluconeogenesis is a continuous process that is not affected by infusion rates of glucose or concentrations of glucose or insulin in ELBWIs (24). Thus, due to the high insulin resistance in the ELBWIs, titrating the insulin infusion rate to maintain narrow target glucose ranges results in frequent hypoglycemia (25), and early insulin treatment is associated with increased mortality in ELBWIs (11). Based on the previous findings, to manage the ELBWIs, it would be more practical that keeping the blood glucose level in more permissive range than before and actively supporting the nutrition and caloric intake which is one of the most essential factor in the neuronal development (26-28). On the basis of a report that blood glucose of over 360 mg/dL is needed to develop a significant osmotic change (9), the permissive hyperglycemic strategy of allowing blood glucose below 300 mg/dL was applied to ELBWIs in the present study.
Given the uncertainty regarding the safe upper limit of blood glucose in ELBWIs, monitoring certain clinical abnormalities induced by hyperglycemia, rather than the isolated numerical value of blood glucose, to make decisions about insulin treatment may be more reasonable. The adverse outcomes of neonatal hyperglycemia are linked to increased blood osmolarity, including osmotic diuresis, dehydration, electrolyte disturbances, and brain damage (8). In the present study, no osmotic diuresis was observed in the permissive hyperglycemia group and this finding was in accordance with previous report (7). Furthermore, the incidence of complications related with hyperglycemia was not different between N and P. Urine output during the first 14 days of life was not significantly different between P and N, and it was even lower in T at days 9-13. In addition, no significant correlation was seen between blood glucose and urine output on day 7. Although blood glucose was correlated with the degree of glycosuria, the degree of glycosuria was not significantly correlated with urine output in this study. The degree of glycosuria may not be a direct marker of osmotic diuresis because glucose is only one of the various solutes excreted into urine. Two-percent glycosuria (2,000 mg/dL, urine dipstick 4+) adds just 160 mOsmol/kg to the urine osmolality, while normal urine osmolality is in the range of 80-400 mOsmol/kg (29). If urine osmolality did not exceed the maximum tubular concentrating capacity, it would not cause an osmotic diuresis because the kidneys can control the excretion of water and solutes independently (10). Overall, our data show that permissive hyperglycemia up to 300 mg/dL without insulin treatment was not associated with significant osmolar changes or osmotic diuresis in ELBWIs.
In the present study, the incidence of hyperglycemia showed two peaks: a small peak on day 3 and a second peak that plateaued from day 7 to 11. Our findings of significantly lower gestational age in T and lower birth weight in T and P compared to N suggest that the first hyperglycemic peak is due to immaturity of glucose homeostasis. This mechanism may involve inadequate suppression of gluconeogenesis (30), defective pro-insulin processing, and/or peripheral insulin resistance (31). The second hyperglycemic peak was significantly associated with major surgery and clinical sepsis requiring antibiotic use. These findings suggest that stress-induced secretion of glucose counter-regulatory hormones and infection-induced release of cytokines may contribute to hyperglycemia (32). Thus, in addition to appropriate management of hyperglycemia, infants should be evaluated for underlying disorders. The enteral feeding volume on days 7 and 14 was lower in group P and T compared to N, which might be related to the hypothesis that enteral feeding promotes pancreatic function and insulin secretion (8). Other known risk factors, including antenatal steroid use (33) and SGA (34), were not associated with hyperglycemia in this study.
Neonatal hyperglycemia is associated with increased mortality and morbidity, including intraventricular hemorrhage (3) and retinopathy of prematurity (4). However, in the present study, there were no significant differences in mortality, morbidities or adverse 2-yr neurodevelopmental outcomes between P and N. Although follow-up visit rate up to 2 yr was about 93%, the Bayley test was done only about 42% of live discharge infants in this study. To precisely evaluate the long-term prognosis of hyperglycemia, well-designed prospective study would be needed to rule out the bias induced from the follow-up loss.
Insulin treatment has been advocated to facilitate the tolerance of additional parenteral calories and promote growth (35, 36). However, one study found that protein anabolism in response to euglycemic hyperinsulinemia did not occur in ELBWIs (37), while the risk of lactic acidosis due to increasing glucose infusion beyond glucose oxidation capacity remained. In the present study, we administered insulin to treat blood glucose ≥ 300 mg/dL unresponsive to decreased glucose infusion rate. However, glucose and caloric intake on days 2, 4, and 7 were significantly lower in group T than in P or N, suggesting that hyperglycemia plays an important role in limiting caloric intake despite insulin treatment (38). In our study, group T, which received insulin, resulted in hypoglycemia (blood glucose < 40 mg/dL) in 4% of subjects in the group.
Our present single-center study is limited primarily by the lack of generalizability and retrospective use of medical records for data collection. Accordingly, the essential findings reported herein will require further multi-center, larger, and randomized controlled study. Another issue to be resolved is a consideration of prediction model of insulin treatment which considers not only osmotic diuresis, but also multiple and complex pathophysiologic manifestation of hyperglycemia.
In this study, 38% of ELBWIs with blood glucose between 201 and 299 mg/dL without insulin treatment experienced no adverse outcomes, including osmotic diuresis (7). In addition, there may be little clinical benefit of early and routine use of exogenous insulin treatment in ELBWIs, which cannot be recommended based on the evidence (11). Overall, these findings suggest that unnecessary insulin treatment could be prevented by a better definition of hyperglycemia.
Permissive hyperglycemia up to < 300 mg/dL without insulin treatment during the first 14 days of life is not associated with osmotic diuresis or increased mortality or morbidities, suggesting that it is not detrimental in ELBWIs.


 XML Download