

 PDF
PDF ePub
ePub Citation
 Print
Print


INTRODUCTION
The Cluster Randomized Usual Care versus Caduet Investigation Assessing Long-Term Risk (CRUCIAL) trial (1) was designed to assess, in a real-world clinical practice setting, whether calculated Framingham coronary heart disease (CHD) risk (2) could be improved over usual care (UC) if 2 important cardiovascular (CV) risk factors, blood pressure (BP) and cholesterol, were targeted simultaneously with a proactive multifactorial intervention (PMI) strategy based on single-pill amlodipine/atorvastatin (SPAA). The combination of amlodipine and atorvastatin was chosen because these drugs have outcomes data from previous clinical trials (3, 4). The CRUCIAL trial demonstrated among patients with hypertension and additional CV risk factors that a greater reduction in calculated Framingham CHD risk (2) could be achieved using a PMI strategy versus UC (1).
Overall, 31% of patients recruited in the CRUCIAL trial resided in the Pacific Asian (PA) region. In contrast with most Western countries, the prevalence of stroke is higher than CHD in both China and Japan (5, 6). The nature of stroke also tends to be different among some PA populations, where strokes are more often hemorrhagic than ischemic, compared with Caucasian populations (7). Furthermore, there is evidence to suggest that the strength of the association between some CV risk factors (e.g. hypertension) and CV outcomes may differ among Asian populations compared with Western populations (8, 9).
In spite of these differences, many worldwide hypertension management guidelines recommend use of the Framingham CHD risk equation (2) to guide treatment decisions (10-12). The Framingham equation was developed from a 12-yr follow-up of 5,345 middle-class Caucasian men and women participating in the United States Framingham cohort study (2). The characteristics of the population from which the Framingham CHD risk model was derived has led to concerns about the accuracy of risk prediction among populations with differing risk factor prevalence and CV disease (CVD) event rates (13). Therefore, recalibration of the original equation may be required for accurate risk prediction in some ethnic groups (13). Indeed, the observed variations in CV risk profiles among different populations has led to different CV risk assessment tools being developed from specific geographic and ethnic cohorts (2, 14, 15). Accurate risk prediction is particularly important among PA populations as, in 2005, over half of the cases of CVD worldwide occurred in this region (16), and this is predicted to rise further as parts of the region continue to undergo rapid urbanization (16).
To confirm the applicability of the CRUCIAL trial results among patients residing in the PA region, it is important to determine if the reported treatment-related reductions in calculated Framingham CHD risk (2) are consistent when risk is calculated using region-specific risk assessment tools. In this CRUCIAL trial subanalysis, we compare the treatment-related reductions in calculated CHD and stroke risk observed in the CRUCIAL trial using the National Integrated Project for Prospective Observation of Non-communicable Disease And its Trends in the Aged, 1980 (NIPPON DATA80) (15), the Systematic Coronary Risk Evaluation (SCORE) for low-risk countries (14), and the Framingham total CHD risk equation (2) among PA patients enrolled in the CRUCIAL trial.
MATERIALS AND METHODS
Study design and patients
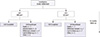
This CRUCIAL trial subanalysis utilized baseline and endpoint data from 448 patients residing in the PA region (1). The CRUCIAL trial design and principal results have previously been published (1). In brief, the CRUCIAL trial was a 12-month, prospective, multinational, open-label, parallel-design, cluster-randomized trial. Eligible patients were men and women aged between 35 and 79 yrs at baseline with hypertension (untreated: systolic BP [SBP] ≥ 160 mmHg and/or diastolic BP [DBP] ≥ 100 mmHg; treated: SBP ≥ 140 mmHg and/or DBP ≥ 90 mmHg; diabetes SBP > 130 mmHg and/or DBP > 80 mmHg), 3 or more additional CV risk factors, no history of CHD, total cholesterol (TC) ≤ 6.5 mM/L, and not receiving statin therapy. Two treatment strategies were compared: a PMI strategy, based on SPAA, and UC (Fig. 1).
Comparison of CV risk assessment tools
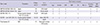
In this subanalysis, baseline and endpoint CHD and stroke risks were calculated using the following risk assessment tools: 1) NIPPON DATA80 10-yr probability of death due to CHD (15); 2) NIPPON DATA80 10-yr probability of death due to stroke (15); 3) SCORE 10-yr risk of fatal CHD for low-risk countries (14); 4) SCORE 10-yr risk of fatal non-CHD CVD for low-risk countries (14); and 5) Framingham 10-yr risk of combined fatal and nonfatal CHD (2) (Table 1).
The Framingham total CHD risk equation (2) was the primary endpoint in the CRUCIAL trial. Although the Framingham stroke model (17) was evaluated as a secondary endpoint in the CRUCIAL trial, it has not been evaluated in this subanalysis because it calculates the combined risk of fatal and nonfatal stroke, so is not directly comparable with the NIPPON DATA80 fatal stroke (15) or SCORE fatal non-CHD CVD (14) models.
The NIPPON DATA80 (15) risk-assessment chart
Death from stroke and CHD during follow-up was determined from the National Vital Statistics register (coded using the 9th and 10th International Classification of Disease [ICD]). Separate charts were developed for the 10-yr probabilities for death by CHD, stroke, and combined CHD/stroke. Risk factors in the models included gender, age, SBP, TC, diabetes (defined as casual glucose level ≥ 200 mg/dL), and smoking status.
The SCORE (14) tool
Outcomes were defined using ICD-9 codes for CV mortality. Separate models were developed for low- and high-risk countries. Models were developed for the 10-yr risk of fatal CHD and 10-yr risk of fatal non-CHD CVD. Risk factors in the models included gender, age, SBP, TC, and smoking status.
The Framingham equation (2)
CHD was defined as angina, recognized and unrecognized myocardial infarction, coronary insufficiency, and CHD death. Risk factors included in the model were age, gender, TC, high-density lipoprotein cholesterol (HDL-C), SBP, DBP, diabetes (defined as treatment with insulin or oral hypoglycemic agents, or casual blood glucose > 150 mg/dL at 2 clinic visits or fasting glucose > 140 mg/dL), and cigarette smoking status.
Efficacy measures
The primary evaluation of this subanalysis was to compare the overall change in CHD risk between baseline and Week 52 as calculated by the NIPPON DATA80 10-yr probability of death due to CHD (15), SCORE 10-yr risk of CHD for low-risk countries (14), and Framingham 10-yr risk of total CHD (2).
Secondary efficacy evaluations included the change in non-CHD risk between baseline and Week 52 as calculated by the NIPPON DATA80 10-yr probability of death due to stroke (15), SCORE 10-yr risk of non-CHD CVD for low-risk countries (14), absolute treatment-related change from baseline in SBP and DBP, and percentage treatment-related change from baseline in low-density lipoprotein cholesterol (LDL-C) and TC.
Statistical methods
Continuous variables were summarized as mean values±standard deviation (SD) and categorical variables as percents. Differences between the PMI and UC arms were assessed using least square (LS) means, 95% confidence intervals (CI), and P values. They were calculated using a mixed-effects linear model that included value at a given time point as the response variable; and treatment group, country, and baseline value as explanatory variables. A compound-symmetry variance-covariance matrix was used for patients from the same site, and papatients' site was treated as a random effect in the mixed-effects model. All statistical tests were 2-sided and evaluated at the 5% significance level. Last observation carried forward was used for missing measurements.
Ethics statement
The study conformed to good clinical practice guidelines and was conducted in accordance with the Declaration of Helsinki. The protocol and all subsequent amendments to the protocol were reviewed and ratified by central and regional ethical review boards (Pfizer Pharmaceuticals Korea Ltd, IRB approval number: AJIRB-CT4-06-220). Patients gave written informed consent to participate in the trial before the study investigators were randomized. The study was registered with ClinicalTrials.gov (NCT00407537).
RESULTS
Patient population
The majority of PA patients enrolled in the CRUCIAL trial resided in Republic of Korea (35.4%), followed by Indonesia (21.4%), Taiwan (16.9%), the Philippines (15.3%), Malaysia (6.5%), and Thailand (4.5%).
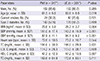
At baseline, those in the PMI arm had significantly higher SBP and DBP than the UC arm: 151.0/87.9 vs 143.3/84.1 mmHg, respectively (Table 2). Patients were slightly younger in the PMI arm compared with the UC arm: 61.5 vs 63.6 yr, respectively (Table 2). Overall, the baseline mean CV risk scores were comparable between the 2 treatment arms when calculated using the NIPPON DATA80 (15), SCORE (14), and Framingham (2) risk equations (Table 3).
At baseline, using the NIPPON DATA80 model (15) there was a 2-fold increase in the risk of fatal stroke compared with the risk of fatal CHD in both the PMI arm (3.0% vs 1.3%) and UC arm (2.9% vs 1.4%). Using the SCORE model (14), the risk of fatal stroke was lower than the risk of fatal CHD in both the PMI (2.5% vs 3.3%) and UC arms (2.3% vs 3.1%).
Risk assessments
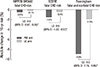
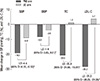
The absolute percentage change in fatal CHD risk between baseline and Week 52 in the PMI versus UC arms was similar when calculated using the NIPPON DATA80 fatal CHD model (15) and SCORE fatal CHD model (14) (LS mean difference -0.5% [95% CI -0.67, -0.35] and -0.9% [95% CI -1.22, -0.57], respectively; Fig. 2). The absolute difference between the PMI and UC arms between baseline and Week 52, as calculated by the Framingham equation for total CHD events (2), was -6.3% (95% CI -7.76, -4.85).
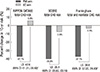
The relative percentage change in 10-yr CHD risk between baseline and Week 52 in the PMI versus UC arms was greatest using the NIPPON DATA80 fatal CHD model (15) (LS mean difference -42.6%), and similar in the SCORE fatal CHD (14) and Framingham total CHD models (2) (LS mean difference -29.4% and -30.8%, respectively; Fig. 3). This could be driven by the fact that there was almost no change in NIPPON DATA80 fatal CHD risk in the UC arm at Week 52 (absolute change -0.1% and relative percentage change +5.8%; Fig. 2, 3), while there were small reductions in risk from baseline in the UC arm as calculated by the other 2 risk scores (Fig. 2, 3).
The relative percentage change in 10-yr fatal non-CHD risk between baseline and Week 52 in the PMI versus UC arms was statistically significant when assessed by the SCORE (14) fatal non-CHD CVD model (P < 0.001), but not when assessed by the NIPPON DATA80 (15) fatal stroke model (P = 0.283) (Fig. 4).
BP and lipid parameters
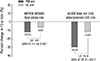
Greater reductions in SBP, DBP, LDL-C, and TC were observed in the PMI arm compared with the UC arm at Week 52 for PA patients. PA patients in the UC arm demonstrated a small increase in TC and LDL-C between baseline and Week 52 (Fig. 5).
DISCUSSION
This subanalysis of the CRUCIAL trial has demonstrated among 448 patients residing in the PA region that, compared with UC, the PMI approach was consistently more effective in reducing calculated CHD and CVD risk using various region-specific risk assessment models (2, 14, 15), despite the differences in CV risk assessment scores when calculated using these models.
High BP is estimated to account for 6% of deaths worldwide (18) and is the most common treatable risk factor for CVD (19, 20). During the last 30 yr, hypertension treatment has improved dramatically, contributing to a decrease in the incidence of mortality due to stroke and CHD (21). However, the majority of patients' BPs remain uncontrolled in all societies, and the decline in CVD, particularly stroke, has slowed in some countries (11). Dyslipidemia is among the top 5 major risk factors leading to CVD (9). Its treatment has been shown to improve prognosis: morbidity and mortality is substantially reduced in successfully treated compared with nontreated dyslipidemic controls (22, 23). However, in daily clinical practice the treatment and control of dyslipidemia remains suboptimal (24).
The aim of this subanalysis of the CRUCIAL trial was to compare, among a PA population, the treatment-related reductions in calculated CHD and non-CHD risk using region-specific risk scoring methods, driven by reductions in BP and cholesterol, rather than to compare the predictive capacity of each risk model. All 5 risk models showed a treatment-related reduction in CHD and stroke risk at Week 52 in the PMI arm compared with the UC arm. It is beyond the scope of this analysis to look at the actual predictive capacity of these models, as outcomes data on stroke and CHD events were not collected during the CRUCIAL trial.
In our analysis, there were differences in the baseline risk scores calculated by the NIPPON DATA80 (15), SCORE (14), and Framingham (2) models. At baseline, compared with the SCORE model (14), the NIPPON DATA80 model (15) gave lower risk scores for fatal CHD risk and higher risk scores for fatal stroke in both the PMI and UC arms. In the NIPPON DATA80 model (15), the risk of fatal stroke was higher than the risk of fatal CHD in both the PMI and UC arms; the reverse was seen when risks were calculated using the SCORE model (14). This may reflect differences in the event-rates seen in the populations from which the risk scores were developed (Japanese versus European).
It is also important to note when comparing these tools that the definition of the predicted outcome varies according to the risk model used. The NIPPON DATA80 (15) and SCORE (14) models calculate the risk of fatal CHD defined by ICD codes 9 and 10, whereas the Framingham (2) model calculates fatal and nonfatal CHD based on outcome data collected during patient visits and hospital records. This may partly explain the higher baseline risk seen in the Framingham equation (2) vs NIPPON DATA80 (15) and SCORE (14) in both the PMI (22.0%, 1.3%, 3.3%, respectively) and UC arms (21.3%, 1.4%, 3.1%, respectively). Furthermore, NIPPON DATA80 (15) calculates the probability of death due to stroke whereas SCORE (14) calculates the probability of death due to non-CHD CVD.
Other plausible explanations for observed differences in calculated risk are that they are dependent on the prevalence of risk factors and associated events in the population from which they are derived. The NIPPON DATA80 model (15) was developed from a Japanese population, the SCORE model (14) from a European population, and the Framingham model (2) from a predominately Caucasian middle-class population in the United States. The Singapore Cardiovascular Cohort Study suggested that hypertension may have a greater relative effect on CHD in Asians compared with Caucasians (25). The Study of Health Assessment and Risk in Ethnic Groups demonstrated that there may be greater potential for plaque rupture and thrombotic events among South Asians compared with the populations of Europe or China (8). The INTERHEART China study found stronger associations between myocardial infarction and certain CV risk factors, such as diabetes and stress, in Chinese populations compared with other regions of the world (26). Several studies have found that the Framingham CHD risk model (2) overestimated CHD risk in the Chinese population (27, 28). Indeed, when the Framingham investigators tested their score among different ethnic groups, they found that the original equations required recalibrating for populations with different CV event rates (13).
There are also differences in the risk factors included in the models and how the risk factors were defined. The Framingham total CHD model (2), where diabetes was included as a risk factor (rather than a CHD risk equivalent), was chosen by the CRUCIAL trial investigators to reflect their study's inclusion criteria (1). Diabetes is also included as a risk factor in both NIPPON DATA80 models (15), but not in either of the SCORE models (14). This may be an important factor in predicting CV risk among PA patients who had a high incidence of diabetes (59%) in the CRUCIAL trial population. Diabetes was defined as treatment with insulin or oral hypoglycemic agents, casual blood glucose level of > 150 mg/dL at 2 clinic visits, or fasting glucose level of > 140 mg/dL in the Framingham model (2), whereas diabetes was defined as a casual glucose level of ≥ 200 mg/dL in the NIPPON DATA80 model (15). TC is not used in the NIPPON DATA80 stroke model (15) (Table 1), and HDL-C and DBP are not used in either the NIPPON DATA80 (15) or SCORE (14) models.
The routine use of the PMI strategy for the treatment of hypertension is more effective in reducing CV risk, by controlling SBP, TC, and LDL-C, than the UC arm, in which taking of a lipid-lowering agent depended on the clinician's decision (Fig. 5). Hence, the risk of CVD, especially of CHD assessed using the NIPPON DATA80, SCORE, and Framingham systems was consistently and significantly reduced by the PMI strategy compared with the UC arm. However, the risk reduction of non-CHD using the PMI strategy was not outstanding compared with the UC arm when assessed by NIPPON DATA80 because the patients' lipid profile was not included in the NIPPON DATA80 10-yr fatal stroke risk system (Table 1). This means that the advantages of the lipid-lowering effects of the PMI arm were not taken into account by the NIPPON DATA80 10-yr fatal stroke risk system. The relative change in 10-yr fatal non-CHD risk from baseline to Week 52 in the PMI treatment arm among PA patients was -12.2% as calculated by NIPPON DATA80 (Fig. 4). Therefore, these results suggest that the PMI strategy is effective in reducing the risk of fatal stroke in the PA region.
The CRUCIAL trial was designed as a relatively short-term intervention (52 weeks) for patients at moderate CV risk, and data on actual CV outcomes were not collected. Calculated CHD and stroke risks were evaluated as a surrogate index for CV outcomes. We believe that comparing the reduction in CV risk after treatment with a PMI strategy (based on the inclusion of SPAA in the patient's treatment regimen) using different region-specific risk assessment tools is clinically important. In the UC arm, physicians made a voluntary decision about whether or not to prescribe statins and which statin to use, based on their best clinical judgment. In daily practice, physicians prescribe a range of drugs to manage individual patients with hypertension and dyslipidemia. In the CRUCIAL trial, both BP and lipid parameters were reduced to a greater extent in the PMI arm (SPAA-based treatment) compared with the UC arm. This led to a greater reduction in calculated CHD and CVD risk in the PMI arm using each of the risk-scoring methods evaluated in this subanalysis.
Limitations of this post hoc subgroup analysis include the small sample size: only 448 individuals in the CRUCIAL trial resided in the PA region, which will give less precise estimates. An additional limitation is that country of residence was used as a proxy for ethnicity in this analysis, so some misclassification bias may have arisen. Moreover, since multiple comparisons have been made without controlling for overall family-wise error rate, caution should be made when interpreting these results. However, despite these limitations, this study has shown that, among PA patients with hypertension and additional CV risk factors, the PMI treatment strategy is an effective approach to reducing calculated CHD risk using a range of region-specific risk assessment tools.
In conclusion, the PMI approach based on simultaneously targeting BP and cholesterol with an SPAA-based regimen, is more effective than UC in reducing CHD and stroke risk (calculated using a variety of region-specific risk assessment models) for physicians treating PA patients with hypertension and additional CV risk factors in their daily practice. Differences exist in the risk scores calculated using the different region-specific risk assessment tools. It remains to be seen whether an overall risk score tool can be developed that is more adaptable and applicable to different populations and ethnicities with varying risk factors and patterns of CVD.

 XML Download