

 PDF
PDF ePub
ePub Citation
 Print
Print


INTRODUCTION
Since the clinical introduction of magnetic resonance imaging (MRI) in the 1980s, the magnet field strength of MRI has continuously increased for better quality images because higher field strength MRIs have increased the signal-to-noise ratio (SNR) and contrast-to-noise ratios (CNR) (1). Several pilot studies using ultrahigh-field strength brain MRIs at 7.0T have been performed in a small series of brain tumors (2, 3). Besides increased costs and limited availability, concern about safety and imaging artifacts has prevented further widespread dissemination of ultrahigh-field brain MRI for clinical practice. In this study, we investigated the 7.0T brain MRIs of patients with intraaxial or extraaxial brain tumors (WHO grades I-IV) to document the safety and potential benefits in clinical application of ultrahigh-field MRI for the diagnosis of brain tumors.
MATERIALS AND METHODS
Patients
Patients who had brain tumors diagnosed with 1.5T MRI or pathologically proven at the Department of Neurosurgery at Seoul National University Hospital between April 2009 and August 2010 were enrolled in this study. The inclusion criteria included ages between 18 and 70 yr and Karnofsky Performance Scale scores over 70. Those patients who had psychiatric diseases were excluded from the study. Those patients who had any systemic diseases and abnormalities in their complete blood count and blood chemistry for liver and renal panels were also excluded from the study. Those patients who had a pacemaker, aneurysm clip, artificial heart valve, and implants indwelled in their body were excluded from the study. Those patients who were claustrophobia were also excluded from the study. Finally, twenty-four patients with various brain tumors (WHO grade I-IV) were included in this study.
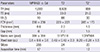
MR imaging techniques
The 7.0T MRI device (Magnetom 7.0T, Siemens, Munich, Germany) at the Neuroscience Research Institute of Gachon University of Medicine and Science was used to perform the brain imaging. All sequences of the 7.0T measurement protocol were initially optimized in healthy volunteers. The sequences were adapted to obtain an optimal image contrast, complete coverage of the brain tumor and a higher spatial resolution within a reasonable examination time (Table 1). The 7.0T magnet, with a clear bore of 90 cm, is equipped with a water-cooled gradient and RF coils. The gradient system operates at 2000 V/650 Amp with a gradient amplitude of 40 mT/m, a maximum slew rate of 200 mT/m/ms, and a minimum gradient rise time of 200 microseconds. A homemade 8-channel TX/RX coil was used. The pulse sequence used was the 3D Magnetization-Prepared Rapid-Gradient Echo (MPRAGE). The scanning parameters were as follows: TR = 4,000 msec, TE = 3.0 msec, TI = 1,100 msec, thickness = 0.6 mm, flip angle = 10°, number of slices = 256, voxel size = 0.6 × 0.6 × 0.6 mm, and matrix size = 384 × 384 (Table 1). T1-weighted MRI was performed before and after the injection of a contrast agent. The Magnevist (Bayer Healthcare Pharmaceuticals Inc., Leverkusen, Germany) was used as the contrast agent (0.2 mL/kg, 0.01 mM/kg). T2-weighted images using 2D Turbo Spin Echo were acquired with the following scanning parameters: TR = 8,500 ms, TE = 33.0 ms, thickness = 2.0 mm, gap = 2.0 mm, flip angle = 60°, number of slices = 24, voxel size = 0.43 × 0.43 × 2.0 µL, and matrix size = 518 × 518, echo train = 7. High resolution resolution T2*-weighted images using 2D Gradient Echo were acquired with the following scanning parameters: TR = 850 ms, TE = 21.0 ms, thickness = 1.5 mm, gap = 1.5 mm, flip angle = 30°, number of slices = 20, voxel size = 0.20 × 0.20 × 1.5 µL, and matrix size = 1,024 × 864. All twenty-four patients with brain tumors had a 1.5T MRI (Signa HDXT, General Electric Medical Systems, Milwaukee, WI, USA) examination within a couple of weeks before or after the 7.0T brain MRI examination. The preoperative MRI was performed using a quadrature transmit-receive head coil. The MRI protocol included the following: axial unenhanced and enhanced T1-weighted (TR = 11.5 msec; TE = 5 msec; number of excitations, 2; flip angle, 20°) 3-dimensional spoiled gradient acquisitions with a section thickness of 1.5 mm, field of view of 24 cm, and matrix size of 256 × 256 and T2-weighted acquisitions (TR = 4,000 msec; TE = 102 msec; number of excitations, 2) in the axial planes with a section thickness of 2 mm, field of view of 24 cm, and matrix size of 256 × 256.
Safety assessment and image comparison of 7.0T MRI with 1.5T MRI
All the patients were requested to fill out the prepared questionnaires to describe any adverse effects during or after the examinations with the 7.0T MRI. The tumors were reviewed on the T2* weighted and pre- & post-contrast T1 weighted images from the 7.0T brain MRI to assess the contrast enhancement patterns in the tumor bed and the tumor margin of the interface between the tumor bed and the surrounding brain paenchymes, as well as to delineate peritumoral edema and displaced normal anatomical structures adjacent to the brain tumors compared with that of the 1.5T brain MRI. The presence of microvascularity and tumor necrosis within the tumor mass was investigated on the T2*-weighted images from 7.0T MRI compared with the T2-weighted images from the 1.5T MRI. And the descriptive assessment of the image findings on the pre- and post-contrast 7.0T gradient-echo brain images were further interpreted with histopathological findings and tumor location. Two different examiners blindly evaluated the findings of 1.5T and 7.0T brain MRIs.
Ethics statement
The research protocol used in this investigation was approved by the institutional review board (IRB) of Seoul National University Hospital (IRB number: H-0802-046-234) and Gacheon University of Medicine and Science (IRB number: H-0806-004-006). This study was also approved by the Korea Food and Drug Administration Ministry, the Republic of Korea (Permit Number: 182). The written consents were obtained from all twenty-four patients with various brain tumors.
RESULTS
Clinical and safety assessment
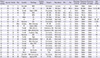
Twenty-four patients, of which eleven were men, were aged 27 to 63 yr (mean age 43.3 yr). Four metastatic brain tumors, four glioblastomas, three meningiomas, an anaplastic oligoastrocytoma, an oligodendroglioma, a central neurocytoma, an extraventricular neurocytoma, a germinoma, a chordoma, and a cavernous hemangioma were confirmed by histological examination. Two meningiomas, two metastatic brain tumors, a vestibular schwannoma, and a pituitary adenomaa were diagnosed by typical radiological findings from 1.5T brain MRIs (Table 2). Thirteen patients underwent craniotomies and two patients underwent stereotactic biopsies after the 7.0T brain MRIs. One patient underwent the trans-sphenoidal approach after the 7.0T brain MRI. Seven patients underwent gamma knife radiosurgery and one patient was followed up with antiepileptic drugs alone after the 7.0T brain MRI.
The total scanning times of the 7.0T brain MRIs ranged from one hour to two hours. The T2-, and T2*-weighted and pre- and post-contrast T1-weighted images of the 7.0T MRIs were obtained without serious adverse effects in all twenty-four patients with brain tumors. The patients felt transient dizziness (n = 6), skeletal muscle contraction (n = 3), headache (n = 2), back pain (n = 1), neck stiffness (n = 1), and a subjective feeling of electrical sensation (n = 1) during the examination with the 7.0T brain MRI. Among them, transient vertigo was the most common symptom during the scanning with the 7.0T brain MRI (Table 2). All adverse effects were episodic and transient, which did not interfere with the 7.0T brain MRI examination at any time.
Image comparison between 7.0T MRI and 1.5T MRI
The 7.0T brain MRIs showed a different appearance for the brain tumors in terms of the intratumoral vasculature, hemorrhage, necrosis, degree of contrast enhancement, tumor margin, and peritumoral edema in relation to the degree of pathological malignancy (Table 2).
Malignant brain tumors of WHO grade III or IV showed a moderate to high degree of intratumoral vasculature frequently associated with hemorrhage, necrosis, and a higher degree of contrast enhancement of the tumors and pertumoral edema. In contrast to those findings, benign brain tumors with a WHO grade of I or II showed a low degree of intratumoral vasculature with a lower degree of contrast enhancement of the tumors and peritumoral edema but were rarely associated with hemorrhage and necrosis. However, the tumor margin was clearly delineated between the brain tumors and the surrounding brain parenchyma in both the benign and malignant brain tumors in the 7.0T brain MRIs in 20 patients with brain tumors located in the cerebral hemispheres compared to the 1.5T brain MRIs (Table 2).
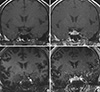
In addition, the quality of the 7.0T brain MRIs for various brain tumors was also dependent on the locations, which included the infratentorial region, parasellar region, supratentorial hemispheric region, deep nucleic regions, and so on. Sixteen were located in the supratentorial hemispheric regions; four were located in the sellar and parasellar regions; two were located in the infratentorial regions; and two were located in the deep nuclei. For tumors located adjacent to the sellar areas and skull bases which included orbital/skull base meningioma, pituitary adenoma, vestibular schwannoma, and chordoma, the 7.0T brain MRIs did not show better images compared to the 1.5T MRIs. The coronal images from the 7.0T MRI did not provide clear images of the extents of the tumors and their surrounding margins in tumors such as pituitary adenoma or orbital meningioma, located in the parasellar area due to artifacts caused by the vascular flows of both the internal carotid arteries (ICAs) in the cavernous sinuses as well as to susceptibility artifacts coming from the interface of the air-density area of the paranasal sinuses and bony structures of the skull base shown in Fig. 1.
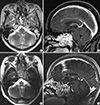
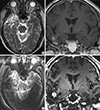
The T2-weighted axial and post-contrast sagittal images of the 7.0T brain MRIs also showed exaggerated flow-related artifacts and susceptibility artifacts in the scanning of the chordoma located in the petroclival area compared with the T2-weighted axial and postcontrast sagittal images of the 1.5T brain MRIs shown in Fig. 2.
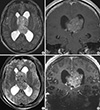
In contrast to the images from the 7.0T brain MRI of tumors located in the parasellar area and the petroclival area, the 7.0T brain MRIs of the supratentorial hemispheric tumors provided sharpened images of the internal components of the tumors and their surrounding brain parenchyma with a high SNR. Moreover, the 7.0T brain MRIs showed detailed vasculatures of the tumors as well as the surrounding vasculatures around the tumors located in the supratentorial hemispheres. Brain images with a T2-weighted axial image from the 1.5T brain MRI and T2*-weighted axial image from the 7.0T brain MRI of a patient with a central neurocytoma were well contrasted shown in Fig. 3. Dark signals in T2* and susceptibility images represent the vascularity of the brain tumor and draining veins on the surface of the tumor exposed to the lateral ventricle. The T2*-weighted axial images from the 7.0T brain MRI showed more prominent dark signals caused by high vasculature within the tumor as well as a clearer image of the tumor margin between the tumor and its surrounding normal brain structures such as the thalamo-caudate nucleus compared with the T2-weighted axial image from the 1.5T brain MRI. The post-contrast T1-weighted coronal images from the 7.0T brain MRI showed better contrast between the white matter and gray matter in the cortical surface of the brain compared with those of the 1.5T brain MRI. However, the flow-related local magnetic inhomogeneity from deep draining veins of the internal cerebral veins and both transverse sinuses resulted in linear artifacts crossing over the midline in the post-contrast T1-weighted coronal images from the 7.0T brain MRI.
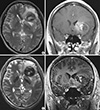
The 7.0T brain MRI provided detailed images of vascular mass lesions such as cavernous hemangioma (Fig. 4). The T2*-weighted axial images from the 7.0T brain MRI showed a clear margin for a dark signal lesion in the left frontal lobe with surrounding edema and compressed cerebral cortex. The images clearly showed the displaced and compressed normal brain structures adjacent to the brain lesions. The posteriorly displaced globus pallidus in the left cerebral hemisphere was clearly visualized in the T2-weighted axial images from the 7.0T brain MRI. The dimension of the globus pallidus shown as the dark signal in the T2-weighted axial images from the 7.0T brain MRI was bigger than that in the T2-weighted axial images from the 1.5T brain MRI. The hemorrhagic content in different stages of cavernous hemangioma was clearly visualized in the T2-weighted axial images from the 7.0T brain MRI. The line of Gennari was also well recognized in the T2-weighted axial images from the 7.0T brain MRI. The post-contrast T1-weighted coronal images from the 7.0T brain MRI showed a clearer margin between the white matter and cavernous hemangioma than that of the 1.5T brain MRI. Moreover, the dark signal shown in the internal portion of the cavernous hemangiomas was clearly noticeable in the post-contrast T1-weighted coronal images from the 7.0T brain MRIs. However, the flow from both middle cerebral arteries caused flow-related linear artifacts crossing over the midline in the post-contrast T1-weighted coronal images from the 7.0T brain MRI.
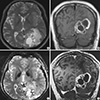
The 7.0T brain MRI provided detailed images of metastatic brain tumors compared to that of the 1.5T brain MRI shown in Fig. 5. The T2*-weighted axial images from the 7.0T brain MRI showed multi-loculated mixed signals representing the cystic and vascular components of the metastatic brain tumor with a clearer margin of the peritumoral edema in the surrounding white matter than that of the T2-weighted axial images from the 1.5T brain MRI. The T2*-weighted axial images from the 7T brain MRI showed a clearer image of the tumor margin between the tumor and its surrounding white matter as well as fiber projections such as the left optic radiation & line of Gennari compared to the T2-weighted axial images from the 1.5T brain MRI. The post-contrast T1-weighted coronal images from the 7.0T brain MRI showed sharply demarcated enhancing tumor lesions with a distinct tumor margin from the normal white matter and had better contrast between the white matter and gray matter in the cortical surface of the brain compared to those from the 1.5T brain MRI.
A small enhancing nodule of recurrent glioblastoma was detected in the right temporal lobe in the post-contrast T1-weighted axial images from the 1.5T and 7.0T brain MRIs shown in Fig. 6. The post-contrast T1-weighted coronal images from the 7.0T brain MRI showed sharply demarcated enhancing tumor lesions with its distinct tumor margin from the normal white matter as well as better contrast between the white matter and gray matter in the cortical surface of brain with a high SNR compared to those from the 1.5T brain MRI. However, flow related artifacts caused by the posterior circulation arteries in the Circle of Willis, including the basilar artery, superior cerebellar artery, or posterior cerebral artery crossed over the midline in the T2*-weighted axial images from the 7.0T brain MRI compared to the T2-weighted axial images of the 1.5T brain MRI.
DISCUSSION
In this study, twenty-four patients with intraaxial and extraaxial brain tumors (WHO I-IV) were safely examined without any serious adverse effects from 7.0T brain MRI. The safety issue of ultrahigh magnetic fields has been rarely investigated in the literature (4-9). In this study, there were no serious side effects in all twenty-four patients with brain tumors during or after the 7.0T brain MRI examination. The symptoms that patients felt during the 7.0T MRI examination were transient vertigo, skeletal muscle contraction, headache, back pain, neck stiffness, and a subjective feeling of electrical shocks. Transient vertigo was the most common symptom during scanning with the 7T brain MRI. Based on our observations, we believe that contrast-enhanced 7.0T brain MRI can be safely performed without any serious adverse effects in patients with both benign and malignant brain tumors.
Several pilot studies using 7.0T ultrahigh field strength MRI have been performed in a small series of brain tumors (2, 3, 10-21). Such studies have focused on visualization of the microvasculature and hemorrhaging within brain tumors with T2*-weighted imaging. The T2*-weighted images from the 7.0T brain MRI may provide additional detailed information on the vasculature in brain tumors. However, with respect to tumor enhancement, they reported that comparisons between 7.0T MRI and lower field strengths showed no differences in the presence and size of the enhancing region after administration of the contrast agent.
In this study, we observed that the T2*-weighted images from the 7.0T brain MRI revealed detailed microvasculature and the internal contents of supratentorial brain tumors compared to that of the 1.5T brain MRI. In addition, we observed a clearer delineation of the tumor margins and detailed information on the microvasculature inside and outside of the intraaxial and extraaxial brain tumors in the images from the 7.0T brain MRI in contrast to the images from the 1.5T brain MRI. The post-contrast T1-weighted images from the 7.0T brain MRI provided clearer images of the enhanced portions of the tumors and detailed anatomical information on the tumor margins between the brain tumors and the surrounding neurovascular structures.
The degree of pathological malignancy, which determines the prognosis and therapeutics, can be estimated based on such detailed information obtained by the 7.0T brain MRI of brain tumors. The WHO classification of brain tumors is based on their principal cell type, nuclear atypia, mitotic activity, microvascular proliferation, and necrosis (10). In general, T2*-weighted gradient-echo sequences provide excellent image contrast of the presumed microvasculature and microarchitecture of brain tumors. Noninvasive visualization of microvascularity appears to be one of the favorable clinical indications for brain tumor examinations with the 7.0T brain MRI, as previously reported in the literature (2, 3). Microvascular proliferation and/or necrosis, augmented mitotic activity of proliferating cells, cellular and nuclear pleomorphism, and mostly central areas of necrosis are the histological hallmarks of malignant brain tumors. Early estimation of low-grade brain tumors and malignant brain tumors are essential to allow for the estimation of the degree of malignancy of the brain tumors and treatment planning. One major limitation is the fact that the location of the tumor vascularity in histological tumor sections or biopsy specimens could not be directly linked to the foci of the tumor microvascularity on the MR images. However, this study demonstrated, similar to previous reports, the potential clinical applicability of 7.0T brain MRI showing tumor microvascularity in vivo. Low-grade gliomas tend to progress into high-grade gliomas with increasing vascular changes and abnormalities. Under conservative treatment, monitoring of low-grade gliomas and early detection of malignant transformation are essential to allow for accurate prognostication and suitable treatment planning. Hence, 7.0T MRI may develop as a valuable tool for the assessment of tumor vascularity and for the monitoring of anti-angiogenic therapies for brain tumors. This developing imaging technique may provide useful information for grading gliomas and for monitoring tumor angiogenesis and anti-angiogenetic therapies. Furthermore, optimized multi-channel head coils, tailored imaging protocols, and new parallel imaging techniques are expected to further improve the image quality of ultrahigh field MRI.
In this current study, however, 7.0T brain MRI revealed different appearances of various brain tumors depending on their locations: parasellar and infratentorial regions vs supratentorial hemispheric & deep nucleus regions. For brain tumors located in the parasellar areas or areas adjacent to major cerebral vessels, flow-related artifacts were exaggerated in the images from the 7.0T brain MRI. For brain tumors adjacent to the skull base, susceptibility artifacts in the interfacing areas of the paranasal sinus and skull base were prominent in the images from the 7.0T brain MRI. In an ultrahigh magnetic field, severe inhomogeneity in the applied transmit field (RF field) can be seen. Because of this inhomogeneity, the achieved pulse angle will vary between locations in the brain. This results in a spatially varying SNR (16). More importantly and dependent on the sequence that is used, this might lead to deviations in the contrast obtained from different locations in the image. These effects are most pronounced at the temporal lobes of the brain and the cerebellum. Therefore, in the peripheral areas, brain assessment of anatomical structures and possibly the pathology are currently difficult.
Because of the higher susceptibility sensitivity of 7.0T, the image quality of gradient-echo sequences may be reduced compared to that of 1.5T because of local magnetic field inhomogeneities near the skull base and the aerated paranasal sinuses. These artifacts could possibly prevent the depiction of brain tumors located in the basal parts of the brain. Compared to 1.5T brain MRI, whole-brain imaging at 7.0T is restricted by SAR limitations for most sequences, and changes in tissue relaxation times can lead to altered contrast behavior at 7.0T.
In conclusion, this study showed that 7.0T brain MRI was safely performed in twenty-four patients with intraaxial or extraaxial brain tumors of WHO grade I-IV. 7.0T brain MRIs offer a more detailed depiction of tumor microvascularity and necrosis within intracranial gliomas because of the higher achievable spatial resolution and increased sensitivity for susceptibility contrast compared to 1.5T brain MRI. This developing imaging technique could provide useful information for grading gliomas and for monitoring tumor angiogenesis and anti-angiogenetic therapies. However, further study is needed to develop refined MRI protocols for better images of brain tumors located in the skull base, parasellar region, and adjacent to major cerebrovascular structures. Thus, optimized multi-channel head coils, tailored imaging protocols, and new parallel imaging techniques for 7.0T brain MRI are expected to further improve the image quality of brain tumors.
 XML Download