

 PDF
PDF ePub
ePub Citation
 Print
Print


INTRODUCTION
The number of people affected by chronic kidney disease (CKD) or who require renal replacement therapy is steadily increasing (1). Cardiovascular disease (CVD) accounts by far for the largest proportion of fatalities in people with CKD (2). Dyslipidemia including increased total cholesterol (TC), triglycerides (TG), and low-density lipoprotein cholesterol (LDL-C) concentrations and decreased high-density lipoprotein cholesterol (HDL-C) is one of the risk factors implicated in increased cardiovascular risk associated with CKD and also in the progression of renal damage (3, 4). Therefore, early identification and proper management not only of CKD but also of dyslipidemia can prevent the progression of end stage renal disease (ESRD) and the development of associated morbidities including CVD.
Clinical trials in the general population and in established CVD patients have found that management of dyslipidemia is consistently and independently associated with the reduction of all-cause mortality and cardiovascular mortality (5, 6). Several studies have compared different lipid-related ratios for prediction of atherosclerotic CVD (7-9). However, data on the association of each lipid-related ratio with CKD and the data on the use of lipid-related ratios for prediction of CKD is still lacking, particularly on methods for comparison. A recent study reported that TG/HDL-C is positively associated with CKD prevalence, but other lipid-related ratios were not evaluated or compared in the study (10).
The National Cholesterol Education Program has proposed the widespread use of non-high-density lipoprotein cholesterol (nHDL-C) as a secondary target of therapy, after the primary target of LDL-C has been attained (11). nHDL-C is the difference between TC and HDL-C and accounts for LDL-C, very low-density cholesterol (VLDL) particles, and its remnants that reflects the increased risk of coronary heart disease.
Because current lipid-lowering strategies do not control complications of hyperlipidemia as well as they should (12), and because the indices focus on somewhat different aspects of a complex lipid profile, it is important to understand the aspects of each lipid index which controls dyslipidemia-associated complications.
Therefore, we investigated the relationships between several lipid-related ratios and CKD prevalence. We also compared the lipid-related ratios for prediction of CKD in a nationally representative sample of Korean adults.
MATERIALS AND METHODS
Study subjects
This study was based on data obtained from the 2007-2008 Korean National Health and Nutrition Examination Survey (KNHANES), a cross-sectional and nationally representative survey that was conducted by the Korean Centers for Disease Control and Prevention, from July, 2007 to December, 2008. Non-institutionalized civilians in Korea, at least one year of age, were the target population of the survey. Sampling units were households that were selected through a stratified, multistage, probability-sampling design that was based on geographic area, gender, and age from a database of household registries. Three-hundred sampling frames, consisting of 6,900 households from the primary sampling units, were randomly sampled. Of these, 5,424 households (78.6%) were included in the study. To enable the results from this study to represent the entire population of Korea, weights indicating the probability of being sampled were assigned to each participant. Participants completed three parts of a questionnaire, composed of a Health Interview Survey, Health Examination Survey, and Nutrition Survey.
The 2007-2008 KNHANES had 18,983 initial target samples. The Health Examination Survey and the Health Interview Survey were completed by 13,554 (71.4%) of total samples. We excluded individuals younger than 19 yr of age, who were taking any lipid-lowering medications, with known histories of any malignancy, without laboratory data such as creatinine and lipids, or who had not fasted for at least 12 hr prior to blood sampling. A total of 8,650 individuals (3,644 men and 5,006 women) were included in the final analysis.
Data collection
At the time the 2007-2008 KNHANES was conducted, target samples were informed that they had been randomly selected as a household to voluntarily participate in a survey conducted by the Korean Centers for Disease Control and Prevention. In accordance with the National Health Enhancement Act, supported by the National Statistics Law of Korea, all target samples were given the right to refuse to participate.
Trained medical staff performed physical examinations according to standardized procedures. Body weight and height were measured in light indoor clothing without shoes to the nearest 0.1 kg and 0.1 cm, respectively. Waist circumference was measured at the narrowest point between the lower border of the rib cage and the iliac crest. Body mass index (BMI) was calculated as the ratio of weight/height2 (kg/m2). Systolic blood pressure (SBP) and diastolic blood pressure (DBP) were measured using the right arm with a standard mercury sphygmomanometer (Baumanometer, Copiague, NY, USA). The average of two systolic and diastolic blood pressure readings, recorded at an interval of 5 min, was used for analysis. After 12 hr of overnight fasting, blood samples were obtained from the antecubital veins of the study subjects. Fasting plasma glucose, TC, TG, HDL-C, and creatinine levels were measured using an ADIVIA 1650 chemistry analyzer (Siemens, Washington, DC, USA).
Definitions of regular drinker, CKD and lipid-related ratios
We defined a regular drinker as a participant who had more than one drinking episode per a month. We defined CKD stage 3 or more as an estimated glomerular filtration rate (eGFR) below 60 mL/min/1.73 m2 (13). The eGFR was calculated using the abbreviated equation from the Modification of Diet in Renal Disease (MDRD) study: 186.3 × (serum creatinine-1.154) × (age-0.203) × 0.742 (if female) (14). LDL-cholesterol was indirectly calculated using Friedewald's formula: TC - HDL-C - (TG/5) (15). nHDL-C was calculated as HDL-C subtracted from TC. Each of four lipid-related ratios as TC (mg/dL), TG (mg/dL), calculated LDL-C (cLDL-C) (mg/dL), and nHDL-C (mg/dL) were divided by HDL-C (mg/dL).
We classified each lipid-related ratio into quartile groups in each sex. These groups were categorized as follows: TC/HDL-C Q1, < 3.40; Q2, 3.40-4.18; Q3, 4.19-5.00; Q4, ≥ 5.10 in men; Q1, < 3.05; Q2, 3.05-3.75; Q3, 3.76-4.64; Q4, ≥ 4.65 in women; TG/HDL-C Q1, < 1.74; Q2, 1.74-2.82; Q3, 2.83-4.65; Q4, ≥ 4.66 in men; Q1, < 1.19; Q2, 1.19-1.94; Q3, 1.95-3.24; Q4, ≥ 3.25 in women; cLDL-C/HDL-C Q1, < 1.87; Q2, 1.87-2.46; Q3, 2.47-3.21; Q4, ≥ 3.22 in men; Q1, < 1.73; Q2, 1.73-2.28; Q3, 2.29-2.96; Q4, ≥ 2.97 in women; nHDL-C/HDL-C Q1, < 2.40; Q2, 2.40-3.18; Q3, 3.19-4.09; Q4, ≥ 4.10 in men; Q1, < 2.05; Q2, 2.05-2.75; Q3, 2.76-3.64; Q4, ≥ 3.65 in women.
Statistical analysis
With the exceptions of TG and lipid-related ratios, the characteristics of the study sample were summarized using the independent two-sample t-test for continuous variables and the chi-square test for categorical variables. To compare the median values of TG and lipid-related ratios, we used the Mann-Whitney U test due to accommodate skewedness. We investigated the relationship between eGFR and other continuous variable, using Pearson's correlation analysis. Odds ratios (ORs) and 95% confidence intervals (95% CIs) for CKD stage 3 or more were calculated using logistic regression analysis after adjustment for other covariates across quartiles of lipid-related ratios. P value for trend was determined by linear regression analysis. Analysis was conducted using SAS statistical software, version 9.1 (SAS Institute Inc., Cary, NC, USA). All statistical tests were two-sided, and statistical significance was determined at P value < 0.05.
Ethics statement
Written informed consent to participate in the study was obtained from participants and their parents (if applicable). The participants also provided written informed consents for the use of blood samples in further analyses, to the Korea Centers for Disease Control and Prevention. This study was approved by the institutional review board of Gangnam Severance Hospital, Yonsei University, Seoul, Korea (Approval number: 3-2011-0161).
RESULTS
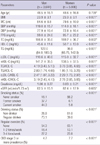
Table 1 shows characteristics of the 8,650 adult subjects (3,644 men and 5,006 women). The mean age of men and women were 48.5 and 48.6 yr, respectively. The mean or median values of BMI, waist circumference, SBP, DBP, fasting plasma glucose, TC, HDL-C, TG, cLDL-C, nHDL-C, TC/HDL-C, TG/HDL-C, cLDL-C/HDL-C, nHDL-C/HDL-C, and creatinine were higher in men than in women, while serum HDL-C levels were higher in women than in men. The mean value of eGFR did not differ between men and women. The percentages of subjects who were current smokers, current alcohol drinkers, or engaged in regular exercise were higher in men, while the percentage of subjects with CKD stage 3 or more was higher in women (4.7% in men versus 7.7% in women).
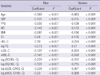
Table 2 shows Pearson's correlations among eGFR, lipid-related ratios, and other risk factors in each sex. Age, SBP, fasting plasma glucose, waist circumference, BMI, TC, logarithm-transformed (log) TG, cLDL-C, nHDL-C, log TC/HDL-C, log TG/HDL-C, log cLDL-C/HDL-C and log nHDL-C/HDL-C were negatively correlated with eGFR, while HDL-C was positively associated with eGFR in both sexes. All values were statistically significant (P value < 0.05).
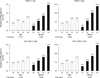
Fig. 1 shows the prevalence of CKD stage 3 or more according to lipid-related ratios quartile. The overall prevalence of CKD stage 3 or more was 6.4%. For TG/HDL-C, the percentage of subjects with CKD stage 3 or more increased with higher quartile group in both men and women (P value for trend = 0.046 in men, 0.002 in women). For TC/HDL-C, cLDL-C/HDL-C, nHDL-C/HDL-C, the percentage of subjects with CKD stage 3 or more increased with higher quartile group only in women.
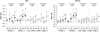
Fig. 2 shows the ORs for CKD stage 3 or more according to lipid-related ratios quartile after adjustment for age, SBP, fasting plasma glucose, waist circumference, BMI, smoking status, alcohol-drinking status, and exercise status for each sex. In comparing participants who were categorized in the first quartiles of each lipid-related ratio, only the fourth quartile of TG/HDL-C was associated with CKD stage 3 or more for men. The ORs (95% CIs) for CKD stage 3 or more of participants who were categorized in the TG/HDL-C-Q4 was 1.82 (1.09-3.03) in men. For women, the fourth quartile of TC/HDL-C, the third and fourth quartile of TG/HDL-C, and the fourth quartile of nHDL-C/HDL-C were associated with CKD stage 3 or more. ORs (95% CIs) were 1.75 (1.13-2.73) in TC/HDL-C-Q4, 2.34 (1.44-3.79) in TG/HDL-C-Q3, 2.45 (1.52-3.95) in TG/HDL-C-Q4 and 1.75 (1.13-2.73) in nHDL-C/HDL-C-Q4. The ORs for CKD stage 3 or more increased in higher quartile group for all lipid-related ratios in women. All P values for trends of each lipid-related ratio were < 0.05.
DISCUSSION
The major finding of this study was that evaluated lipid-related ratios were correlated with the prevalence of CKD stage 3 or more. This correlation was more significant in women than in men. TG/HDL-C was the only lipid-related ratio that was associated with the prevalence of CKD stage 3 or more in both men and women.
After adjusting for age, SBP, fasting plasma glucose, waist circumfernece, BMI, smoking status, drinking status and exercise status, TG/HDL-C was shown to have the strongest association among the lipid-related ratios. For men, TG/HDL-C was the only lipid index that was associated with CKD stage 3 or more though the increasing trend between OR and quartile of TG/HDL-C had borderline significance (with a P value of 0.060). For women, while all of the lipid-related ratios have a significant increasing trend between quartile and OR, TG/HDL-C increased the most with Q3 and Q4 as compared with other lipid-related ratios. This supports not only existing study results that TG/HDL-C associates with CKD independently (10), but also the hypothesis that TG/HDL-C is a better index than other lipid-related ratios.
TG/HDL-C has been identified as an indicator of insulin resistance and atherosclerosis in addition to their comorbidities (16). Increased TG/HDL-C may be associated with glomerulosclerosis, which is related to the development of CKD. Although the mechanism of CKD development is not clearly understood, CKD shares many risk factors with CVD. In addition to the traditional risk factors of CKD including hypertension, diabetes mellitus and aging, chronic inflammation, oxidative stress and obesity are also indicators of renal dysfunction development (17, 18). On a cellular level, it has been shown that when mesangial cells are stimulated by being exposed to lipids, they secrete proinflammatory cytokines such as interleukin-6, tumor necrosis factor-α, and transforming growth factor-β (19). Glomerular mesangial cells and vascular smooth muscle cells have molecular similarities, pointing to a common underlying pathophysiology in the development of atherosclerosis and glomerulosclerosis (20, 21).
Insulin resistance mediates diabetes, obesity, hypertension, lipid abnormalities and atherosclerosis, which are all risk factors of CKD and CVD (22, 23). Insulin resistance is also a significant risk factor for the progression of renal dysfunction in nondiabetic subjects (24). TG/HDL-C is an indicator of insulin resistance and cardiovascular mortality (16). Increased levels of small and dense LDL-C particles, which are highly atherogenic, are associated with elevated TG/HDL-C (25, 26). These findings suggest that increased TG/HDL-C may result in glomerulosclerosis and CKD. The stronger relationship between CKD stage 3 or more and TG/HDL-C, compared with other lipid-related ratios in this study, may be due to correlations with insulin resistance.
Regarding the relevance of associations of lipid-related ratios and CKD prevalence, this study showed stronger significance in women. This may be due to the MDRD equation which was used to calculate the eGFR. Since the MDRD equation multiplies 0.7 in women, the prevalence of CKD stage 3 or more in men may be underestimated. As seen in this study, the prevalence of CKD stage 3 or more was 4.7% in women, which was significantly lower than 7.7% in men. We expect to see stronger significance if the GFR estimating equation was developed for the Korean population.
To our knowledge, this is the first study to compare lipid-related ratios for prediction of CKD stage 3 or more. Although Schaeffner et al. (27). showed that elevated TC, nHDL-C, TC/HDL-C, and reduced HDL-C were associated with renal dysfunction in men and Kang et al. (10) showed that increased TG/HDL-C has a correlation with CKD prevalence, they did not compare the lipid-related ratios in each sex for CKD prediction. Furthermore, our study of 2007-2008 KNHANES participants, a national representative sample of Korean adults, and the number of participants are larger than previous studies.
Some limitations should be considered when interpreting the findings of this study. First, the cross-sectional study design makes determining a causal relationship between lipid-related ratios and increased risk of CKD stage 3 or more difficult. Although increased TG/HDL-C induced by renal dysfunction can aggravate the progression of CKD through lipid nephrotoxicity (28), CKD itself can affect the metabolism of lipoprotein and change TG/HDL-C. Second, we defined CKD stage 3 or more as an eGFR less than 60 mL/min/1.73 m2 using the MDRD formula and there could be a difference with the accurate CKD stage 3 or more patient. The eGFR may not accurately estimate the actual GFR. Since the creatinine level was measured only once in KNHANES, the eGFR could reflect not a chronic status but a temporary decrease of renal function. Furthermore, since the MDRD formula was developed using study samples of primarily European descents, the formula may not apply as precisely to Koreans. Third, we did not include individuals with proteinuria, which may constitute a phenotype of CKD. However, because urine samples collected in KNHANES were not the first voided morning urine, it is difficult to obtain a quantitative measurement and to control for selection bias. Finally, Friedewald's formula was used to calculate LDL-C, hence serum LDL-C level was not measured in KNHANES. This inaccuracy of LDL-C/HDL-C could have affected the results, particularly for patients with high TG levels.
In conclusion, it is suggested that TG/HDL-C is the only lipid-related ratio significantly associated with CKD for both men and women in a sample of Korean adults. Other lipid-related ratios demonstrate less significance. Prospective studies investigating the causal relationship between lipid-related ratios and risk of CKD are needed to evaluate the value of lipid-related ratio control for CKD prevention.
 XML Download