

 PDF
PDF ePub
ePub Citation
 Print
Print


INTRODUCTION
The prevalence of type 2 diabetes is increasing along with the changes in diet pattern and obesity in pediatric population (1-4). The incidence of type 2 diabetes was reported up to 40%-50% of newly developed diabetes (4), and the early onset of type 2 diabetes in younger age could increase the risk of morbidity and mortality (5). The proportion misdiagnosed cases reach up to 3%-8% of pediatric patients with diabetes and the type of diabetes was changed during the follow up (1). There was no specific test to confirm, and the diagnosis of diabetes type was made up based on the clinical factors, such as the presence of autoantibody, obesity, C-peptide, presentation with ketosis, age of onset, family history of diabetes, and other evidences of insulin resistance (2, 3, 6). In pediatric diabetic patients with atypical presentations, especially in case presented with ketoacidosis requiring insulin supplementation in acute stage, or non-obese cases with relative lower C-peptide, it is difficult to categorize to certain type (5, 6). The differentiation of type and exact diagnosis is important to choose proper medications and management.
Among young-onset, non-insulin-dependent diabetes, distinguishing type 2 diabetes from maturity-onset diabetes of the young (MODY) on the basis of family history can be problematic. Only few percentage of diabetic subjects who has family history of diabetes revealed to be genetic diabetes, so called MODY, which is sensitive to sulfonylurea (4).
Characteristics of type 2 diabetes in Korean adult subjects were reported to be heterogenous, divided non-obese type and obese type, and have pathophysiologic heterogeneity. The diabetes treatment modality could be changed on the basis of insulin secretory function and insulin sensitivity. In non-obese subjects, deterioration of early phase insulin secretion might be the major contributory factor, whereas insulin resistance, in obese subjects (7). Korean early-onset type 2 diabetes patients tend to be non-obese and insulin secretory dysfunction (8). Moreover, acquisition of adequate growth is one of the important goals of treatment in pediatric diabetes management. Harmonized nutritional and hormonal environment is essential for the growth, including thyroid, growth hormone, sex hormone and insulin. Hyperinsulinemia during puberty, decrease in insulin sensitivity and compensated by a doubling in insulin secretion, is considered to be physiologic (9). Height, weight and body mass index (BMI) are widely used surrogates of growth and they all increase during childhood and puberty. BMI is sum of fat free mass index (FFMI) and fat mass index (FMI) (10).
Obesity, in other words excess fat, related to insulin resistance can affect the clinical course of diabetes. BMI is widely used as a marker of adiposity with weight and height, the definition of overweight is BMI > 23 kg/m2, and obesity is defined as BMI > 25 kg/m2 for Asian adult (11). BMI has limitations not to reflect the body adiposity accurately especially in childhood and adolescent period because it could not differentiate body fat from lean mass. Furthermore, weight is not always scaled to height with power of 2 (12, 13).
We conducted this study to detect and to choose proper treatment modality for atypical cases of pediatric diabetes mellitus on the body composition chart using FFMI and FMI.
MATERIALS AND METHODS
Study subjects and data collection
The study populations were patients who visited the pediatric department of Konkuk University Medical Center from August 2005 to 2012, and those were diagnosed of diabetes mellitus. Only patients who underwent the analysis of body composition and result of blood sample for metabolic profile was included. A total of 34 patients were included in this study. Subjects were grouped by the type of diabetes and gender as four groups, type 1 diabetic girls, T1F; type 1 diabetic boys, T1M; type 2 diabetic girls, T2F; and type 2 diabetic boys, T2M.
Their clinical charts were retrospectively reviewed for demographic and clinical data, including family history of diabetes mellitus, age, the anthropometric data (including height and weight), results of body composition analysis (fat mass; FM, fatfree mass; FFM, and the percentage of body fat; PBF), the results of diabetes and metabolic profiles (HbA1c, glucose, C-peptide, insulin), total cholesterol (TC), triglyceride (TG), and high-density lipoprotein (HDL) cholesterol. The diagnosis of diabetes mellitus was established based on the guideline of American Diabetes Association (14); a hemoglobin A1c (HbA1c) ≥ 6.5% or a fasting plasma glucose level ≥ 126 mg/dL or 2 hr plasma glucose ≥ 200 mg/dL during an oral glucose tolerance test or in a patient with classic symptoms of hyperglycemia or hyperglycemic crisis and a random plasma glucose ≥ 200 mg/dL. The diagnosis of type 1 diabetes (15, 16) was established when the patient required insulin for survival, presented with ketoacidosis, and had autoantibody, and other cases were classified as type 2 diabetes.
Anthropometric measurement and body composition analysis
Weight was measured with digital scale (CAS, Seoul, Korea) to the nearest 50 g, and the height was evaluated with a stadiometer (Holtoain, Crosswell, UK) to the nearest 0.1 cm.
The Z-scores of height (HTZ), weight (WTZ), and BMI (BMIZ) were calculated using Korean children and adolescents growth standard chart. We carried out bioimpedence analysis using Inbody 720 (Biospace Co., Seoul, Korea) to evaluate body FFM, and FM. BMI was calculated from the body weight (kg) and height (meter) using formula; BMI = weight/(height)2.
Based on the two compartment model (17), the body weight could be constituted as FM and FFM.
Body weight = FM + FFM
BMI is useful in the evaluation of the excess or deficit in body weight after adjustment for height (10, 18). The FFM and FM scaled to height also has been reported (13, 19). To evaluate the height adjusted body indices (FMI, and FFMI) (13, 20), FM and FFM substitute for weight in BMI equation (10).
BMI = (FM + FFM)/height2 = FM/height2 + FFM/height2 = FMI + FFMI
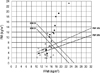
We used to the body composition chart of Hattori (20), which was expressed two dimensional diagram with FFMI, and FMI. We also figured out the relationship between the type of diabetes mellitus and four variables for body composition by adding the lines of BMI and PBF.
Statistical analysis
All analyses were performed using SPSS 17.0 software (Chicago, IL, USA). Descriptive statistics were calculated for all variables. Comparison of anthropometric measurements and indices of body composition between types of diabetes was done using a non-parametric Mann-Whitney test. We performed a Kruskal-Wallis test to evaluate the statistical significance of differences among the subgroups. When significant differences were observed, Mann-Whitney test were performed for between-group comparisons. The levels of prediction of body composition variables and anthropometric measurements of type 2 diabetes were assessed using a Receiver Operating Characteristic (ROC) curve analysis. Regression analysis was used to determine contributing factors for FMI. A P value of less than 0.05 was considered significant.
RESULTS
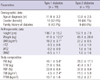
A total of 34 patients were enrolled in this study. The mean age was 12.8 yr old. Age of type 2 diabetic subjects seems to be higher, but was not statistically significant. There were no differences in gender, and presence of family history of diabetes mellitus between the two types (Table 1). Between the two types, weight, and BMI showed a significant difference, but WTZ and BMIZ were not different. Among the body composition data, FM (P = 0.003) and FMI (P = 0.005) were significantly different between both types of diabetes.
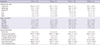
Demographic, anthropometric and body composition data of each subgroup by the type of diabetes and gender (T1F, T1M, T2F, and T2M) were shown in Table 2. There was no variable that was significantly different between T1F and T1M. FFMI in male tended to be higher, but not statistically significant (P = 0.053). In both gender, anthropometric and body composition indices were significantly different by diabetes type. BMI and BMIZ were higher and all body composition indices were higher in type 2 diabetes, in each gender.
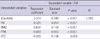
The area under the curve (AUC) of a ROC curve, were 0.825 in FFMI, 0.856 in BMI, and 0.863 in FMI, in order. In regression analysis, the FMI was the only significant determinant of diabetes type (data was not shown). Linear regression analysis was performed to recognize contribution on FMI. The result showed four variables of FM (β = 0.20, P < 0.001), BMIZ (β = 0.90, P < 0.001), FFM (β = -0.11, P < 0.001), and HTZ (β = -0.05, P = 0.005) provided the best predictors for FMI, in order (Table 3).
We expressed the indices of body composition of subgroups, using the body composition chart with FFMI on X-axis and FMI on Y-axis (Fig. 1). By adding lines of BMI 23 and 25, which were selected by the definition of overweight and obesity, and PBF 25 and 30 chosen arbitrarily, plane was divided. The most of the type 2 diabetes clinically diagnosed were located above the line and type 1 diabetic subjects were located below the line based on BMI 23 kg/m2.
Three girls and two boys with type 2 diabetes were located below the line of BMI 23 and PBF 30, and one type 1 diabetic girl belong to the zone above BMI 25 and PBF 30. These six subjects considered atypical cases as type 2 diabetes with lower BMI and type 1 diabetes with obesity and the clinical characteristics of each atypical case were summarized in Table 4.
DISCUSSION
Type 2 diabetes showed higher BMI and BMIZ in this study (Tables 1, 2). In subgroup comparison, in each gender, type 2 diabetic subjects showed higher FFM as well as FM, and scaled to height indices (FFMI and FMI) were also higher (Table 2). FMI was the discriminant of the types of diabetes and it was affected by BMIZ, FFM, and HTZ as well as FM (Table 3).
In this study, 6 (17.6%) of 34 subjects were considered to be atypical cases on body composition chart. Among the atypical cases, patients 1-5 who had type 2 diabetes and low or normal BMI showed a decrease in FFMI. We postulate that relatively lower FFMI might be susceptible in the development of diabetes without absolute increase in FMI during puberty. The deteriorate disease progression along with an increase in the absolute level of FMI might be expected. Patients 2 and 3 showed reduced response of insulin secretion to the oral glucose tolerance test in the early phase (0-30 min). Accordingly, suboptimal growth could be related to relatively lower insulin secretion in the non-obese atypical type 2 diabetes cases. It is important to follow up the growth during puberty and final adult height in these patients.
The unclassified cases or double diabetes have been reported among pediatric patients with diabetes (4). If patient showed atypical characteristics, including type 1 without autoantibody and residual insulin secretion, and type 2 diabetes without significant overweight, and family history of two or more consecutive generation, it is needed to suspect the possibility of MODY (21). Patienst 2, 3, and 4 who were diagnosed as type 2 diabetes based on C-peptide, had family history of diabetes through three consecutive generations. However, insulin secretory capacity seems to be not sufficient as they showed suboptimal growth with lower BMI. In these cases, without absolute increase in FMI, but along with the decrease in FFMI could be the cause of early onset of MODY or exacerbation of glucose control (4).
Increase in BMI was observed in both sex in adolescent period with remarkable growth in height and weight, and changes in FFM and FM occurred together based on Forbes's companionship (22). However, body composition changes of both sex differently in late adolescent period, large increase in FFM with reduction of FM in boys and steady increase in FM in girls account for BMI changes (23). Patient 1 had low BMI but she was obese for 4 years and showed recent weight loss for 4 months. We assumed that the FM utilization could occur when the growth of principle organ, followed slight increase in FFM, via non-insulin mediated glucose uptakes.
Decreased muscle mass, so-called sarcopenia, could increase the vulnerability to diabetes through insulin resistance (24, 25), and excessive body adiposity has been reported to have associated with metabolic dysregulation even in patients having normal BMI or body weight (12). Physical activity could overcome insulin resistance regardless of the severity of obesity, and reduction weight with exercise in diabetes could help to preserve the islet cell function (4, 6, 26). Moreover, increase muscle mass (FFM) with exercise, and reduce fat (FM) is important to reduce insulin resistance (26).
On the contrary, patient 6 showed increased BMI and FMI at admission despite of type 1 diabetes. We assumed the increased FMI in this adolescent girl was resulted from the decreased physical activity and increased insulin administration. Large amount of insulin administration could contribute to be obese with excess fat accumulation, and related insulin resistance resulted in deterioration in disease course. In case of patient 6, the acquisition of insulin resistance (characteristics of type 2 diabetes) in course of disease progression works for action to free fatty acid (FFA), it resulted in high concentration of triglyceride and FFA (24). FFA is also one of the factors to cause the insulin resistance to decrease clearance of insulin in liver (24).
Approximately 80% of glucose uptake occurred without insulin action in the fasting state (27). Insulin is one of the growth factors and promote to increase in FFM include the principle organ growth including kidney, liver, and heart. Hyperinsulinemia during puberty is considered to be physiologic (9) and it could be explained the increase in insulin secretion for rapid growth and development. Moran et al.(28) also reported that high level of fasting insulin was not directly related to insulin resistance. Therefore, adolescents who did not show physiologic hyperinsulinemia could be categorized as atypical type 2 diabetes and it might be due to relative shortage of insulin secretion. Insulin therapy has been recommended in adolescent poorly controlled type 2 diabetes patient with relative under secretion of insulin as well as in patient with type 1 diabetes (29). Though the insulin requirement increase in adolescent patients, excessive insulin administration should be avoid as it can cause fat accumulation and metabolic syndrome even in type 1 diabetes (30). Therefore, type 1 diabetes patient with high FMI, such as patient 6 in our study, should be recommend to intensify exercises therapy as well as to avoid excess insulin administration.
Analysis of body composition could be used in the differentiation of type of diabetes with borderline characteristics. We could recognize the type 2 diabetes patients who might need insulin therapy with body composition chart by plotting FFMI and FMI. In cases with decreased FFMI without higher FMI could be suspected insulin secretion capacity is not sufficient for the growth requirement and insulin therapy could be recommended. Exercise therapy is also warranted to increase FFMI in these patients. Identification of diabetes type by secretory capacity of insulin and the degree of insulin resistance is important to choose proper medication and treatment modality.
This study has some limitations. First, sample size was small. Second, power of 2 was used in scaling FFM and FM to height same as BMI. However, power of 2 is not a fixed true value, as different power among races and gender were reported in adults (13). It might be different in these age population as adolescent period has rapid and remarkable growth. The further study with large number of pediatric diabetic patients, and height-adjusted body composition with precise power is needed to confirm these results.
Using the body composition chart, six atypical cases were identified including non-obese type 2 diabetes showing suboptimal growth related to relatively lower insulin secretion and type 1 diabetes with insulin resistance resulted from obesity. It is concluded that body composition chart, plotting FFMI and FMI, might be useful in characterization of diabetes type and detection of atypical cases and early adjustment of diabetes management strategy.

 XML Download