

 PDF
PDF ePub
ePub Citation
 Print
Print


INTRODUCTION
Light microscopy has been the primary tool for malaria diagnosis and research. Although this method has many strengths, it also suffers some drawbacks, including labor-intensiveness, subjectivity, and relatively low reproducibility. Alternative methods have been developed to overcome the limitations of microscopy. The isotopic assay was designed to measure growth of malaria parasites in culture by monitoring incorporation of 3H-hypoxanthine into DNA (1). Flow cytometry also has been used in malaria research. Since the flow cytometric method was first used to detect Plasmodium parasites (2), several research groups developed and optimized flow cytometric measurements of parasitemia for various purposes using a variety of fluorochromes (3-8).
One hundred thousand cells can be analyzed in a minute or less with an ordinary flow cytometer (FACS). The remarkable speed of FACS has offered opportunities for developing high-throughput methods for antimalarial drug discovery (4), assessment of the effects of leukocytes on parasite growth (6), or determination of growth inhibitory antibodies (5). For these high-throughput methods, an automated 96-well plate sampler is used to save time associated with manual sample changes. One group maximized the speed of the high-throughput screen by directly measuring fluorescence intensities with a 384-well plate reader and screened more than 79,000 small molecules for antimalarial activity (9).
Another important strength of FACS is high reproducibility, which can make feasible growth assay of low-parasitemia field isolates. The average parasitemia of P. vivax malaria patients was reported to be lower than that of P. falciparum patients. Among P. vivax malaria patients, those in temperate regions showed lower parasitemia than those in tropical regions (10, 11). The average parasitemia of P. vivax malaria patients in a temperate region was 8,396/µL (0.17% assuming 5 × 10⁶ red blood cells/µL), and a quarter of the patients had parasitemia levels lower than 0.02% (11). Thus, for example, even if a field isolate of 0.2% parasitemia showed a 50% increase in parasitemia in 48 hr, no conclusions can be drawn until information about the precision of the parasitemia measurements is provided. If the standard deviation of the measurements was the same as the parasitemia increment, the probability that the field isolate was truly growing would be 68% (if the measurement errors are assumed to follow a standard normal distribution). Therefore, if a measurement method of higher reproducibility is developed, a conclusion can be drawn with a higher probability.
In this study, we established a protocol to maximize the precision of parasitemia measurements by FACS using PicoGreen, a double-strand DNA-binding fluorescent dye. In addition, we compared the intra- and inter-person coefficients of variation for the flow cytometric and microscopic methods to determine how much the precision of parasitemia measurements was improved.
MATERIALS AND METHODS
In vitro culture of Plasmodium falciparum
The blood stage parasites were cultured as described previously (12). Briefly, P. falciparum (ATCC No. 30932) was cultured in RPMI medium with 10% human AB+ serum in a 6-well plate under gas conditions of 5% CO2 and 3% O2. Uninfected blood cells and human AB+ serum used in this study were obtained after written informed consent was obtained.
Measurement of parasitemia by FACS
To 10 µL of infected or uninfected control blood cells in an Eppendorf tube, 290 µL of PBS were added. After brief mixing, 1 mL of 0.025% glutaraldehyde in PBS was added, and the tube was stored at 4℃ for 30 min to fix the cells. The cells were spun down at 450 × g for 5 min, and the cell pellet was resuspended in 0.5 mL of 0.25% Triton X-100 in Tris-EDTA (TE) buffer to perforate the cells. In 5 min, the cells were spun down and resuspended in 810 µL of TE buffer. To the tube, 90 µL of RNase solution (1 mg/mL in TE buffer) were added and incubated in a 37℃ water bath for 30 min. Next, 100 µL of PicoGreen solution (1/1,000 dilution of the stock solution, Invitrogen, Carlsbad, CA, USA) were added to obtain a final concentration of 1/10,000 dilution of the supplied stock. For each sample, 100,000 cells were analyzed with FACSCalibur (BD, San Jose, CA, USA), using the software CellQuestPro. After selecting intact blood cells with a rectangular gate on a forward scatter/side scatter plot, a parasitemia value was obtained from a histogram of the number of cells vs fluorescence intensities. For samples with a parasitemia higher than 0.5%, a peak for the parasitized cells was clearly displayed and well separated from the peak of uninfected cells. The lower boundary of the gate was set at the base of the peak for the parasitized cells, and the upper boundary was set at the position with a fluorescence intensity 16 times that of the peak to include schizonts with 16 nuclei.
Measurement of parasitemia by nested PCR
P. falciparum species-specific nested PCR was performed according to the method of Snounou and others (13). The blood cells cultured with P. falciparum were diluted in 10 volumes of PBS with 0.05% saponin. The parasites were released from erythrocytes at room temperature for 15 min and collected by centrifugation (6,000 × g for 5 min). The supernatant was discarded; the parasite pellet was resuspended in 60 µL of PCR buffer without MgCl2; and the mixture was incubated at 95℃ for 10 min. The first round of nested PCR amplification was then performed with a 5 µL aliquot of supernatant from this mixture solution. For the first round of PCR amplification, two Plasmodium genus-specific primers, rPLU6 (5'-TTA AAA TTG TTG CAG TTA AAA CG-3') and rPLU6 (5'-CCT GTT GTT GCC TTA AAC TTC-3') were used for amplification of small subunit ribosomal RNA genes. The second round of amplification was performed with a 1 µL aliquot of product from the first round of PCR, using species-specific primers of rFAL1 (5'-TTA AAC TGG TTT GGG AAA ACC AAA TAT ATT-3') and rFAL2 (5'-ACA CAA TGA ACT CAA TCA TGA CTA CCC GTC-3') to produce a P. falcipraum-specific 205 bp fragment of ssrRNA genes. The PCR products were analyzed on 1.5% TAE-agarose gels.
Measurement of parasitemia by microscopy
To prepare thin films of the samples, cells (18 µL) were spun down, the supernatant was removed, and the cells were resuspended in 9 µL of PBS. Of the resuspended cells, 4 µL were smeared on a glass slide and stained with Giemsa, and 5,000 red blood cells were counted per slide.
RESULTS
RNase treatment reduces the background noise
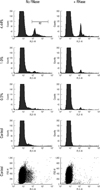
The parasitemias of RNase-treated samples were lower than those of the untreated ones by 0.27%, 0.06%, 0.04%, and 0.10% for samples with 4.44%, 1.0%, and 0.5% parasitemia and the uninfected control, respectively (Fig. 1). This result indicates that the higher parasitemias of the untreated samples are partially due to the background noise, which can be eliminated by RNase treatment. Moreover, when treated with RNase, the peaks for the parasitized cells became sharper, even revealing a small peak for two-nuclei schizonts in the 4.44% parasitemia sample. As evident from the cytograms of forward scatter vs fluorescence (Fig. 1), most cells in the region with fluorescence intensities between 10 and 100 (arbitrary units) were eliminated by RNase treatment.
Optimal PicoGreen concentration
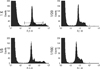
Invitrogen, the supplier of PicoGreen, suggested diluting the stock PicoGreen solution 2,000-fold for nucleic acid samples in solution for spectrofluorometry. Because they had not suggested any guidelines for flow cytometry, we started with a PicoGreen concentration of 1/2,000 dilution. When the dye solution was further diluted five-fold, the position of the peak for parasitized cells shifted slightly towards the weaker fluorescence side, whereas the peak for the uninfected cells moved substantially to the left, widening the gap between the two cell populations (Fig. 2). In addition, at this dilution, the fine structure of the parasitized peak became superior. For these reasons, we chose a dilution factor of 10,000-fold for the remaining experiments, which is a five-fold dilution of the manufacturer's suggestion.
When the dye solution was further diluted to 20-fold and 100-fold of the suggested concentration, the fluorescence intensities of the parasitized peaks shifted down to 60 and 40, respectively, narrowing the gap between the two cell populations.
Precision of parasitemia determination by FACS
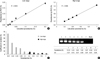
Samples of the low range parasitemias yielded relatively poor correlation (r2 = 0.9854) between the measured parasitemias by FACS and the expected parasitemias when compared to the high range samples (r2 = 0.9996) (Fig. 3A, B). Because the standard deviations of the low range samples were considerably uniform (ranging from 0.0064% to 0.0093%) and smaller than those of the high range samples (ranging from 0.0071% to 0.0239%), the low correlation might be ascribed to inaccuracy of serial dilution. The smaller standard deviations of the low range samples were somewhat expected because they were obtained from 10 repeated measurements, whereas the high range samples were measured five times.
The coefficients of variation (CV) for the low range samples gradually increased as the parasitemias decreased, reaching as high as 64% for the 0.01% parasitemia sample (Fig. 3C). The CVs for the 0.2% parasitemia sample were 4.6% and 7.4% when the parasitemia was measured 10 times or five times, respectively. The CVs for samples with 0.3% or higher parasitemias were 5% or less.
An infection showing parasitemia around 10%, measured by microscopic observation, was diluted by 1/2 serial dilution for use in the nested PCR. All dilutions produced a band on the agarose gel, although a bright band was seen when the diluted sample reached to 0.5%, and a band for 0.13% parasitemia was weak to detect (Fig. 3D).
Intra- and inter-person reproducibility of flow cytometry and microscopy
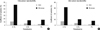
Intra-person CVs of flow cytometry for 0.1%, 0.5%, and 1% parasitemia samples were 11.0%, 4.8%, and 3.0%, respectively (Fig. 4A), while inter-person CVs were 6.6%, 3.6%, and 1.2% for the same samples (Fig. 4B). These results seem fairly acceptable. As anticipated, however, both intra- and inter-person CVs of microscopy were three to six times larger than those of flow cytometry (Fig. 4). In particular, the microscopic method yielded an intra-person CV of 63% for the 0.1% parasitemia sample (Fig. 4A).
DISCUSSION
The success of parasitemia measurement by FACS using a DNA-binding fluorochrome largely depends on discrimination between parasitized cells and other nucleic acid-containing cells in the sample. Because DNA-binding dyes have some affinity for RNA, cellular RNA contents also should be taken into account. Nucleic acids in a sample prepared from a continuous in vitro culture may include 1) chromosomal DNA in the nucleus of a leukocyte, 2) RNA in a reticulocyte, and 3) mitochondrial DNA in a reticulocyte. The DNA contents of a human cell, P. falciparum, and P. vivax are 3 Gb, 23.3 Mb, and 26.8 Mb, respectively (14). Since the human genome is 129 and 112 times larger than those of P. falciparum and P. vivax, respectively, leukocytes would exhibit fluorescence intensities far too strong to interfere with the parasitemia measurements. However, reticulocytes have varying amounts of RNA depending on the degree of maturation. And, PicoGreen is described as having an approximately 1/100 affinity for RNA compared to double-strand DNA. Therefore, if the amount of RNA in a reticulocyte is 100 times of a plasmodial genome, the reticulocyte would be counted by FACS as one of the parasitized cells. The reduced background noise obtained by RNase treatment might have been achieved by clearing the reticulocyte RNA. Human mitochondrial DNA is 16.5 Kb in length, 1/1,600 the size of the P. vivax genome. Thus, if a reticulocyte has 1,600 mitochondria in it, it also might cause a problem. Even though a human liver cell is known to have up to 2,000 mitochondria, it is uncertain if a reticulocyte also has that many mitochondria because an electron micrograph shows much fewer mitochondria than that (15). It remains unclear what causes the residual background noise level of approximately 0.05% after RNase treatment.
Among a variety of DNA-binding fluorochromes that are excitable by a 488 nm blue laser, PicoGreen was chosen for this study based on two previous studies (3, 16). One reported that YOYO-1 was superior to propidium iodide or acridine orange, showing better separated peaks for parasitized cells and uninfected cells on histograms (3). The other report demonstrated that PicoGreen had more consistent fluorescence intensities and lower CVs over a wide range of dye concentrations than YOYO-1 and YO-PRO-1 (16). However, for all the strong points of PicoGreen, it is impermeable to lipid bilayers, requiring the additional sample preparation steps of cell fixation and perforation. Because our primary concern was to maximize the precision of the measurements in order to handle low-parasitemia field isolates, we traded speed for precision.
With the optimized protocol, our flow cytometric method yielded CVs less than 10% for samples with 0.1% or higher parasitemias. However, the CVs for samples with 0.05% or lower parasitemias were unacceptably high, reaching over 60% for the 0.01% parasitemia sample. Since these CVs were calculated based on 10 repeated measurements, and parasitemia measurements are not repeated this many times for ordinary experiments, the CVs reported here would be lower limits. Thus, 0.1% parasitemia is the limit that the current method can measure with reasonable precision under ordinary experimental designs. Based on our nested PCR method, parasites were detected in all the diluted samples in which the expected lowest parasitemia was 0.13%. However, the bright band signal was seen when the samples was diluted to 0.5%. Assuming that 0.1% parasitemia is the limit of the PicoGreen method, it can be suggested that the sensitivity of PicoGreen method in the measure of the Plasmodium parasitemia seems to correspond with that of the PCR analysis.
The thin film method of microscopy resulted in intra- and inter-person CVs less than 20% for 0.5% or higher parasitemia samples, although these values were much larger than those of the flow cytometric method. However, the CVs for the 0.1% parasitemia sample were too high. Under ordinary circumstances, the number of erythrocytes counted per slide is much less than the 5,000 of this study. Thus, due care should be practiced when interpreting microscopically-determined parasitemias lower than 0.5%.
Microscopic examination of stained blood films is the standard malaria diagnosis method. However, the low sensitivity of this method is the major problem in the diagnosis of malaria showing low parasitemia, such as P. vivax infection (17). We have measured the percent values of parasitemia by both of flow cytometry and microscopy methods from blood samples of three P. vivax infected patients. The measured values were 0.09% ± 0.02%, 0.12% ± 0.04%, and 1.14% ± 0.01% by flow cytometry, and 0.01%, 0.04%, and 0.55% by microscopic observation, respectively. Therefore, flow cytometric examinations showed relatively higher parasitemia level of vivax malaria samples compared to microscopic observation, although statistical analysis was unavailable due to the limited number of experiments. The standard deviations of the flow cytometry-measured parasitemia were fairly uniform in part (from 0.01 to 0.04). In this regard, flow cytometric method might be a choice in the diagnosis of Plasmodium infection with low parasite levels. Although the primary goal of the parasitemia determination method developed in this study was to enhance the reproducibility of low-parasitemia samples as much as possible, the speed was still much faster than the microscopy due to the intrinsic nature of FACS. One person was able to measure parasitemias of 200 samples in 6 hr, including the fixation, perforation, and RNase treatment steps.
Collectively, the PicoGreen method appears better than the microscopy for assessing low parasitemia isolates, on the basis of its superior sensitivity and consistency. Although the microscopy is a proven method for diagnosis of Plasmodium infected isolates, its usefulness is limited by access to skilled microscopists and its time consuming methodology. The PicoGreen method described here could be a reliable high sensitivity assay for analysis of low parasitemia samples. In addition, the relatively high speed of PicoGreen assay might enable it as a high throughput system which can be applied to antimalarial drug discovery programs.
 XML Download