

 PDF
PDF ePub
ePub Citation
 Print
Print


INTRODUCTION
Mesenchymal stem cells (MSCs) are present in a variety of tissues during human development, and in particular, are prevalent in adult bone marrow (1). MSCs isolated from bone marrow (BM) and expanded in vitro in their undifferentiated phenotype, retain an extensive capacity for multi-lineage differentiation into chondrocytes, adipocytes, osteoblasts, and tenocytes under appropriate environmental cues (2). The presence of specific, distinct antigens identified by the monoclonal antibodies SH2, SH3, and SH4, on the surfaces of marrow-derived MSCs, that are not present on osteocytes and osteoblasts, suggests that these epitopes are developmentally regulated. The antigen which bound to SH2 antibody was identified as endoglin (CD105), a receptor for TGF-β3, which potentially plays a role in mediating the chondrogenic differentiation of MSCs and in their interactions with hematopoietic cells (3).
Chondrogenesis, the differentiation of MSCs into chondrocytes, is crucial required for skeletal development and maturation, since the cartilage anlage is the model for bone formation. Cartilage development thus includes the differentiation of MSCs into chondrocytes, followed by their maturation, and eventual their hypertrophy and death (4). Differential gene expression profiling has been widely performed to identify and characterize candidate genes that play potentially important roles in particular biological process (5).
Although the amount of information regarding the role of growth factors and cytokines as inducers and mediators of MSC differentiation continues to increase, little is known about the gene expression profiling of MSC chondrogenic differentiation. In this study, we employed ABI GeneChips (representing > 30,000 genes) to identify genes differentially expressed during BM-MSC chondrogenesis. ABI is introduced technology based on nylon-spotted 60 mer oligonucleotides, that uses on oligomers to detect each gene for most genes, chemiluminescence to measure gene expression levels, and fluorescence to grid to normalize and identify microarray features. The ABI gene list was compiled from information in public and Celera databases (6). This study was designed to identify differential gene expression profiles and novel genes that might be involved in BM-MSC chondrogenesis.
MATERIALS AND METHODS
Cell culture
Mononuclear cells from BM aspirates were isolated by density Ficoll-Paque gradient separation. BM was placed in a 50 mL syringe containing 5,000 units of preservative-free heparin, diluted 1:1 with phosphate buffered saline (PBS), resuspended in PBS to a final volume of 10 mL, and layered over an equal volume of Histopaque-1,077 (Sigma Chemical Co., St. Louis, MO, USA). After centrifugation at 2,000 rpm for 30 min, mononuclear cells were recovered from the gradient interface, rinsed twice in PBS, adjusted to a concentration of 1.5 × 10⁷ cells/10 mL, and seeded onto 100-mm culture plates in Dulbecco's Modified Eagle's Medium-Low Glucose (DMEM-LG; 1 g/L glucose, JBI, Seoul, Korea) containing 1% penicillin-streptomycin (P/S; 10,000 units/mL, Gibco/BRL, New York, NY, USA) and 10% (v/v) heat-inactivated fetal bovine serum (FBS; Hyclone, Logan, UT, USA). Total numbers of nucleated and viable cells were determined using a hemocytometer and trypan blue (Gibco/BRL, Gaithersburg, MD, USA) staining. Cells were incubated at 37℃ in a humidified 5% CO2 atmosphere and allowed to adhere for 72 hr. Non-adherent cells were then removed. The medium was changed twice a week. When cells were 80%-90% confluent, adherent cells were trypsinized (0.05% trypsin, Gibco/BRL) at 37℃ for 5 min and replated in 100-mm culture plates. After passage 3, a morphologically homogenous population of adherent cells was obtained. During this expansion, medium was changed every 4-5 days.
Immunofluorescence staining
MSCs that adhered to spot slide bottoms were fixed with -20℃ methanol (100%) for 5 min. Cells were then rehydrated in PBS for 5 min at room temperature, washed three times with PBS, blocked with 3% bovine serum albumin in PBS, and incubated overnight at 4℃ with SH2 (American Type Culture Collection [ATCC], Rockville, VA, USA) as a positive control. Primary antibody (SH2) was removed by washing three times with PBS, and cells were then incubated with fluorescein isothiocyanate (FITC)-labeled affinity-purified antibody to mouse IgG + IgM (H + L) (DiNonA Inc., Seoul, Korea) for 1 hr at room temperature. Secondary antibodies were removed by washing three times with PBS. Coverslips were mounted onto slides with a solution containing 50% PBS and 50% glycerol. Labeled cells were observed under an Axiovert 200 (Zeiss, Thornwood, NY, USA).
Flow cytometry
Flow cytometry was performed to determine MSCs positive for SH2. Cells were permeabilized with ice cold 75% methanol in PBS for 30 min at 4℃, and washed three times. A FITC-conjugated SH2 antibody (DiNonA), diluted 1:500 in PBS, was then added, and cells were incubated for 1 hr at 4℃. Cells were analyzed within 2 hr of staining using a flow cytometer (FACScalibur, Becton Dickinson, Bedford, MA, USA). A total of 1 × 10⁶ cells were collected for each measurement. Negative control samples were stained with an isotype-matched irrelevant mAb.
In vitro chondrogenesis
To induce chondrogenic differentiation, 200,000 MSCs were placed in a 15-mL polypropylene tube and centrifuged at 1,000 rpm for 5 min. Pellets were then cultured at 37℃ in 5% CO2 and 300 µL of serum-free chondrogenic medium consisting of Dulbecco's modified Eagle medium-high glucose (DMEM-HG, JBI) supplemented with 10 ng/mL of transforming growth factor-β3 (TGF-β3, R&D Systems, Minneapolis, MN, USA), 100 nM dexamethasone (Sigma-Aldrich, St. Louis, MO, USA), 50 µg/mL ascorbate-2-phosphate, 100 µg/mL pyruvate, and 50 mg/mL ITS + Premix (Becton Dickinson Biosciences, Bedford, MA, USA; 6.25 µg/mL insulin, 6.25 µg/mL transferrin, 6.25 ng/mL selenious acid, 1.25 mg/mL bovine serum albumin [BSA], and 5.35 mg/mL linolenic acid); the medium was replaced every 2-3 days for 3, 7, 14, or 21 days.
RNA preparation
Total RNA was extracted from undifferentiated MSCs and from pellets after 3, 7, 14, or 21 days of differentiation using RNeasy kits (Qiagen, Valencia, CA, USA), according to the manufacturer's instructions. And 1,200 µL of RLT buffer supplemented with beta-mercaptoethanol (10 µL/mL) was added to the washed cells. RNA integrity was assessed by gel electrophoresis and RT-PCR and concentrations were determined by measuring absorbance at 260 nm.
Microarray
Total RNA was processed using the Genesys Applied Biosystem Facility (Genesys, Munster, Germany), according to manufacturer's recommendations. Each RNA pool (2 µg) was labeled with Digoxigenin-UTP using the ABI Chemiluminescent RT-IVT Labeling Kit v 1.0. Double-stranded cDNA was prepared from total RNA. UTP-digoxigenin-labeled complementary RNA (cRNA) was synthesized by in vitro transcription. Labeled cRNA (10 µg) was hybridized to ABI Human Genome Survey Microarray v 2.0, which was then incubated with alkaline phosphatase-linked digoxigenin antibody. Phosphatase activity was then initiated to produce the chemiluminescent signal. Chemiluminescent (cRNA) and fluorescent (spot background) signals of the cRNA and standard control spots were then scanned. Chemiluminescent detection and image acquisition was performed using an Applied Biosystems 1,700 (AB1,700) Chemiluminescent Microarrays Analyzer, according to the manufacturer's instructions. Using the software supplied with the AB1,700 apparatus, the spot chemiluminescent signal was normalized over the fluorescent signal of the same spot to obtain normalized signal value. For inter-array normalization, global median normalization was applied across all microarrays (7).
Data analysis
Data analysis and data normalization were performed using the method described by Quackenbush (8). For background correction, the mean intensities of areas surrounding spots were subtracted from spot intensities (local area background). Data sets were normalized by dividing the mean intensity value of every spot (in duplicate) by sum of all spot intensities within a sample to eliminate experimental or data acquisition variations. Normalized data were used to calculate the gene expression level ratios of different culture stages. A two-fold expression cut-off was applied. For hierarchical gene cluster analysis, expression ratios were calculated for all genes as described by Eisen et al.(9).
Reverse transcriptase-polymerase chain reaction (RT-PCR)
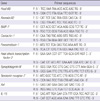
First strand cDNA was synthesized using reverse transcriptase (RT) and 1 µg of total RNA. Reactions were conducted in 20 µL of buffer containing; 0.5 µL oligo (dT)12-18 primer (Gibco/BRL, Grand Island, NY, USA), 50 mM Tris-HCl (pH 8.3), 75 mM KCl, 3 mM MgCl2, 40 mM DTT, 0.5 mM deoxynucleotide triphosphate (dNTP) mixture (Invitrogen, Carlsbad, CA, USA), 10 unit RNase inhibitor (Gibco/BRL), and 200 units of MMLV reverse transcriptase (Invitrogen). After incubation at 37℃ for 60 min, reactions were stopped by heating at 70℃ for 15 min. To remove remaining RNA, 1 µL of E. coli RNase H (4 mg/mL) was added to reaction mixtures and incubated at 37℃ for 30 min. cDNAs obtained were used as a template for PCR amplification using gene-specific primers for target genes and for glyceraldehyde 3-phosphate dehydrogenase (GAPDH). Primer sequences are listed in Table 1.
PCR amplification of cDNA was performed in an automated thermal cycler (GeneAmp PCR System 2,400, Applied Biosystems, Foster City, CA, USA), in a final volume of 25 µL containing; 4 µL of cDNA solution, 20 mM Tris-HCl (pH 8.4), 50 mM KCl, 1.5 mM MgCl2, 0.1% Triton X-100, 0.2 mM dNTP mixture, 0.4 pM of each primer, and 5 units of Taq DNA polymerase (Promega, Madison, WI, USA). After PCR, amplified products were analyzed by electrophoresis in 1.5% agarose gel and visualized by ethidium bromide staining under UV light illumination.
RESULTS
Cultures of human MSCs and their phenotypes
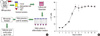
The in vitro growth pattern of MSC is shown in Fig. 1. Human bone marrow-derived MSCs were cultured and expanded. During the log phase of growth, cells proliferated with a population doubling time of 30 hr, and this growth period was followed by a confluent growth-arrested phase.
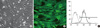
Colonies were examined approximately 7 days after initial plating. A morphologically homogeneous population of 90% confluent fibroblast-like cells was obtained after 2 weeks. The cells were replated into culture dishes and cultured for 2 weeks. The replated cells were used for subsequent experiments. The cultured MSCs were positive for SH2 by flow cytometry (Fig. 2).
Time course of BM-MSC chondrogenesis
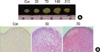
MSCs were pelleted into micromasses and differentiated in serum-free medium in the presence of TGF-β3 and dexamethasone. Immediately after centrifugation, the cells appeared as flattened pellets at the bottom of tubes. One day later, pellets had a thickened lip, and between days 2 and 3, pellet became spherical without any increase in size. Pellets then grew in size and pellet diameters increased to about 2-fold on days 7 and 14 (Fig. 3A).
Microarray data
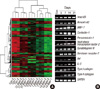
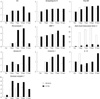
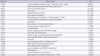
Using normalized microarray data, we identified 1,486 differentially expressed genes (Fig. 4A), which included 1,303, 121, 40, 20, and 2 genes exhibiting minimum 2 to < 5, 5 to < 10, 10 to < 20, 20 to < 70 and > 70-fold changes, respectively. To verify gene expression profiles determined by microarray analysis, the expression levels of 10 genes with high fold changes (2-48 fold changes, Table 2) were confirmed by RT-PCR.
Confirmation of gene expression by RT-PCR
The expression levels of the 10 genes selected (Hrad 6B, annexin A2, BMP-7, contactin-1, peroxiredoxin-1, heat shock transcription factor-2, synaptotagmin IV, serotonin receptor-7, Axl, and IL-15) were analyzed by RT-PCR, by using total RNAs obtained from 5 samples (Fig. 4B). The expression levels of 9 genes (Hrad 6B, annexin A2, BMP-7, contactin-1, peroxiredoxin-1, heat shock transcription factor-2, synaptotagmin IV, serotonin receptor-7, Axl) were low in undifferentiated cells and increased in differentiated cells by RT-PCR and microarray, but the expression pattern of IL-15 was different. Expression level of IL-15 tended to be decreased in microarray, but increased in RT-PCR (Fig. 5).
DISCUSSION
In this study, we determined gene expression profiles in differentiated chondrocytes and BM-MSCs. The microarray technology used did not allow quantitative comparisons between the expressional levels of different genes, but did allow us to compare fold changes with time and quantify differences in the expressions of multiple genes. Our results show the sequences for gene expressional changes during BM-MSC chondrogenesis. Microarray data showed that Axl, synaptotagmin IV, Hrad6B, peroxiredoxin-1, BMP-7, heat shock transcription factor-2, annexin A2, contactin-1 and serotonin receptor-7 expressions were maintained in differentiating BM-MSCs until day 14.
Axl is overexpressed in a number of tumors (10), and IL-15 is known to mediate the transactivation and upregulation of Axl with subsequent activation of PI3K/Akt and upregulations of Bcl-2 and Bcl-XL (11). On the other hand, synaptotagmin IV is required for the maturation of secretory granules in PC12 cells (12). Human homologues of yeast Rad 6 (Hrad6B) encode ubiquitin-conjugating enzymes, and is highly expressed in lung cancer cell. It has been reported that DNA repair and UV mutagenesis are defective in Saccharomyces cerevisiae rad6 mutant (13). Peroxiredoxin-1 is the most ubiquitously expressed member of the peroxiredoxin family, and is found in the cytoplasm, nucleus, mitochondria, and peroxisomes of many cell types (14). Furthermore, recent studies have reported high levels of peroxiredoxin-1 expression in the bovine bladder, seminal vesicles, testes, adrenal gland (15), and in the rat liver, skin, lungs and nervous system (14). The role of peroxiredoxin-1 in cell differentiation and proliferation suggests that it has a possible role in growth and development.
Recent studies have confirmed that BMP-7 is a strong chemotactic component in cartilage cells produced by mesenchymal stem cells, and it can promote cartilage cells to secrete specific extracellular matrix (proteoglycans and collagen type II). And BMP-7 can induce the differentiation of BM-MSCs into cartilage cells, and that it offers a greater efficiency in repairing cartilage and subchondral bone defects (16).
Heat shock transcription factor-2 (HSF-2) has been shown to be a transcriptional regulator of heat shock protein gene expression during the differentiation and development of eukaryotic cells in a tissue dependent manner (17). HSF-2 plays an important role in FGF-2 stimulated osteoclast formation, and HSF-2 deficiency was found to modulate gene expression in stromal/preosteoblast cells and affect osteoclastogenesis in the bone microenvironment (18). Annexins bind to negatively charged phospholipids in a Ca2+-dependent manner and have a conserved structure. The human annexin, annexin A2 (alternative names: annexin II, p36, and lipocortin II) is expressed abundantly in various human organs, including the placenta, lungs, heart, and liver (19). At the cellular level, annexin A2 is expressed on endothelial cell surfaces and acts as a co-receptor for plasminogen and tissue plasminogen activator (20). Furthermore, annexins are commonly dysregulated in cancer (21) and annexin A2 is upregulated in a variety of tumors and cancer cell lines (22, 23). Contactin-1 is a cell surface adhesion molecule, which is normally expressed by neurons, oligodendrocytes, and human astrocytic gliomas (24, 25). Previous studies have reported that MSCs express IL-15, essential hematopoietic growth factor (26, 27) and IL-15 is also a potent apoptosis inhibitor and has many immunomodulatory activities (28). The Serotonin receptor 7 is the most recently identified member of the serotonin receptor family and is found in brain, mainly in the hypothalamus, thalamus, hippocampus, and cortex (29).
In the present study, we performed microarray analysis during BM-MSC chondrogenesis in vitro. We found that over 1,486 genes were expressed by BM-MSCs during chondrogenesis, and we identified genes that were differentially expressed. These data may provide novel information of the genes involved in chondrogenesis of human BM-MSCs.
 XML Download