

 PDF
PDF ePub
ePub Citation
 Print
Print


INTRODUCTION
Nonalcoholic fatty liver disease (NAFLD) is characterized by fatty deposition in the hepatocytes of patients with minimal or no alcohol intake. As obesity and metabolic syndrome (MS) have become epidemic, NAFLD has become the most frequent type of liver disease (1). There are several possible reasons for fat accumulation in the liver. Metabolic derangement based on insulin resistance is the most acknowledged cause of fat accumulation, and is commonly associated with dyslipidemia, type 2 diabetes mellitus, and central obesity (2-5). Therefore, NAFLD has been considered as the hepatic manifestation of MS.
Serum uric acid (SUA) is the major end product of purine metabolism in humans; and the level of SUA is rigorously controlled by the balance between uric acid production and excretion (6). A number of previous studies have reported the relationship between hyperuricemia and various cardiovascular diseases and their risk factors, including MS. According to the earlier studies, not only frank hyperuricemia but also SUA levels almost within the normal range showed a positive correlation with MS (7).
Recent studies have shown that SUA level was significantly associated with NAFLD and elevated SUA level was an independent risk factor for NAFLD (8-10). In previous studies, researchers examined subjects with overt hyperuricemia. We hypothesize that there are similar associations within the normal range of SUA. To the best of our knowledge, no study has been performed so far to investigate the association of the normal level of SUA with NAFLD. Therefore, we explored the relationship between the presence of NAFLD and normal SUA levels by a cross-sectional study.
MATERIALS AND METHODS
Study population
In this study, 13,007 subjects older than 20 yr were screened for inclusion. All of these subjects voluntarily visited the health promotion center of Dongguk University Ilsan Hospital, Korea, for annual checkups between June 2007 and July 2009. The aim of the screening was to detect any metabolic diseases (such as diabetes, dyslipidemia) and cancers. The analysis for the present study was limited to 12,839 subjects who underwent abdominal ultrasonography, whose medical records were retrospectively reviewed. The subjects were considered eligible to participate in this study if they met all of the following criteria: an SUA level of ≤ 7.2 mg/dL for men and ≤ 5.7 mg/dL for women (the upper reference limit in our laboratory), a creatinine level of < 1.4 mg/dL (to rule out renal insufficiency), an alanine aminotransferase (ALT) level of < 70 U/L and a γ-glutamyltransferase (GGT) level of < 70 mg/dL (for eliminating the possibility of any other liver diseases), a thyroid stimulating hormone (TSH) level of 0.27-4.2 µIU/mL, a free thyroxine (free T4) level of 0.93-1.7 ng/dL, and negative tests for hepatitis B antigen and hepatitis C antibodies. Subjects meeting any of the following criteria were excluded from the study: any missing covariate information; those with an alcohol consumption of greater than 20 g/day for men and 10 g/day for women; those with a history of other known causes of chronic liver disease, such as viral hepatitis or autoimmune hepatitis, and on hepatotoxic medications; and those with a history of cancer, respiratory ailments, renal diseases, endocrine disorder, hepatobiliary diseases, or gout. Finally, 9,019 subjects (4,632 men and 4,387 women) were included in the final analysis of this study.
Clinical examination
All medical examinations were performed by trained staffs by a standardized procedure. Data on Health Habits Inventory and past or present medical history were obtained through a questionnaire survey. The questions related to alcohol intake were as follows: the type of alcoholic beverage consumed, frequency of alcohol consumption on a weekly basis, and amount of alcohol consumed daily. Smoking status was categorized into non-/ex-/current smokers. The participants were also inquired about the type and frequency of physical activity that they performed on a weekly basis. A regular exerciser was defined as a person who engaged in physical activities for more than 20 min per session, 3 times a week. Height and weight were measured using an automatic digital stadiometer (GL-150, G-TECH International Co., Uijungbu, Korea), with the subjects dressed in a light gown and standing barefoot. Body mass index (BMI) was calculated as weight in kilograms divided by height in meters squared. According to the World Health Organization (WHO) protocol (11), waist circumference (WC) was measured using a non-stretchable standard tape. Blood pressure was measured using the automatic clinical blood pressure monitor (TM-2655, A&D Co., Tokyo, Japan) while the subjects were seated comfortably after a rest period of at least 10 min. The participants were instructed to refrain from drinking coffee, smoking cigarettes, or engaging in strenuous exercise for 30 min before their blood pressures were measured.
Laboratory measurements
All blood samples were obtained from the antecubital vein in the morning after overnight fast and stored in plastic tubes. The samples were subsequently analyzed using an automatic chemical analyzer at a laboratory in Dongguk University Ilsan Hospital.
Detection of hepatic steatosis
In this study, hepatic steatosis was diagnosed by ultrasonography (Philips iu-22 Ultrasound Machine; Philips Medical Systems, Bothell, WA, USA) according to the conventional criteria (i.e., evidence of diffuse hyperechogenicity of liver relative to kidneys, ultrasound beam attenuation, and poor visualization of intrahepatic structure), based on the characteristic echo patterns (2). The ultrasonography was performed by 5 experienced radiologists who did not have access to the subjects' clinical or laboratory test findings and were unaware of the goal of the study. They diagnosed hepatic steatosis according to identical criteria; therefore, we assumed the intraobserver variability among them to be minimal. NAFLD in the patients was defined as having any degree of hepatic steatosis on abdominal ultrasonographic findings, with the aforementioned inclusion/exclusion criteria of alcohol consumption, viral, or autoimmune liver diseases.
Definition of metabolic syndrome (MS)
The diagnosis of MS was made on the basis of the revised National Cholesterol Education Program (NCEP) criteria, proposed by the American Heart Association/National Heart, Lung, and Blood Institute (AHA/NHLBI) (12). The WC cutoff was defined according to central obesity in Koreans (13). Therefore, MS was defined by the presence of any 3 or more of the following risk factors: 1) central obesity, with an WC ≥ 90 cm for men and ≥ 85 cm for women; 2) hypertriglyceridemia, with a triglyceride level of ≥ 150 mg/dL; 3) low high density lipoprotein cholesterol (HDL-C), with an HDL-C < 40 mg/dL for men and < 50 mg/dL for women; 4) elevated blood pressure, with a blood pressure ≥130/85 mmHg or antihypertensive medication; and 5) elevated fasting plasma glucose (FPG) level (FPG ≥ 100 mg/dL) or antidiabetic medication (insulin or oral agents).
Statistical analysis
Statistical analyses were performed using the Statistical Package for Social Sciences (SPSS) software package version 16.02 for Windows (SPSS Inc., Chicago, IL, USA). For the demographic and biochemical characteristics, the continuous variables were expressed as mean and standard deviation (SD), whereas the categorical variables were summarized into frequency and percentage. Independent 2-sample t-tests and chi-square-tests were used for the investigation of any association with NAFLD. The odds ratio (OR) and 95% confidence interval (CI) for the presence of NAFLD, according to the SUA quartiles and in the case of it being considered as a continuous value, were calculated after adjusting for confounding variables, using multivariate logistic regression models. The confounding variables were age, smoking habit, exercise status, BMI, blood pressure, FPG, total cholesterol, triglyceride, HDL-C, aspartate aminotransferase, ALT, and GGT. The association between MS and the SUA quartiles were examined using chi-square-tests as well as linear-by-linear association tests. All statistical tests were 2-sided and a P < 0.05 was recognized as the statistical significance level.
RESULTS
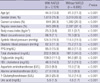
Table 1 presents the demographic and biochemical characteristics of the 9,019 subjects according to their NAFLD status. Among them, 2,124 (23.6%) subjects met the diagnostic criteria for NAFLD. The mean age and proportion of men was higher in the NAFLD group, and the group showed a high obesity index, more deranged metabolic profile, and elevated results of the liver-function test. In particular, significantly higher SUA levels were observed in the subjects with NAFLD than in those without NAFLD.
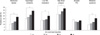
Fig. 1 shows that the prevalence rate of MS and components of MS increased with an increment in the SUA level. The exception was the relationship between an elevated FPG and the SUA level. The proportions of MS in each quartile were 9.7%, 11.5%, 14.2%, and 20.9%, respectively.
The prevalences of each component of MS, MS and NAFLD are shown in Table 2. MS was identified in 1,289 subjects (14.3%; 876 men and 413 women). The percentages of MS in subjects in the fourth and other quartiles of SUA level were 23.1% and 17.5% for men, and 18.8% and 6.2% for women, respectively. The percentages of NAFLD were 44.2% and 31.7% for men, and 22.3% and 7.9% for women, respectively. The presence of NAFLD and MS (including each component of MS) were found significant in the subjects with the highest SUA quartile. There was no significant association between an elevated FPG and the highest SUA quartile in men.
Table 3 shows the risk of NAFLD according to the SUA quartiles. After adjustment for age, components of MS and the liver-function test, the adjusted OR (95% CI) for the presence of NAFLD in the subjects with the highest SUA level was 1.46 (1.17-1.82) for men and 2.13 (1.42-3.18) for women, as compared to the subjects with the lowest SUA level. It was also significant for both genders in the case of the SUA level being considered as a continuous value.
DISCUSSION
Our findings proved that SUA concentrations, even within the normal range, were significantly associated with the presence of NAFLD. It is remarkable that those subjects of upper normal SUA range showed not only a more deranged metabolic profile, but were also at a higher risk for NAFLD. The results remained significant after adjustment for possible confounders. Therefore, we suggest that physicians should pay attention to the possibility of NAFLD in patients with upper range of normal SUA levels. To the best of our knowledge, this is the first study that demonstrates the relationship between normal SUA level and NAFLD.
The results of previous studies are consistent with those of our study. Some researchers demonstrated that SUA level is an independent risk factor for NAFLD in healthy adults and recommended it as an additional measure in assessment of the risk for NAFLD (9, 10). Their results are in overall accordance with the results of our study, but there are a few differences. First, the distribution of SUA concentration was not confined to the reference range. Although the 75% interquartile range (IQR) in their studies was equivalent to the upper normal SUA range in this study, however, multivariate analysis was not performed within the lower quartiles (Q1-Q3) in their studies. Lee et al. could not show the positive correlation between SUA (Q1-Q3) levels and the risk of NAFLD in women with a multivariate logistic regression analysis model. Second, our data excluded possible confounders, such as serum creatinine and ALT levels. Hyperuricemia can be caused by either the overproduction or underexcretion of uric acid, and 85%-90% of hyperuricemic patients in the general population show underexcretion of uric acid. ALT activity is known to be significantly correlated with increased fat accumulation in the liver (14), and NAFLD is the most common cause for unexplained persistent elevation of ALT levels (15). In addition, a small elevation of ALT levels (less than twice the normal value) may be of no clinical importance if the causes of chronically elevated aminotransferase levels, including hepatic steatosis, have been ruled out (16).
Several epidemiologic studies have shown that elevated SUA levels, including those within the normal range, could predict the increased risk of cardiovascular events (17, 18) or renal impairment (19). The most marked increase in cardiovascular death in healthy middle-aged men occurred at the SUA level of 5.21 mg/dL, and the risk of stroke in patients with type 2 diabetes increased steeply at the SUA median value of 4.96 mg/dL. The terms "normal range" or "reference range" have been used in similar circumstances, and are based on the values in apparently normal individuals from a certain area. The "reference range" can be altered depending on certain conditions. As a common example, the cutoff value for central obesity has been changed according to the times as well as the gender or ethnicity. This was based on the simple result that the OR for the having 2 or more components of metabolic syndrome increased abruptly at a specific point, which would be flexible at any time (13). We documented the independent associations between SUA concentrations within the normal range and the presence of NAFLD, and a higher prevalence of MS was also found in those subjects with high-normal SUA levels. We are of the opinion that elevated SUA, even within the normal range, can trigger the clinical suspicion of NAFLD and investigation for a potential coexistence of NAFLD should be carried out.
The most plausible explanation for the association between SUA and NAFLD, which has been inferred from the current understanding of the progression of NAFLD (20), would be the '2-hit' theory. Fat accumulation in the liver is the first "hit", which makes the hepatocytes more vulnerable to further damage due to certain triggers, such as insulin resistance, inflammation, excess alcohol consumption, and obesity. In this process, insulin resistance plays a central role in the vicious cycle, which promotes lipolysis of peripheral adipose tissue and increases free fatty acid influx into the liver. This insulin resistance leads to hyperinsulinemia, which increases uric acid synthesis and reduces the renal excretion of uric acid (21, 22). Nakagawa et al. (23) reported that a SUA level above 5.5 mg/dL independently predicted the development of hyperinsulinemia in nondiabetic patients with first myocardial infarction. The processes involved in the second "hit" are thought to be oxidative stress, subsequent lipid peroxidation, and an inflammatory response. SUA has been proved to be proinflammtory and an increased SUA level reflects the rate of cell turnover, which itself may be a part of the inflammatory process (24). Uric acid stimulates the synthesis of monocyte chemoattractant protein-1 and increases interleukin (IL)-6 and tumor necrosis factor-alpha (TNF-α) (25). Recently, Ruggiero et al. (26) confirmed a positive association between SUA and several inflammatory markers within the normal SUA range (2-7.5 mg/dL in men and 2-5.7 mg/dL in women) in subjects. The significant association with SUA between the high-normal range and NAFLD in our study population supports the concept that the 2 components shared the mechanisms of hyperinsulinemia and the inflammatory process, from the normal level of SUA.
There are several limitations to our study. First, we could not answer the question whether high-normal SUA level is a cause or an effect of NAFLD with this cross-sectional design. Further research is needed to clarify their interrelationship. Second, potential confounders of the SUA level, such as dietary pattern and the use of diuretics/β-blockers, were not considered. Third, we could not perform the gold standard liver biopsy for diagnosing hepatic steatosis. Another limitation was that we did not test intraobserver variability between the radiologists who performed ultrasonography. Nevertheless, ultrasonography is the most widely used modality in epidemiological studies for NAFLD, not only because it is non-invasive and easily available but also because its accuracy in detecting hepatic steatosis is acceptable (27). Finally, generalization of the present results should be considered with caution. Because the study subjects were visitors to a health promotion center, so they might be more health-conscious and wealthier than the general populations studied in community-based studies.
In conclusion, in the present study, increased uric acid concentrations, even within the normal range, were independently associated with the presence of NAFLD. This finding indicates that Korean adults with a high-normal uric acid level would be regarded as a group at an increased risk for NAFLD.


 XML Download