

 PDF
PDF ePub
ePub Citation
 Print
Print


INTRODUCTION
The subthalamic nucleus (STN) stimulation has become the preferred treatment for the patients with advanced Parkinson's disease (PD) who have intolerable drug-induced side effects or motor complications following the long-term use of dopaminergic drugs (1, 2). The precise positioning of the electrodes into the STN is important for the good clinical outcome after surgery (2). Many approaches including image fusion of CT-MRI, MRI-MRI, and MRI-brain atlas as well as intraoperative microelectrode recording and stimulation have been practiced for the precise targeting of electrodes (3-7).
However, not all the patients have their electrodes positioned exactly in the STN after surgery. Therefore clinical outcome may differ according to the electrode positions. Possible brain shift due to cerebrospinal fluid (CSF) leakage (8-10), electrode artifacts in the MRI (11), and possible electrode bending during the surgery may make it difficult to precisely localize the center of the electrodes at a short-term period after surgery (8-11). Thus it is reasonable to estimate the electrode positions at a stable period after surgery. However, little has been written in the literature on the clinical outcome and the electrode position estimated at a stable period after surgery.
Previously we compared the clinical outcomes at 3 and 6 months after bilateral STN stimulation with the electrode positions estimated by the fused images of the pre- and post-operative MRI taken at 6 months by using mutual information technique (12). During the study period we noted that the center of the electrode's MRI artifact in the postoperative MRI was different from the center of electrode estimated by the postoperative CT. Therefore we compared the outcomes at 6 and 12 months after bilateral STN stimulation depending on electrode positions identified in the fused images of the preoperative MRI and the postoperative CT taken at six months after surgery.
MATERIALS AND METHODS
Patients
Fifty-seven patients with advanced PD who had been treated with bilateral STN stimulation between March 2005 and October 2006 and followed up more than one-year at the Movement Disorder Center of Seoul National University Hospital (SNUH) were enrolled in this study. The indications of bilateral STN stimulation were advanced PD with at least two cardinal features of parkinsonism, a good response to levodopa, drug-induced side effects such as dyskinesia, or motor fluctuation, and the unsatisfactory management with medication. Patients with severe cognitive impairment, ongoing psychiatric problems, an unsatisfactory general condition for surgery, or an inability to comply with the study protocol, were excluded.
Clinical evaluation
The patients were evaluated with the use of the Unified Parkinson Disease Rating Scale (UPDRS), Hoehn and Yahr (H&Y) Stage, Schwab and England Activities of Daily Living (SEADL), the Short Form-36 Health Survey (SF-36), and neuropsychological tests (the detailed items were described elsewhere) (13). Evaluations were performed before surgery, at 6 and 12 months after surgery, and then every year. The neurological evaluations were performed by two neurologists. Patients were assessed in two conditions; off- (12-hr medication off) and on-medication (1 to 3 hr after usual morning dose) conditions. The daily levodopa equivalent dose (LEDD) was computed as described elsewhere (12). The clinical information of the 57 patients is summarized in Table 1.
Surgical procedure
In all cases, a stereotactic Leksell®-G frame (Elekta Instruments AB, Stockholm, Sweden) was mounted on the head of a patient under local anesthesia. Brain images were acquired on a 1.5-T Signa system (General Electric Medical System, Milwaukee, WI, USA). The STNs were localized by a combination of direct visualization by MRI, microelectrode recording (MER), and stimulation technique as previously described elsewhere (12). The quadripolar chronic electrodes (DBS 3389, Medtronic, Minneapolis, MN, USA) were indwelled under the local anesthesia and the implantable pulse generators (IPG) were then implanted subcutaneously under the general anesthesia in a single session.
Electrical stimulation was started one day after surgery. The stimulation parameters and medications were progressively adjusted using an N'vision® programmer (Medtronic) (12).
Adjustment after bilateral STN stimulation
An examination of the effectiveness and side effects of the four contacts of the electrodes was performed using an N'vision® programmer (Medtronic) in all patients to select the best contact of the electrodes and electrical settings for chronic stimulation by neurologists. After turning on the minimal stimulation starting at the lowest level around 1.0 volts, the medication and stimulation parameter were optimized to the demand for the best status of motor functions in harmony with the DBS programming.
Image fusion of preoperative MRI and postoperative CT
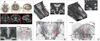
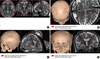
Three-dimensional (3-D) spiral stereotactic CT scans (64-channel Brilliance CT, Philips, Eindhoven, Netherlands) with a 1 mm slice thickness were taken 6 months after bilateral STN stimulation to localize the electrodes by image fusion with preoperative MRI by using mutual information techniques (Fig. 1) (12, 14-18). With CT-MRI image fusion, the electrodes positions were plotted on the human brain atlas of Schaltenbrand and Wahren (19). In brief, the lateral distance from the midline and the antero-posterior distance from the mid-commissural line to each electrode were measured in the reformatted axial images (Fig. 1A). The lateral angles of the electrode trajectory from the midline, and the antero-posterior angle of the electrode trajectory from the line perpendicular to the anterior (AC) - posterior commissural (PC) line and the depth of the electrodes are also measured in the reformatted coronal (Fig. 1B) and sagittal images (Fig. 1C), respectively.
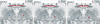
Based on the plotted electrode position on the axial view at the level of 3.5 mm below the AC-PC line, we categorized the electrode positions into three groups: 1) group I, both electrodes in the STN (n = 36); 2) group II, only one electrode in the STN (n = 16); 3) group III, neither electrode in the STN (n = 5) (Fig. 2). The clinical information of the patients in each group is summarized in Table 1.
Statistical analysis
The primary outcome measures were the total scores and part III scores of the UPDRS; the H&Y stage; the SEADL; the dyskinesia subscores on part IV of the UPDRS; the LEDD; the SF-36; and neuropsychological tests. The secondary measures were the subscores on the part III of the UPDRS. The data for those variables were presented as the mean ± standard deviation. Repeated measured ANOVAs were performed to observe the within-factor effect of 3 times measured at the baseline before surgery and 6 and 12 months after surgery and the between-factor effect of 3 groups (group I, II, and III) classified by the electrode positions in STN on the averages of clinical outcomes with scores.
For the baseline characteristics of the 57 patients, one-way ANOVA and chi-square or Fisher's exact test were conducted to find the 3-group differences in the distribution of continuous variables and in the frequency of discrete variables, such as gender. To adjust for multiple comparisons within each outcome, we computed P values on Bonferroni correction of each outcome. All statistical analyses were used in SAS version 9.1 (SAS institute, Cary, NC, USA).
RESULTS
Primary outcome after bilateral STN stimulation
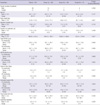
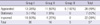
The outcomes were compared between preoperative and postoperative status at 6 and 12 months after bilateral STN stimulation (Table 2). Significant improvement in off-time scores of total UPDRS, UPDRS III, H&Y scores, SEADL, and dyskinesia disability with decreased LEDD was observed at 6 and 12 months after surgery in the group I and II or as a whole group. The LEDD tended to be low in the patients of group I at 6 and 12 months after surgery (844.6 ± 364.1 at baseline; 279.4 ± 274.6 at 6 months; and 276.0 ± 301.6 at 12 months; P-interaction = 0.023).
Regarding the eight sub-scales of the SF-36, the scores of bodily pain and summary scores of physical health improved at 6 and 12 months after surgery in the patients as a whole group. From the neuropsychological evaluation, the verbal memory test using Rey-Kim memory battery showed the decline in recognition at 6-month follow up in the patients as a whole group (P = 0.002), whereas nonverbal memory showed no meaningful change. In frontal lobe function tests, the Stroop test (Stroop-a, P = 0.006; Stroop-b, P = 0.004; Stroop-c, P = 0.034) and the fluency test (P = 0.013) tended to aggravate at 6 and 12 months after the surgery, especially in the group III (P = 0.046 for Stroop-a; P = 0.053 for fluency), but lacked statistical significance after a Bonferroni correction. Other tests including Boston Naming test, Grooved Pegboard test, Mini-Mental state examination, Trail-Making test, Beck Depression Inventory, and Wisconsin Card Sorting test, did not show significant changes.
The average stimulation parameters of the patients as a whole group are 2.6 V (± 0.6 V) in amplitude, 60.6 µsec (± 4.4 µsec) in pulse width, and 139.1 Hz (± 15.7 Hz) in frequency. The average stimulation parameters of the patients in group I are 2.6 V (± 0.6 V) in amplitude, 60.5 µsec (± 3.8 µsec) in pulse width, and 137.6 Hz (± 15.2 Hz) in frequency. The average stimulation parameters of the patients in group II are 2.6 V (± 0.6 V) in amplitude, 61.3 µsec (± 6.1 µsec) in pulse width, and 142.0 Hz (± 17.0 Hz) in frequency. The average stimulation parameters of the patients in group III are 2.2 V (± 0.9 V) in amplitude, 60.0 µsec (± 6.0 µsec) in pulse width, and 140.5 Hz (± 16.2 Hz) in frequency.
UPDRS part III subscores after bilateral STN stimulation
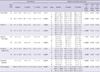
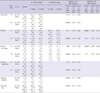
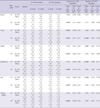
The subscores of UPDRS III were compared between preoperative and postoperative status at 6 and 12 months after bilateral STN stimulation (Table 3). The off- and on-time tremor and rigidity, the off-time bradykinesia, the off-time gait and postural stability subscores significantly improved at 6 months and 12 months after surgery in the group I and II or as a whole group.
The off-time UPDRS III spe ech subscore significantly improved at 6 and 12 months after STN DBS in the group I (1.6 ± 0.7 at baseline vs 1.3 ± 0.8 at 6 and 12 months; P < 0.01 by paired t-tests) (P-interaction = 0.008). But no significant improvement was observed in other groups. We further confirmed the speech improvement by comparing the sum of the speech subscores of UPDRS-II and UPDRS-III between preoperative and postoperative status at 12 month after STN DBS in three groups (P for trend = 0.003) (Table 4).
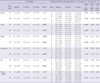
Outcomes of 13 patients with nil LEDD after bilateral STN stimulation
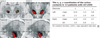
Among 57 patients, the LEDD of 13 patients was zero at their last follow up. Their preoperative characteristics were not different from the other patients. Their total UPDRS scores, H&Y Stage, SEADL, and dyskinesia disability scores dramatically improved at 12 months after STN DBS (Table 5). Their off-time UPDRS part III subscores including speech were significantly improved at 12 months after surgery (Table 6). Looking into their electrode position, all patients have both electrodes mostly positioned into middle one third of the STN on axial view at the level of 3.5 mm below the AC-PC line (Fig. 3A). The x, y, z coordinates of the active contacts referenced to the AC-PC midpoint in these patients are depicted in Fig. 3B. The mean (SD) x, y, z coordinates of active contacts were 12.6 (1.5), -1.2 (1.0), and 3.6 (0.9) on the left electrodes and 12.0 (1.8), -0.5 (0.9), and 3.7 (1.1) on the right electrodes.
Complications
Thirteen (22.8%) of 57 patients had complications after surgery. Transient confusion and abulia was the most common (7.0%) followed by transient dysarthria (5.3%). Two patients (3.5%) had wound infection, one in the scalp and the other in the left subclavicular area which was well controlled with antibiotic therapy. Intracerebral hematomas were found in two patients (3.5%) on immediate postoperative CT scans, which were asymptomatic. Other complications were seizure (1.8%), transient hypophonia (1.8%), transient restless leg syndrome (1.8%) and permanent personality change (1.8%).
DISCUSSION
Most studies in the literature correlated the clinical improvement with the localization of the electrodes determined by the fused images of preoperative and postoperative brain CT or MRI taken at the immediate postoperative period (5, 15, 20-26). But the immediate postoperative imaging make it difficult to precisely localize the center of electrodes in relation to the STN because of brain shift due to CSF leakage at the immediate postoperative period or the electrode artifacts caused by the electrode-induced magnetic inhomogeneity (8, 9-11). Miyagi et al. confirmed the significant contralateral brain shift in the unilateral procedure and posterior shift in the bilateral procedure by comparing the three-dimensional coordinated of the AC and PC on MRIs before and after implantation of the electrodes (10). Khan et al. (9) reported a shift of deep brain structures up to 4 mm after the surgery. Halpern et al. (8) reported posterior shift of the deep brains structures had impacted the number of microelectrode tracks to optimize STN targeting.
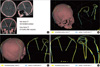
Kim et al. (27) found that there was a significant discrepancy in the implanted electrode positions between the immediate postoperative period and six months after DBS surgery in 53 patients with Parkinson's disease. The considerable discrepancy of electrode position between the immediate postoperative CT scan and the brain CT taken at 6 months after surgery makes it difficult to precisely localize the center of the electrode with the fused images of preoperative MRI and the immediate postoperative CT scans (Fig. 4).
Martinez-Santiesteban et al. (11) found that image artifacts in 2.0 Tesla MRI produced by microelectrodes were highly dependent not only on the magnetic susceptibility of the materials used but also on the size, shape and orientation of the electrodes with respect to main magnetic field. Lee et al. (28) compared the X-, Y-, Z- coordinates of the center of the electrodes estimated by MRI and CT in 61 patients who had taken both MRI and CT at least six months after bilateral STN DBS to validate the accuracy of MRI in electrode localization in comparison with CT scan. They found that the electrode location evaluated by postoperative MRI had significant discrepancy with the location estimated by brain CT scan. The artifacts caused by the electrode interference of local magnetic field makes it difficult to precisely localize the center of the electrodes in MRI (Fig. 5).
As in the previous studies (12), we observed that the improvement of symptoms, the LEDD, the neuropsychological changes other than speech and stimulation side effects did not vary significantly between the patients of group I and group II in this series. Although the number of the patients was too small to get a statistical significance, there was a good deal of symptomatic improvements after surgery even in the patients of group III. This suggested that there is a significant target volume in the region of the STN that provides equivalent clinical efficacy, which is comparable with the report that McClelland et al. (26) had described. They suggested that a DBS electrode placed anywhere within 6-mm-diameter cylinder centered at the presumed middle of the STN might result in similar clinical efficacy.
In this study the best symptom relief including speech with a reduced LEDD was observed in the patients whose electrodes were accurately positioned in both STN. There are debates regarding the surgical outcome of speech after bilateral STN stimulation (1, 29, 30). In this study, patients of group II or III had speech deterioration after bilateral STN stimulation more commonly than those of group I. Such speech deterioration was reversible when turning off the stimulation. The patients whose electrodes were positioned medial to the STN experienced speech deterioration more frequently.
The average LEDD at 6 and 12 months after STN stimulation was lower in the group I than in the group II or III in this study. The LEDD was zero at their last follow up in a subgroup of 13 (36%) patients in 36 patients of group I. This subgroup of 13 patients had significant clinical improvement in sub-scores of UP-DRS part III including speech at the last follow-up more than one year after surgery. These 13 patients had their stimulation electrodes mostly positioned within the middle one third of both STN on the axial view at 3.5 mm from the AC-PC line (Fig. 3).
This study has several limitations. First, we categorized the electrode positions into three groups based on the plotted electrode position on the axial view at the level of 3.5 mm below the AC-PC line in the human brain atlas of Schaltenbrand and Wahren (19). We assumed that the patient's brain would conform to the atlas with adjustment of the length of AC-PC line and size of the third ventricle. However, there might be a discrepancy between the real location of the electrodes in the individual brain and the location of the electrodes plotted in the human brain atlas confirmed to the patients. Second, we did not take the depth and trajectory of the electrodes into consideration to assess the thorough information of all four contacts in relation of the STN. We need further studies to assess four contacts of DBS electrodes in relation to the STN to recognize the best anatomical structures such as dorsal STN or zona incerta for the modulation of each specific motor symptom. Third, it needs further long-term follow-up in the estimation of clinical outcome in correlation with electrode positions identified on the CT-MR fused images.
So far little has been reported in the literature regarding the clinical outcome up to one year according to the electrode positions estimated at a stable period after bilateral STN stimulation as in this study. The patients of group I, especially whose electrodes were located in the middle one third of both STN at 3.5 mm below the anterior-posterior commissural line, had better outcome in speech with least LEDD than two other groups. Our findings suggest that the better symptom relief including speech with a reduced LEDD is expected in the patients whose electrodes are accurately positioned in both STN.
 XML Download