

 PDF
PDF ePub
ePub Citation
 Print
Print


INTRODUCTION
The activation of oncogene and the inactivation of anti-oncogene are two basic molecular biological events in the development of malignant tumors. Pim-2 is a newfound oncogene and its protein product belongs to the serine/threonine kinase Pim (proviral integration of Moloney virus) family (1). It has a strong effect on inhibiting the apoptosis of tumor cells without cell specificity, thus plays an important role in the development of several kinds of tumors such as lymphoma, leukemia, multiple myeloma and prostatic carcinoma, etc. (1-3). Recently, the researches on Pim-2 are mainly limited in lymph and hematopoietic system (4, 5). There are few reports focusing on the relationship between Pim-2 and hepatocellular carcinoma. It has been proved that both growth factors and glucose are needed in the anti-apoptotic effect of Pim-2 (1, 6), and it is well known that liver has dual blood supply which can offer abundant growth factors and glucose. What's more, our previous studies have found that the expression level of Pim-2 mRNA and protein were significantly higher in hepatocellular carcinoma tissues than that in normal liver tissues (7). Based on these findings, we presumed that Pim-2 may take part in the tumorigenesis of hepatocellular carcinoma. In our experiment, Pim-2 gene was successfully transfected into the nontumorigenic human liver cell line L02. And the biological behaviors of the transfected cells were detected. We expected to confirm that the non tumorigenic human liver cell line L02 could be malignantly transformed when Pim-2 was over expressed. It would be supportive to our previous hypothesis that Pim-2 takes part in the tumorigenesis of hepatocellular carcinoma.
MATERIALS AND METHODS
Cell culture and transfection
Three groups of cells were set up in our experiment: L02 cells transfected with Pim-2 gene (L02/Pim-2, group A), L02 cells transfected with empty-vector (L02/vector, group B), the non tumorigenic human liver cell line L02 (L02, group C). The construction of the eukaryotic cell expression vector pCI-neo-Pim-2 and the transfection were performed as described previously (7). Each group of cells were cultured in the RPMI 1640 medium containing 10% betal bovine serum (FBS) and 50 µg/mL Ampicillin at 37℃ with 5% CO2 for 20 generations.
Reverse transcription PCR
Total RNA was extracted from each group of cells respectively using SV total RNA isolation kit (Promega, USA). The integrality of the total RNA was verified by electrophoresis. Specific primers for Pim-2 and GAPDH were synthesized according to the published sequences: Pim-2 forward 5'-ATGTTGACCAAGCCTCTACA-3', reverse 5'-TTAGGGTAGCAAGGACCAGG-3'; GAPDH forward 5'-CGGGAAACTGTGGCGTGAT-3', reverse 5'-CAAAGGTGGA-GGAGTGGGT-3'. The constituents of the reaction system were listed as below: MgCl2 (25 mM) 10 µL, 10×RNA PCR buffer 5 µL, RNase free deionized water 19 µL, dNTP mixture (10 mM) 5 µL, RNase inhibitor (40 U/µL) 1 µL, AMV retroviridase (5 U/µL) 1 µL, AMV-Optimized Taq (5 U/µL) 1 µL, Pim-2 forward primer (20 pM/µL) 2 µL, Pim-2 reverse primer (20 pM/µL) 2 µL, total RNA sample 4 µL, and the total bulk volume were 50 µL.
The reverse transcription reactions were carried out at 50℃ for 30 min, and then the reaction system were heated to 94℃ for 2 min, followed by a course of 35 cycles with 94℃ for 30 sec, 55℃ for 30 sec and 72℃ for 1 min in each cycle. After the last cycle, a final extension step was taken at 72℃ for 7 min. Finally, the RT-PCR products were electrophoresed on 1% agarose gels and quantified by UVP gel analysis system. The experiment was repeated three times for each group.
Immunocytochemistry
Each group of cells was inoculated on a cover slip respectively, fixed with 4% paraformaldehyde for 30 min and washed with phosphate buffered solution (PBS). In order to inactivate endogenous peroxidase, the cells were incubated with 3% H2O2 for 10 min and then washed with PBS. Then goat serums were added in order to reduce nonspecific binding. Cells were incubated with goat-anti-human Pim-2 polyclonal antibody (1:200) (sc-13675, Santa Cruz Biotechnology) at 37℃ for 1 hr and washed with PBS. Then secondary antibodies were added and kept at 37℃ for 0.5 hr followed by a washing with PBS. Stept Avidin Biotin Complex was added next and kept at 37℃ for 30 min. Then the cells were washed with PBS and diaminobenzidine coloring reagent was added. The cover slips were dyed with hematoxylin and dehydrated with alcohol, then cleaned in xylene and mounted with gum. Finally, the results were observed under microscope. The experiment was repeated three times for each group.
Cell morphology observation
Each group of cells was incubated respectively until 80% areas of the culture plate were covered. Then the medium was poured out and the cells were washed with PBS. Finally, the morphology of the cells was observed under the inverted microscope. The experiment was repeated three times for each group.
Analysis of the cell migration rate
Millicell rooms (Millipore) were used for cell migration ability assay. There were upper layer and lower layer in the Millicell room with a membrane in the middle which had micro-holes for cells to pass. The counts of the migrated cells in a certain period of time could be regarded as their migrating ability. Each group of cells was cultured in the RPMI 1640 medium with 10% FBS and then transferred into another RPMI 1640 medium without FBS. After 24 hrs' incubation, the supernatant of the culture fluid was collected and cryopreserved as conditioned medium for later use. The optimal time point for detecting was set at 4-hr according to preliminary experiment. Three Millicell rooms were prepared for each group of cells. The cell density was adjusted to 105/mL. 100 µL cell suspension were added into the Millicell room and 500 µL conditioned medium were added outside. Four hours later, the Millicell rooms were taken out and washed with PBS. Then the samples were fixed by 2% glutaraldehyde (GA) for 30 min and stained with Giemsa for 10 min. The cells in the upper layer of the microporous membrane were removed and the cells in the lower layer were counted under the inverted microscope. The experiment was repeated three times for each group.
Analysis of cell proliferation level
The cells was digested with 0.25% trypsin digestion and made into cell suspension of 2×10⁴/mL. Two hundred µL cell suspension was added into each hole of the cell culture plate, 6 holes each group. Five pieces of such cell culture plates were prepared for and placed in the incubator at 37℃ with 5% CO2. Five time points were set as 24 hr, 48 hr, 72 hr, 96 hr, and 120 hr after the incubation. Five plates were taken out respectively at five different time points, one plate each time. Twenty µL methyl thiazolyl tetrazolium (MTT) was added into each hole away from light when each plate was taken out and then placed back into the incubator for 4 hr. Then the fluid in each hole was removed completely and 150 µL dimethyl sulfoxide was added in. Optical density of each sample was assayed by spectrophotometer at the wave length of 570 nm. Finally, the cell growth curve of each group was drawn on the base of the optical density data.
Analysis of cell apoptosis rate
After incubation for 48 hr, each group of cells was harvested and digested by 0.25% trypsin digestion. Then the cells were made into single cell suspension together with PBS and centrifuged 3,000 rpm for 5 min. The cell density was adjusted to 106/mL. one mL cell suspension was put into a tube and centrifuged, and the supernatant was removed. The cells were washed with cold PBS twice and then suspended in 200 µL buffer. Ten µL Annexin V-FITC and 5 µL propidium iodide were added into each cell centrifugation tube and the reaction was developed away from light at room temperature for 15 min. Then 300 µL buffers were added in and the apoptosis rates of the cells were detected by flow cytometry (FCM). The experiment was repeated three times for each group.
Carcinogenic ability assay
15 male athymic mice were purchased from the experimental animal center of Chongqing Medical University and were randomly divided into 3 groups with 5 mice in each group. The three groups of cells were respectively digested with trypsinization and centrifugated by 1,200 rpm for 5 min. The cells were then suspended with PBS and the density were adjusted to 107/mL. Each group of cells was accordingly inoculated to one group of athymic mice and each mouse was subcutaneously injected with 0.2 mL cell suspension at the right hind limb. The diameters of the mass which appeared in the athymic mice several days after the inoculation were measured twice a week. The volume of the mass was calculated according to the following formula: Volume (V)=A×B×C (A, B and C stand for the length, width and height of the mass respectively). Finally the tumor mass were cut down and made into different sections routinely according to different demands, and then observed under light microscope and transmission electron microscope (TEM) respectively. All animals received appropriate care in our experiments.
Statistical analysis
The experimental data were analyzed using the SPSS 13.0 software package. Average values were expressed as an arithmetical mean±standard deviation. The comparison between two groups was assessed by Student's t test. P values less than 0.05 were considered to be statistically significant.
RESULTS
The expression level of Pim-2 mRNA and protein
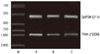
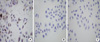
In the RT-PCR result (Fig. 1), the band gray value represents the mRNA level of the corresponding cell group. We could see that Pim-2 mRNA is expressed in all the three groups of cells, but the expression level is obviously higher in L02/Pim-2 group than those in the other two groups. In the immunocytochemistry results (Fig. 2), Pim-2 protein is stained as buffy materials. We could see that Pim-2 protein is expressed in L02/Pim-2 group but not in the other two groups.
Malignant changes in morphology, migrating rate, proliferation rate and apoptosis rate
In the early days after transfection, both L02/Pim-2 cells and L02/vector cells had no obvious change in their shapes. But after culturing for 20 generations, some differences were found. L02/Pim-2 cells were irregular fusiform of different size; and many small protuberances were observed (Fig. 3A), while L02/vector cells still had no obvious change in shape (Fig. 3B). The shapes of L02 cells were always regular polygon or ellipse in concordant size constantly (Fig. 3C).
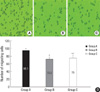
In the migration ability analysis, the average number of the migrated cells is 95.1±4.75/HP in L02/Pim-2 group (Fig. 4A), while 72.2±5.67/HP in L02/vector group (Fig. 4B) and 75.0±6.57/HP in L02 group (Fig. 4C). Compared with the controls, much more cells in the L02/Pim-2 group migrate through the microporous membrane within the same time period. The statistical data also show significant difference between L02/Pim-2 group and the other two groups (P<0.05), but no significant differences between the L02/vector group and the L02 group (Fig. 4D).
In the proliferation level analysis, the detailed OD570 values of the different cell groups in different time points are shown in Table 1. We could see that no significant differences in the OD570 value were found among the three groups of cells during the first day. In the next four days, the OD570 value of the cells in the L02/Pim-2 group significantly increased compared with those in the other two groups (P<0.05), but no significant differences were found between the L02/vector group and the L02 group.
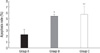
In the apoptosis rate analysis, the FCM results (Fig. 5) show that the apoptosis rate is 2.3±0.9% in L02/Pim-2 group, while 5.5±0.4% in L02/vector group and 5.7±1.5% in L02 group. The statistical analysis showed significant difference between L02/Pim-2 and the other two groups (P<0.05), but no significant difference between the L02/vector group and the L02 group.
Production of carcinoma in athymic mice
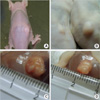
Nine days after the inoculation, a neoplastic mass was firstly found in one athymic mouse which was inoculated with L02/Pim-2 cells, and neoplasmas were found in all the 5 athymic mice of this group 21 days after the inoculation, with the average volume of 0.6×0.5×0.3 cm (Fig. 6). But no mass was found in the mice inoculated with L02/vector cells or L02 cells throughout our experiment (data not shown).
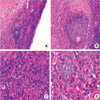
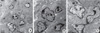
The histology of the mass under light microscope shows obviously disordered structure with large areas of necrotic tissue. The cells have marked cellular atypia, with giant nucleus, augmented karyoplasmic ratio, clear chromatospherite and prevalent mitosis, especially pathological mitosis (Fig. 7). Observed under the transmission electron microscope (TEM), the neoplastic cells have diverse sizes and irregular shapes. More smooth endoplasmic reticulum (SER) and fewer giant mitochondria are found in the cytoplasm. The nuclei become large and irregular with profound umbilication and multi-euchromatin. Large chromatospherite or even multiple nucleoli are also found (Fig. 8).
DISCUSSION
As a precondition of the whole experiment, the relative high expression level of Pim-2 mRNA and protein in L02/Pim-2 cells proved that our transfection was successful and that ectopic Pim-2 could be stably expressed in L02/Pim-2 cells. As a pathological common sense, the morphologic changes of the L02/Pim-2 cells found in our experiment indicated an increased mobility, and the following migration ability experiment confirmed this inference. Increased mobility could be regarded as an evidence for malignant transformation trend. Our results also found that L02/Pim-2 cells had high proliferation rate and low apoptosis rate. This could be regarded as another evidence. Finally, we found that only L02/Pim-2 cells could produce neoplastic mass in athymic mice. What's more, the histology of the neoplasm were coincident to that of malignant tumors. This could be regarded as the most direct evidence. Based on these findings, it was believed that ectopic overexpression of Pim-2 could induce malignant transformation of nontumorous human liver cell line L02 cells. This conclusion is supportive to our previous presumption that Pim-2 may take part in the tumorigenesis of hepatocellular carcinoma, and was in accordance with the researches on Pim-2 in lymph and hematopoiesis system tumors (8-10).
In this experiment, we presented a series of phenomenon to prove that Pim-2 could induce malignant transformation of nontumorous human liver cell line L02 cells, but we haven't got the detailed mechanism. There is no doubt that clarifying the signal transduction pathway of Pim-2 in hepatoma cells would provide more affirmative evidence for our presumption.
Bad is a proapoptosis protein which belongs to Bcl-2 family. It is the only known phosphorylation substrate of Pim-2 kinase up to now (11). Pim-2 could phosphorylate Bad at multiple sites such as ser112, ser136 and ser155, etc. and different phosphorylat ion site plays different role in the anti-apoptotic effect (12). Recently, a new research has found that Apoptosis Inhibitor 5 (API-5) has a conserved sequence "RXRHXS" with Bad, and this conserved sequence is just the recognition site of Pim-2 kinase (13). Thus API-5 is now regarded as another possible substrate of Pim-2. What's more, API-5 has been reported to be involved in the tumorigenesis of hepatocellular carcinoma (14). Based on these findings, API-5 can be presumed as another probable downstream target of Pim-2 in hepatocarcinoma cells.
Another finding in lymphoma cells reports that the malignant transformation of lymphocyte by Pim-2 is dependent on NF-κB, and the anti-apoptotic effect of Pim-2 could be totally inhibited by NF-κB specific inhibitor (15). Pim-2 could activate NF-κB through a series of phosphorylation reactions. It is well known that NF-κB is an important transcription factor (16). It can induce the transcription of several anti-apoptotic genes such as Bcl-2 and Myc, etc. (17). Different upstream stimulating signals could activate different transcription products, thus finding the key downstream factor of Pim-2 becomes the focus.
Based on the related experimental results listed above, we have probed the relationship between Pim-2, NF-κB, and API-5 in order to clarify the detailed anti-apoptosis mechanism of Pim-2 in hepatocellular carcinoma. From the results of the clinical tissue experiments, we found that all the three factors were highly expressed in hepatocellular carcinoma tissues but lowly expressed in paired noncancerous liver tissues and normal liver tissues. The same results were found in cell experiments. What's more, NF-κB specific repressor could inhibit the expression level of both NF-κB and API-5, but has no effect on Pim-2. The cell apoptosis rate is finally decided by the expression level of API-5 other than Pim-2. Therefore, we could preliminarily draw the conclusion that Pim-2 could activate API-5 to inhibit the apoptosis of liver cells, and NF-κB is the key regulator (18). This result support our presumptive mechanism that Pim-2 could induce malignant transformation of nontumorous human liver cell line L02 cells.
As a matter of fact, the anti-apoptotic mechanism of tumor cells is performed by several anti-apoptotic factors. The anti-apoptotic pathways in the cells are just like a net and Pim-2 is only one point on the net. So there may be complex relationships between Pim-2 and its neighbors. It has been reported that many oncogenes could affect the anti-apoptotic effect of Pim-2, such as Akt, Bcl-2, Myc, and p53 (11, 12, 19, 20). Besides, there must be certain relationship among the members in Pim family (21-24). Some researchers have found that Pim-1 is involved in the tumorigenesis of prostate cancer (2) and Pim-3 is reported to take part in the tumorigenesis of liver cancer too (25). The possible interaction between Pim-2 and these oncogenes in the process of hepatoma tumorigenesis also needs further study. It is believed that further research of anti-apoptotic pathway by Pim-2 will be beneficial to illuminate the pathogenesis of liver cancer.


 XML Download