

 PDF
PDF Citation
 Print
Print


INTRODUCTION
Disability evaluation typically requires an assessment of the activities of daily life (ADL) and instrumental ADL (I-ADL). In Japan, a physical disability certificate is based on the patient's ADL and I-ADL grades.
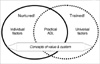
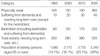
The independent ADL scale, which is widely considered within the field of rehabilitation medicine to be a particularly important component in the evaluation (1, 2), considers both individual and universal factors (Fig. 1). Assessment is performed by analyzing the results of test activities relating the patient's personal life. For example, adult independence refers to a person who does not require external care in daily life, whereas child independence includes care within the family and school life. Such personal factors have been nurtured through development in the community and belong to the community's values and customs. The universal factors, on the other hand, are measured against the common rule of humanbeings. Furthermore, disability evaluation should also include assessment for the supporting system in the community-based rehabilitation (CBR) and other problems. These other problems, which relate to objective signs, the timing of evaluation and multiple impairments, are still under fierce debate.
Generally, it is accepted that disabilities differ from impairment to impairment. In addition, the needs of patients vary by disability types. As such, Japan officially recognizes three forms of the identification booklet for the disabled, one for physical disability, one for mental disability, and another for psychological disability.
MATERIALS AND METHODS
During the course of this investigation, several reports issued by the Ministry of Health, Labor and Welfare of Japan, including the Outline of the Systems and Basic Statistics in Annual Reports on Health and Welfare 1998-1999 Social Security and National Life from white paper and reports were reviewed (3). Data concerning the annual change in the number of people with physical disabilities by type and age per 1,000 people were used to analyze total disability evaluation, while the annual change in the number of children with physical disabilities by type and age was used to analyze child disability evaluation. The number of people with physical and mental disabilities was used to determine the relationship between welfare facilities and the home in the community. Finally, several data related to the elderly were used to anticipate bigger problems in future.
RESULTS
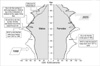
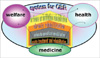
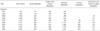
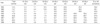
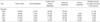
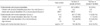
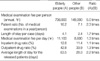
The results of this study, as provided in detail in the appendices to this report, are summarized as follows. Recent trends in the last 10 yr suggest a sharp rise in physical disabilities and internal disorders among the elderly (Table 1, 2). Data on children by type (Table 3) and age (Table 4) shows an increase in the rate of internal disorders and young children with physical disabilities. Data on the overall number of people with disabilities (Table 5) reveals that 28.5% of patients in health care facilities have mental retardation, whereas only 5% have physical disabilities. Data suggesting bigger future problems for the elderly are also presented in Fig. 2 and Table 6 and 7. Finally, the Japanese definition of CBR is presented in Fig. 3, with a framework of CBR shown in Fig. 4.
DISCUSSION
In Japan, disability is categorized under three identification booklets: 1) physical disability, which is classified by four subgroups, 2) mental disability, and 3) psychological disability.
The classification of the physically disabled subgroups (Table 1-4) was very useful for determining the problems for government policy on welfare and public health. The increasing rate of internal disorders within the physically disabled has become a major theme for following global welfare services in the future. A multi-system for evaluating disabilities has resulted in many welfare services, depending on the various kinds of disabilities. However, the achievements of the welfare system, based on different types of disabilities, have led to a complex or confused service system. The system has also been affected yearly by the changing social community around persons with disabilities. For example, the data showed a sharp rise in the elderly with disabilities. Accordingly, the increasing ratio of the elderly population has prompted the development of a new disability evaluation related to practical ADL. To cite another example, mental disability has been evaluated from infancy because of a lack of social response. As such, most people with mental disability usually tend to receive the identification booklet up to the age of 18 yr. However, Table 5 shows that, in Japan, adults with mental disability tend to be less adaptive to the community than those with physical disability. Therefore, the Ministry of Health, Labor and Welfare of Japanese Government has started to rearrange many welfare services to be more suitable to a small community around persons with disabilities.
Moreover, the concept of preventing disabilities is emphasized not only in rehabilitation medicine, but also in CBR, indicating that disability evaluation needs another factor of support system based on their community. Thus, it is important to think about the disability evaluation according to the characteristics of age, impairment and assistive environment. In the field of CBR, disability evaluation has recently become important for measuring the effects of rehabilitation treatment in medical insurance and decision of the grade of welfare service volume in Japan.
While the first and second groups have been historically well-established without any disagreement on the classifications of disability type, the third group concerning psychological disability has recently been questioned with respect to the visibly less apparent disabilities relating to cognition, memory, attention, emotion, and social behavior after traumatic head injury. Although the new system to evaluate and support such a disability group is under development throughout the country, problems with classification continue to be debated.


 XML Download