

 PDF
PDF ePub
ePub Citation
 Print
Print


INTRODUCTION
The 3D geometric changes of the mitral annulus (MA) during systole may be very important for understanding the role of the MA in association with the left ventricular (LV) and the left atrial (LA) dynamics. This is because the MA is an integral part of the mitral apparatus that gives attachment to the LV and the LA.
Several previous studies have already revealed the "saddle" or "ski-slope" shape of the MA and also the close association of the apico-basal motion of the mitral annulus with the LV systolic function by using 3D imaging techniques and tissue Doppler echocardiography (1-9). However, there is still controversy whether the MA shrinks or enlarges during systole (2-4, 6, 9).
The recent advances in real-time 3D echocardiography (RT3DE) and 3D computer software have made it easier to determine the geometries of non-visualized cardiac structures, such as the annuli, through 3D reconstruction and automatic measurements (9-13). Therefore, we employed RT3DE to investigate the geometric changes of the MA during systole.
MATERIALS AND METHODS
Population
RT3DE scanning was performed with a commercially available system (Sonos 7500, Philips, Co., Andover, MA, Netherlands). Thirteen normal subjects were selected based on the following criteria: 1) normal global LV function with a normal MA structure; 2) optimal RT3DE image quality of the MA that allowed analysis of the 3D geometry; and 3) normal sinus rhythm.
The exclusion criteria were: 1) suboptimal RT3DE image quality causing an incomplete analysis of the 3D geometry; 2) global or regional LV dysfunction; 3) abnormal structural disease of the MA; and 4) atrial tachyarrhythmia.
The LV volumetric images were obtained from an apical window in the same position. Four small volumes of the heart were acquired during four cardiac cycles with using a matrix array ultrasonographic transducer, and then they were integrated for obtaining a full volume image of the heart. Care was taken to include the entire annulus in the volumetric data set.
3D reconstruction of the annuli
The 3D data sets of the full volume of the heart were transferred to a 3D analysis computer program (TomTec, Co., Munich, Germany).
In the cross-sectional planes of the MA, we defined the center of the annuli in the volumetric image to set the axes through the transducer position and the center of the MA. We specified the coordinate system axes for the anatomical orientation of the MA in the cross-sectional volumetric images as follows: the commissure-commissure (CC) axis connected the two commissures of the MA and the 2nd orthogonal axis for the MA passed through the intersection of the CC axis in a roughly antero-posterior (AP) direction (Fig. 1).
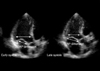
The LV volumetric data were then segmented into 16 rotational apical planes (angle increment=11.25°) around the long axis of the MA with using newly developed 3D software. Two hinge points of the leaflets (the junction points between the annulus and the leaflets) were traced in each rotational apical plane (total: 32 points) (Fig. 2) during three phases of systole defined as follows; early-systole: the frame following the closure of the mitral valve immediately before the opening of the aortic valve, mid systole: the mid-way frame between the early and late systole, and late-systole: the frame following the closure of the aortic valve before the opening of the mitral valve.
From these data, 3D images of the MA were reconstructed from fitting the images and their interpolation together via the 3D computer software.
Estimation of the geometry of the annuli
By measuring the two orthogonal axes of the MA, the two orthogonal dimensions (the CC and AP dimensions) of the annulus were determined (Fig. 1). The non-planar angle (NPA) representing the non-planarity of the "saddle-shaped" mitral annulus was determined by the angle between the two vectors from the anterior and posterior hinge points of the annulus to the center of the CC axis (Fig. 3).
The 3D surface areas of the MA (3DMAA) were automatically calculated from the fitted data by 3D computer software after 3D reconstruction. As the MA was composed of two leaflets, it was easily divided into the anterior and posterior annuli by the CC axis connecting the two commissures, and the 3D surface areas of the anterior (3DaMAA) and posterior (3D pMAA) annuli were separately calculated by the 3D computer software (Fig. 3). The projected 2D areas of the MA (2DMAA) were also calculated as the areas that projected onto the least-squares plane that were fitted to the annular curve.
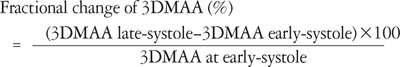
All the geometrical parameters were measured and calculated during early, mid and late systole. The fractional changes of the annular areas, which were defined as the percentage changes of the measurements from early to late systole, were calculated by the formula:
Validation of 3D area calculation by 3D computer software
In order to validate the 3D area that was automatically calculated by the newly developed 3D computer software, a "saddle-shaped" artificial (wire-loop) structure with a 3D area of 7.9 cm2 was reconstructed, and the 3D area was calculated in the same way with the 3D computer software after volumetric image acquisition with the 3D echo transducer in a water-bath. As a result, both the reconstructed 3D shape and the calculated 3D area (7.7 cm2) were close to the real shape and area (7.9 cm2) of the structure (Fig. 4).
Statistic analysis
The data are expressed as means±SDs. Paired t tests were used to compare the data between two parameters. Repeated measures analysis of variance (ANOVA) test was used to compare all the data between the three phases (early, mid and late systole). A Post-hoc comparison test (Bonferroni's method) was done for all the geometric parameters that showed significant changes by repeated measures ANOVA test for pairwise comparisons between the two phases. A p value <0.05 was considered to be significant.
RESULTS
Geometric measurements of the mitral annulus during systole
The measurements of all the geometric parameters of the annulus are depicted in Table 1 and 2. The MA revealed a "saddle shaped" appearance during systole with an NPA of 139-167° (Fig. 5). The AP dimension (p<0.0001) and the NPA (p<0.0001) of the MA revealed consistent increases during the three phases (early, mid, and late) of systole by repeated measures ANOVA tests (Table 1). However, the CC dimension of the MA revealed no significant change (p>0.05) during systole (Table 1).
The 3DMAA were significantly larger than the 2DMAA during early (9.49±1.25 vs. 8.52±1.29 cm2, p<0.001), mid (9.92±1.31 vs. 9.16±1.36 cm2, p<0.001) and late systole (10.78±1.36 vs. 10.12±1.39 cm2, p<0.01). Both the 2DMAA (p<0.0001) and the 3DMAA (p<0.0001) also revealed significant increases during the three phases of systole by repeated measures ANOVA tests (Table 2). The 3DpMAA (p<0.0001) revealed more prominent increases during systole than the 3DaMAA (p=0.001) (Table 2).
The fractional increase of the 2DMAA from early to late systole was significantly larger than that of the 3DMAA (19.2±4.0 vs. 13.7±3.8%, respectively, p<0.01).
Among all the geometric parameters that revealed significance by repeated measures ANOVA tests, the NPA, the AP dimension, the 2DMAA, the 3DMAA and the 3DpMAA showed significant increases from early to mid systole (p<0.01) as well as from mid to late systole (p<0.01) by the Post-hoc comparison test (Bonferroni's method), whereas the 3DaMAA showed a significant increase only from mid to late systole (p<0.01) (Fig. 6).
DISCUSSION
This study was conducted to determine the changes of the shape and geometry of the normal MA during systole (i.e., early, mid and late systole), by performing 3D reconstruction with using RT3DE and the newly developed 3D computer software.
In this study, the MA demonstrated a similar non-planar "saddle-shape", the same as several previous studies (2-13), with a non-planar angle of 139-167°. On the projected view, the MA demonstrated a fan-like shape, which was due probably to the non-planarity of the MA (Fig. 5). Accordingly, the 2D area of the MA was found to significantly smaller than the 3D area.
This study, in which the 3D shapes of the annuli were reconstructed and the 3D surface areas were calculated during early, mid and late systole, demonstrated that the MA enlarged during systole with its becoming less non-planar, but its "saddle-shape" appearance was preserved. Our observation was corresponded to the previous human data reported by Pai et al. (4) indicating that the annular size increased during the systolic period. On the other hand, some studies (1, 2, 14) reported the annular size changed in a biphasic pattern with early reduction and then increase of the annular size. The early reduction of the annulus is attributed to pre-systolic atrial contraction. In this study, we defined the frame following the closure of the mitral valve as the early systole. As a result, the pre-systolic phase was excluded from the systole. Moreover, the frame rate of 3DE image was quite low. These might be the reasons why our data showed monophasic increases of the annular size during systole.
The annular enlargement was found to be mainly in the AP direction (Fig. 7) without a significant change in the CC direction, as was also reported in several previous reports (1, 4, 9, 14, 15). And the "becoming less non-planar" change of the annulus (Fig. 8) may be the reason why there was the more notable increase in the 2D area of the annulus during systole than the increase in the 3D area (Fig. 6).
Another observation in the present study was that the posterior annulus showed more prominent enlargement than the anterior annulus during systole.
In contrast, some other previous studies (3, 5, 6) have shown reverse results that have indicated that the annular size decreased during the systolic period. These discrepancies might be due to the differences in techniques that were used to define the border of the annulus (the atrial portion vs. the ventricular portion of the annulus) in the plane images for the measurements.
Previous studies have reported that the maximum reductions in size of the MA were approximately 25-26% (1, 2). When considering this, the fractional change of the annular area in the present study seems to be relatively small. It is generally accepted that the annular size increases during systole after presystolic narrowing of the annulus, and then it continues to increase in size and reaches a maximum during late diastole (2, 4). Those previous studies showed a larger fractional change of the area estimated from the annular areas during the entire cardiac cycle, including diastole, while our study included only systole. Therefore, the discrepancy between the results can be attributed to the differences in the timing of the measurements.
As previously mentioned, there have been several studies that have evaluated the geometry of the MA. However, those studies had several limitations.
First, some studies have been done in an animal model and not a human model, and all the data were obtained in an acute, anesthetized, open-chest state. Therefore, the results are not necessarily applicable to humans. In addition, the deleterious effects of cardiopulmonary bypass (CPB), ischemia and rapid heart rate could produce abnormal annular behavior and so alter the annular motion during the cardiac cycle. Therefore, those measurements do not necessarily represent the actual geometry of the human MA in a normal state. In this study, we obtained all the data in human subjects in a resting state with using RT3DE. Consequently, the measurements we observed can be applied immediately to the general human population.
Second, those previous studies that used other 3D imaging modalities reconstructed the annulus with only a few hinge points of the leaflets. However, meticulous care is required when measuring the geometry of small cardiac structures like the annulus; the reliability of the reconstructed shape or the measurement of the area depends on the number of traced hinge points. As a result, the reconstructed shape and the measurements of the annuli with 32 hinge points, as was done in our study, should be much more reliable.
Last, the areas measured or calculated in previous studies were not the 3D surface area, but rather, they were the projected 2D area. However, only with measuring 2D area of the annulus, we can't be sure whether the annulus increases in size or not during systole because the measurement may increase only with flattening of the annulus.
In contrast to the previous study performed with sonomicrometry, we obtained the volumetric images using RT3DE and we then reconstructed the annuli with newly developed 3D image computer software. During the process of 3D image acquisition and 3D reconstruction, several limitations became evident. First, spatial resolution of the volumetric images might be limited, as compared to conventional 2D images, due to the low frequency of the transducer and the parallel processing. However, the mitral annular hinge points and the mitral leaflets had strong signal intensities, which made it easy to identify them on the images. Second, current 3D echocardiography system has inability to transfer electrocardiogram together with images to PC. Therefore, the definition of the cardiac phases (early, mid, and late systole) should rely on the valvular motion. Nevertheless, there might be image/phases mismatches due to the low frame rate. Third, the geometry of the mitral annulus was analyzed only at only few phases (early, mid, and late systole) during systole that small multi-phasic variations of the annular size during systole might be missed. Unfortunately, we had difficulty to reconstruct the annulus in all frames during systole due to time-consuming process of 3D reconstruction. However, the main issue we wanted to deal in this study was whether the annular size became smaller or enlarged during systole. Therefore, we decided to estimate the annular geometry at three phases (early, mid, and late systole) to see overall change of the annular geometry during systole.
We demonstrated that the mitral annulus had a "saddle shaped" appearance and it consistently enlarged mainly in the antero-posterior direction during systole with lessening of its non-planarity by 3D reconstruction with the combined use of real-time 3D echocardiography and newly developed 3D computer software.


 XML Download