

 PDF
PDF ePub
ePub Citation
 Print
Print


INTRODUCTION
Electroconvulsive therapy (ECT) results in electrically induced repetitive firing of neurons in the central nervous system; it is a technique that has been used to treat severe psychiatric illness. Major depression, especially in the elderly, is currently the most common indication for ECT. However, it is also used in other serious psychiatric disorders such as schizophrenia and bipolar I disorder. It has been shown to be effective in between 85% and 90% of cases of major depression; by comparison, antidepressant medications have been shown to be effective in 60-65% of cases (1). Understanding the mechanism by which ECT improves the symptom of major depression might provide a clue to better understanding involved in the etiology of depression. Despite the early recognition of the essential role of generalized seizure activity in producing the therapeutic effects, the exact mechanisms of action of ECT have remained to be elucidated.
The human genome project has provided a wealth of information on the sequences of individual genes. However, the decoding of the nucleic acid sequence alone is not sufficient to understand the complex biological processes and the mechanisms underlying diseases; the analysis of mRNA and protein function is necessary to advance understanding (2, 3). Therefore, the focus of research is now moving to the immense task of identifying the structure, function and the interactions of the proteins produced by individual genes. Proteins are key molecules to understand cellular functions, disease processes, and chemotherapeutic treatments; this area of research of the analysis of cellular proteins has been termed proteomics (4). Recent improvements for proteome analysis have offered the possibility of identifying disease-associated protein markers to assist in diagnosis or prognosis, and for selecting potential targets for specific drug therapy.
In this study, we prepared proteins from ECT-treated and normal rat brain tissues, and then analyzed and identified a number of ECT-associated proteins by two-dimensional gel electrophoresis and matrix-assisted laser desorption/ionization time-of flight (MALDI-TOF)/mass spectrometry
MATERIALS AND METHODS
Materials and animals
IPG gel strips (pH 4-7, 18 cm), ampholyte, SDS, acrylamide, N,N'-methylene-bis-acrylamide, TEMED, ammonium persulfate, dithiothreitol (DTT), urea, Tris, glycine, glycerol, and CHAPS were purchased from Bio-Rad (Hercules, CA, U.S.A.). Silver nitrate, Coomassie Brilliant Blue G-250, TCA, iodoacetamide, and CHCA (α-cyano-4-hydroxycinnamic acid) were from Sigma-Aldrich (St. Louis, MO, U.S.A.). Methyl alcohol, ethyl alcohol, phosphoric acid, acetic acid, and formaldehyde were purchased from Merck (Darmstadt, Germany). Sequencing grade modified trypsin was obtained from Promega (Madison, WI, U.S.A.). Other reagents were obtained from Sigma-Aldrich or Merck.
Four to six months male rats (Sprague Dawley, 200-350 g; ACE Animals, Boyertown, PA, U.S.A.) were used in this study. Rats were housed in groups of five with free access to food and water, and the animal room was maintained at approximately 23℃ with a 12 hr light/dark cycle. The ECT (or electroconvulsive shock) was applied via bilateral ear clip electrodes. The shock, a square wave pulse (pulse width, 0.7 msec; 50 Hz) of 50 mA, was administered for 1 sec to provide a tonic seizure phase. ECT-treated animals (N=8) were given one ECT per day for 14 consecutive days. The control rats (N=8) were handled in the same condition with no current. All animal experiments were approved by the Institutional Review Board and carried out in accordance with the principles of laboratory animal care. The rat brains were weighed, frozen on dry ice and stored at -70℃.
Sample preparation for two-dimensional gel electrophoresis (2-DE)
The frozen rat brain tissues (-2.5 g) were washed three times with phosphate-buffered saline (pH 7.2), and homogenized in 5 mL homogenization buffer (50 mM Tris-HCl [pH 7.2] and 150 mM NaCl) containing 1 × protease inhibitor cocktail (Promega) using an Ultra-Turrax T8 Homogenizer (IKA, Staufen, Germany).
TCA-precipitated proteins were washed once in diethyl ether and dried under air stream. The dried pellets were dissolved with sonication in the lysis buffer (40 mM Tris, 8 M urea, 4% CHAPS, 100 mM DTT, and 2% ampholyte), and were centrifuged at 15,000 rpm (100,000×g) for 15 min at 4℃. The resulting supernatant was kept at -70℃ until use. Protein concentration was determined by the Bradford method using bovine serum albumin as a standard (5).
2-DE
The IPG gel strips were rehydrated in a swelling solution (8 M urea, 2% CHAPS, 100 mM DTT, 0.5% pH 4-7 IPG buffer, and bromophenol blue) containing 50 µg (for silver staining) or 500 µg (for Coomassie blue staining) proteins for 12 hr at 20℃, and applied to strips by overnight rehydration at 50 V (6). Proteins were focused for 10,000 V within 3 hr, and maintained at 10,000 V for 7 hr at 20℃ using Protean IEF Cell (Bio-Rad, Hercules, CA, U.S.A.). After the IEF procedure, the strips were equilibrated as described (7). Separation in the second dimension by SDS-PAGE at 16℃ at 5 mA/cm (constant current) for the initial 1 hr and 10 mA/cm thereafter. Protein visualization by silver or Coomassie blue staining was performed as described (7).
Image analysis and protein identification
Protein patterns in the gel were recorded as digitalized images using a high-resolution scanner (GS-710 Calibrated Imaging Densitometer, Bio-Rad). The scanned gel image was analyzed using a standard protocol for PDQuest software (Bio-Rad). For all spot intensity calculations, normalized values were used and expressed in ppm. In-gel digestion of protein spots with trypsin was performed as described (7). The tryptic peptides were redissolved in a solution containing water, acetonitrile, and trifluoroacetic acid (93:5:2), and the solution was treated for 5 min in a bath sonicator. Target preparation was carried out by solution phase nitrocellulose method. Saturated solution of CHCA (40 mg/mL) and nitrocellulose (NC) solution (20 mg/mL) was prepared separately in acetone. A mixture of CHCA- and NC solution, and 2-propanol was prepared at a ratio of 2:1:1. Peptide calibrants (50-200 fM of each), des-Arg-bradykinin (monoisotopic mass, 904.4681), and neurotensin (1672.9715), were added and the mixture solution was then spotted on the target and dried. The dried samples were washed with 5 µL of 5% formic acid for 10 sec, followed by 5 µL of Milli-Q water for 10 sec, and then the dried spots were analyzed in a Voyager-DE™ STR MALDI-TOF mass spectrometer (PerSeptive Biosystems, Framingham, MA, U.S.A.). The spectrometer was run in positive ion mode and in reflector mode with the following settings: accelerating voltage, 20 kV; grid voltage, 76%; guide wire voltage, 0.01%; and a delay of 150 ns. The low mass gate was set at 500 m/z. Proteins were identified by peptide mass fingerprinting with the search programs MS-FIT (http://prospector.ucsf.edu/ucsfhtml3.4/msfit.htm).
RESULTS
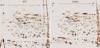
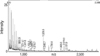
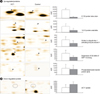
We analyzed the proteomic profiles of the ECT-treated rat brain tissues and the normal control brain tissues with each 8 pairs. Spots representing proteins that were differentially expressed in the ECT-treated rat brains were selected (p<0.05 by Student's t-test). A total of 918 spots from the control group and 962 spots from the ECT-treated group were visualized in a gel (pH range from 4-7 and molecular mass range from 10-100 kDa) (Fig. 1). The overall protein expression patterns in the ECT-treated and the normal brain tissues were quite similar except for some areas. The protein identities from all the spots were entered in the composite gel database so that any changes in the protein expression could be determined for each protein spot. The integrated protein intensity was determined for each identified spot in eight gels each from the ECT-treated and normal brains. The mean intensity of each spot was calculated by its silver stain intensity and the relative intensities between the ECT-treated and normal brains. Five proteins were dominantly expressed in the ECT-treated rat brain tissues and one protein was revealed largely repressed, and these proteins were found with a statistical significance. Some of these proteins have been identified by mass spectrometry. A typical mass spectrum of a protein, 14-3-3 protein zeta/delta, was shown in Fig. 2. Total 6 proteins from 7 spots were identified. The expression level of each protein in both ECT-treated and normal tissue was indicated by the density values (Fig. 3). Their predicted values of isoelectrical point (pI) and molecular weight (M.W.) were summarized in Table 1, and the values were compatible to those of acquired from the gels. The sequence coverage of proteins isolated from the peptide mass matching in a program was acceptable (20-40% ranges). Five proteins were dominantly expressed in the ECT-treated rat brain tissues with a statistical significance; S100 protein beta chain (S100B), 14-3-3 protein zeta/delta, similar to ubiquitin-like 1 (sentrin) activating enzyme subunit 1, suppressor of G2 allele of SKP1 homolog and phosphatidylinositol transfer protein alpha (PI-TPα) (Fig. 1, 3A). One protein, ACY1 protein, was revealed largely repressed (Fig. 1, 3B).
DISCUSSION
Proteomics provides a powerful tool for the identification of proteins differentially expressed after exposure to ECT. In this study, 24 protein spots whose expression was changed after ECT were shown to have either increased or decreased expression in the ECT-treated rat brain tissues. Three ranges of IPG gel strips (pI 3-10, 4-7, and 6-9) were used for IEF with similar results in the slightly different resolution, but pI 4-7 strip was selected for the optimum condition (data not shown). Among them, six proteins were identified as S100B, 14-3-3 protein zeta/delta, PI-TPα, similar to ubiquitin-like 1 (sentrin) activating enzyme subunit 1, suppressor of G2 allele of SKP1 homolog and ACY1 protein by MALDI-TOF/mass spectrometry.
Expression of S100B was increased after ECT-treated brain compared with control rat brain. S100B is a calcium-binding protein, produced and secreted by astrocytes and it modulated the proliferation and differentiation of neurons and glia (8). Increased levels of this protein are associated with brain damage and its persistent elevation appears to be involved in neurodegenerative disorders including schizophrenia (9). Cerebrospinal fluid levels of S100B of rats submitted to repeated-ECT were significantly increased (10). Whether S100B levels are elevated due to injured astrocytes and a disrupted blood brain barrier or by active secretion of S100B by astrocytes, it is remained to be clarified by further studies.
The 14-3-3 proteins belong to a family consisting of highly conserved acidic proteins with molecular weights of 25-30 kDa. The 14-3-3 proteins participate in phosphorylation-dependent protein-protein interactions that control progression through the cell cycle, initiation and maintenance of DNA damage checkpoints, activation of MAP kinases, prevention of apoptosis and coordination of integrin signaling and cytoskeletal dynamics (11, 12). Alterations of the expression of 14-3-3 proteins have been associated with several human diseases such as cancer, heart disease and a variety of neurodegenerative disorders including Cruezfeldt-Jacob disease and Alzheimer's disease. The 14-3-3 proteins have been implicated by several recent studies in the potential genetic bases of schizophrenia (13, 14). In schizophrenia, mRNA levels of one of the 14-3-3 membrane (eta) proteins have been reported to be significantly decreased in post-mortem cerebellum samples obtained form medicated subjects with schizophrenia (15). Recently, Middleton et al. reported that the 14-3-3 beta transcript may be unique among the 14-3-3 genes due to its associated increase in response to haloperidol and decrease in the disease state (16). Expression of the 14-3-3 protein zeta/delta in the ECT-treated rat brain was increased in this study. This finding might be associated with the therapeutic mechanism of ECT on psychotic symptoms.
Expression of phosphatidylinositol transfer proteins was increased after ECT. PI-TPs are responsible for the transport of phosphatidylinositol (PI) and other phospholipids between membranes. PI-TPs play a role in the delivery of PI to PI-4-kinase, which synthesizes PI-4,5-biphosphate (PIP2). Because of the high affinity of PI-TPs for PIP and PIP2, these lipids remain bound to PI-TPs that may also deliver these substances for PLC (17). Kauffmann et al. (18) have identified PI-TPα as an essential component for ensuring substrate supply to PLC. This enzyme hydrolyzes PIP2 to generate the second messengers: diacylglycerol (DAG) and inositol trisphosphate (IP3). In the next step, DAG activates PKC via phosphorylation which initiates the mitogen activated protein kinase (MAPK) cascade. A second messenger generating system that may be involved in mood regulation involves phosphoinositide metabolism (19, 20). In this system, the plasma membrane located lipid PIP2 is hydrolyzed to a postsynaptic second messenger that contributes to chronic cell stimulation by altering the electrical activity in the neuron. Inositol formed during this process is recycled by the enzyme inositol monophosphatase. Cells in the central nervous system have limited access to plasma sources of inositol and depend on its synthesis for the transduction of neuronal signals. Lithium in therapeutic concentrations blocks the activity of inositol monophosphatase, inhibiting the hydrolysis of intermediate inositol phosphates into inositol, which is necessary for the resynthesis of PIP2 (21). As a result, PIP2 levels are depleted, and the lipid is no longer able to stimulate the formation of adequate quantities of the second messenger or alter electrical activity. Therefore, increased expression of PI-TPα in ECT-treated rat brain may be associated with a mood stabilizing effect of ECT.
The ACY1 protein is a homodimeric zinc-binding metalloenzyme located in the cytosol (22). The ACY1 protein is usually involved in detoxification processes. It hydrolyzes a variety of N-acylated amino acids generating free amino acids and may be involved in the synthesis of hippurate that is formed during detoxification of aromatic compounds (23). A diminished expression of this enzyme has also been found in lung cancer cell lines of small cell type and pulmonary tumors (24). However, its physiological role remains unclear. The physiological role of the other identified proteins such as similar to ubiquitin-like 1 (sentrin) activating enzyme subunit 1 and suppressor of G2 allele of SKP1 homolog is still unknown. Further studies are required to determine whether these proteins are associated with the mechanisms of ECT in regard to its therapeutic and/or adverse effects.
In conclusion, the current study was designed to identify differentially expressed proteins in rat brains following exposure to repeated ECT using proteomic analysis. Twenty four protein spots whose expression was increased or decreased after exposure to ECT were isolated. Six different proteins from 7 spots, whose levels were altered by more than 3.0-fold in more than four of the eight pairs analyzed, were identified by MALDI-TOF/mass spectrometry. These proteins were ACY1 protein, S100B, 14-3-3 protein zeta/delta, similar to ubiquitin-like 1 (sentrin) activating enzyme subunit 1, PI-TPα and suppressor of G2 allele of SKP1 homolog. Taken together, the results obtained might help us to find a valuable resource for the investigation of mechanisms involved in the therapeutic and adverse effects of ECT.

 XML Download