

 PDF
PDF ePub
ePub Citation
 Print
Print


INTRODUCTION
Tuberculous pleural effusion (TPE) occurs because of a delayed hypersensitivity reaction to mycobacterial antigens rather than an infectious process (1). Despite the introduction of a standard antituberculous medication, this condition is known to leave pleural thickening in a significant proportion of observed cases (2-5). The benefit of the efforts to reduce residual pleural thickening (RPT), such as adjunctive therapy of corticosteroids or pigtail drainage, remains inconclusive (4, 6, 7).
It has long been an issue of interest to have the capability to predict the development of RPT in TPE (8). The earliest study regarding factors influencing RPT in TPE, to our knowledge, failed to demonstrate which patients would have the sequela from either their clinical characteristics or pleural fluid findings (3). In contrast, the following studies suggested that some parameters in pleural fluid analysis differed between patients with and without RPT (2, 3, 8), while the results of these studies were not replicable in another study (9). Accordingly, factors determining RPT in TPE still remain to be elucidated.
The presence or absence of RPT was determined by the pleural based opacity on chest radiographs, which comprised nonresolving pleural effusion as well as true pleural thickening. Thus, residual pleural opacity (RPO) is considered to be more proper rather than RPT, as described by Han et al. (5).
The aim of this study was to investigate the factors influencing RPO after treatment of TPE. Unlike previous studies, we used computed tomography (CT) images rather than chest radiographs to examine the radiographic parameters for RPO.
MATERIALS AND METHODS
Study population
The study population comprised HIV-negative patients with TPE admitted to Kyungpook National University Hospital (Daegu, Korea) between September 2004 and July 2006. On the first day of hospitalization, pleural fluid samples were obtained from the patients and subjected to routine analysis including cell count with differentials, pH, lactate dehydrogenase (LDH), glucose, and protein. Pleural fluid adenosine deaminase (ADA) activity was determined according to the colorimetric method described by Giusti and Galanti (10). Microbiological studies, such as acid-fast bacilli (AFB) smear and mycobacterial culture and cytological examination were performed. In addition, all patients underwent Mycobacterium tuberculosis polymerase chain reaction (PCR) using the Cobas Amplicor MTB test (Roche Diagnostic System, Basel, Switzerland) (11). TPE was diagnosed if at least one of the following criteria was fulfilled: 1) positive AFB smear or culture of M. tuberculosis in pleural fluid; and 2) chronic granulomatous inflammation on pleural biopsy specimen.
All patients received antituberculous medication for the first two months of the study as follows: isoniazid 300 mg/day; rifampin, 600 mg/day (450 mg/day for patients with <50 kg of body weight); ethambutol 1,200 mg/day (800 mg/day for patients with <50 kg of body weight); and pyrazinamide 1,500 mg/day (1,000 mg/day for patients with <50 kg of body weight). Subsequently the next four months included treatment with isoniazid 300 mg/day; rifampin 600 mg/day (450 mg/day for patients with <50 kg of body weight); and ethambutol 800 mg/day, but pyrazinamide was discontinued. After obtaining the necessary samples, pleural fluid was drained as completely as possible by thoracentesis. This study was approved by our institutional review board and written informed consent was obtained from all patients to be enrolled.
Radiologic analysis
Chest radiographs and CT scans, obtained before and after treatment, were separately analyzed by an experienced thoracic radiologist. Chest radiographs were taken on a monthly basis during follow-up until the end of antituberculous medication. The posteroanterior chest radiographs initially determined the amount of pleural effusion by modification of Han et al. (5) as follows: small, the level of pleural effusion which blunted the costophrenic angle but did not obscure the entire diaphragm; moderate, the level which obscured the entire diaphragm but below the hilum; and large, the level up to and above the hilum. For quantitative assessment of RPO at the completion of antituberculosis medication, we measured the distance from the lateral chest wall to the innermost margin of the opacity at the level of the highest point of the hemidiaphragm. However, in patients with laterally formed loculations, the maximum horizontal thickness of lateral loculations was measured instead.
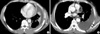
CT scan of the chest was performed with intravenous contrast enhancement. At initial CT scans, loculation or free collection of the fluid, presence of pleural thickening, extrapleural fat proliferation, increased attenuation of extrapleural fat, circumferential pleural thickening, and parenchymal lesions such as cavity, consolidation, centrilobular nodules were observed (Fig. 1). If pleural thickening was noted, measurement of pleural thickness was followed. After medication, RPO thickness which comprised pleural thickness and nonresolving pleural effusion were measured and the presence of pleural or subpleural mass-like lesions was observed.
Statistical analysis
Statistical analyses were performed using SPSS software (Version 12.0; SPSS Inc, Chicago, IL, U.S.A.). Data were expressed as mean±standard deviation (SD) or median with interquartile range (IQR; 25% and 75%), if the data were skewed, for continuous variables, and percentages for categorical variables. Between two groups, continuous variables were compared by Student's t-test and Mann-Whitney U test if non-normally distributed, whereas categorical ones were compared using a chi-squared test or Fisher's exact test. Multiple logistic regression analysis was performed to evaluate the variables determining RPO. Two-sided p values <0.05 was considered to be statistically significant.
RESULTS
Baseline characteristics
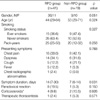
During the study period, 78 patients with TPE were enrolled in this study; 18 patients were excluded due to loss to follow-up (n=13) and the change of antituberculous drugs because of adverse effects or drug-resistance (n=5). Consequently, 60 patients were available to the final analysis. The demographic data are summarized in Table 1. The incidence of RPO at the completion of antituberculous medication was 68.3% (41/60) on CT scan and 63.3% (38/60) on chest radiograph. The ranges of RPO on CT and chest radiograph were 2-50 mm and 3-70 mm, respectively. The subjects were divided into the patients with and without RPO on CT scan (RPO group vs. non-RPO group). The RPO group had a longer symptom duration (median [IQR], 14 days [7-30] vs. 7 days [6-14]; p=0.031) and tended to be predominant in males (male-to-female, 30/11 vs. 9/10; p=0.051) compared with the non-RPO group. For symptomatic relief of high fever or dyspnea due to paradoxical reaction, corticosteroids (≥ prednisolone 15 mg/day for at least 10 days) and therapeutic thoracentesis or pleural drainage were used with similar frequency in both groups. In the remaining variables, no significant differences were observed between the two groups.
Pleural fluid analysis
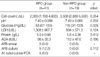
A significantly lower glucose level in pleural fluid was observed in the RPO group compared with in the non-RPO group (median [IQR], 83 mg/dL [67-103] vs. 115 mg/dL [91-123]; p=0.003) (Table 2). The RPO group tended to have a lower pleural fluid cell count (median [IQR], 2,300/µL [1,100-4,600] vs. 3,500/µL [2,800-5,500]; p=0.054) and lower pH level (median [IQR], 7.41 [7.35-7.44] vs. 7.44 [7.38-7.46]; p=0.055). No significant differences in LDH, protein, and ADA levels of pleural fluid were noted between the two groups. Overall, no patient was positive for the pleural fluid AFB smear and M. tuberculosis-PCR testing. M. tuberculosis was cultured in five cases from the RPO group but no significant difference was observed between the RPO and non-RPO groups.
Radiographic findings
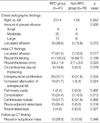
The results of the radiologic analyses are presented in Table 3. No differences between both groups were observed in the parameters of chest radiographic features. Among initial CT findings, loculation, extrapleural fat proliferation, increased attenuation of extrapleural fat, and pleura-adjacent atelectasis were more frequently seen (41.5% [17/41] vs. 10.5% [2/19], p=0.017; 70.7% [29/41] vs. 31.6% [6/19], p=0.004; 31.7% [13/41] vs. 5.3% [1/19], p=0.024; and 24.4% [10/41] vs. 0.0% [0/19], p=0.018) and pleural thickness (3.6±1.4 mm vs. 2.7±0.9 mm; p=0.023) was significantly higher in the RPO group compared with the non-RPO group. The patients with RPO tended to have frequent circumferential pleural thickening on CT scan (14.6% [6/41] vs. 0.0% [0/19], p=0.079). The frequency of pleural mass and other lung parenchymal findings, including pulmonary cavities, centrilobular nodules, and consolidation was not significantly different between the two groups.
Multivariate analysis for predictors of residual pleural opacity on CT scans
As the data of symptom duration was skewed and non-normally distributed, we transformed the variable into an ordinal one by stratifying into four levels: 0 to 9 days, 10 to 19 days, 20 to 29 days, and ≥30 days. Multiple logistic regression analysis demonstrated that the presence of extrapleural fat proliferation (odds ratio [OR], 5.642; 95% confidence interval [CI], 1.342-23.723; p=0.018) and loculated effusion on CT scan (OR, 6.795; 95% CI, 1.025-45.055; p=0.047) and symptom duration (OR, 1.996; 95% CI, 1.067-3.733; p=0.030) were the predictors of RPO on CT scan in TPE (Table 4).
DISCUSSION
Clinical parameters of symptom duration, a pleural fluid constituent of low glucose level, and CT features of pleural thickness and the presence of loculated effusion, extrapleural fat proliferation, increased attenuation of extrapleural fat, and pleura-adjacent atelectasis were significantly different between the RPO and non-RPO groups. Multivariate analysis revealed that clinically, symptom duration and radiologically, extrapleural fat proliferation and loculation on CT before the start of antituberculous medication might be predictive of RPO at the end of the medication in TPE patients. These three parameters commonly make a suggestion of a longstanding pleural effusion, indicating that RPO in TPE may be influenced by the chronicity rather than the intensity of pleural effusion. From this perspective, early diagnosis and early initiation of antituberculous medication is expected to reduce the development of RPO in patients with TPE (2, 7).
The parietal pleura consists anatomically of four major layers as follows: beginning with the innermost layer, 1) a single layer of mesothelial cells; 2) a thin supportive fibroelastic layer; 3) a layer of loose connective tissue; and 4) the endothoracic fascia, a second fibroelastic layer that tethers the pleura to the overlying ribs (12). In normal condition, these layers are quite thin, except for the layer of loose connective tissue (12, 13), where the fat is referred to as "subpleural" or "extrapleural" (13). Extrapleural fat proliferation or thickening is frequently noted in patients with chronic empyema (14, 15). This CT finding, therefore, appears to reflect that the pleural inflammation in parapneumonic effusion and TPE persists for a fairly long time rather than a short period. Increased attenuation of extrapleural fat, not specific to empyema, was also seen in approximately 75% of patients with the late fibropurulent and organizing stages of parapneumonic effusion/empyema, signifying an ongoing inflammatory process infiltrating extrapleural space (14, 15). In a CT-pathologic correlation study, increased attenuation of extrapleural fat corresponded histopathologically to the layer of proliferation of vessels, inflammatory cells, and granulomas (15). In this study, although both extrapleural fat proliferation and increased attenuation of extrapleural fat significantly differed between the two groups in the univariate analyses, only extrapleural fat proliferation turned out to be a predictor of RPO with an OR of 5.6 in the multivariate analysis. We speculate that extrapleural fat proliferation may indicate the chronicity of pleural disease, while increased attenuation of extrapleural fat may suggest active inflammation spreading to extrapleural space.
Next, CT is particularly helpful in the assessment and management of loculated pleural effusions (16). A previous study suggested that patients with a loculated effusion may have a more protracted course (13). Loculation on CT also implies the chronicity of the pleural effusion. Furthermore, longer symptom duration was a marginal but significant predictor on the formation of TPE, which supports the results of the study by Barbas et al. (3, 17).
The importance of the chronicity of pleural inflammation in predicting RPO in TPE has been presented in previous studies (9, 18). Candela et al. reported that, with respect to the pleural fluid constituents, only the lipid components showed an apparent influence on the development of functional sequelae of TPE (18). In the other study, the extent of RPT was not correlated with the levels of interleukin-6, tumor necrosis factor-α, and interferon-γ in the initial pleural fluid sample. However, for those 11 patients with paired samples, a significant negative correlation between the percentage reduction in the levels of cytokines and the eventual extent of RPT was found. These data possibly suggest a more likely association of RPT with the rate of resolution of pleural inflammation rather than the intensity of inflammation at presentation (9).
The present study had several limitations. The prevalence of RPO in the present study was higher compared with previous studies (2-4, 7, 17, 18). We cannot explain this appropriately although there was a possibility that it originated from selection bias. Furthermore, RPO on chest radiograph, exaggerated by pleura-adjacent lung atelectasis, extrapleural fat, and pleural mass lesion (data not shown), was thicker than that on CT (3-70 mm vs. 2-50 mm). Secondly, as improvement of RPO often occurred even after completion of antituberculous medication up to 24 months (5), RPO in this study may be different from RPO at a final stage. However, considering that RPO at the end of antituberculous medication was strongly correlated with that at 24 months, RPO in this study is thought to reflect the final RPO. Lastly, pulmonary function test was not included in the present study and functional sequelae could not be estimated. Therefore, the extent of functional limitation in patients with RPO was not identified.
In conclusion, RPO in TPE may be determined by the clinico-radiologic parameters related to the chronicity of the effusion as a function of symptom duration and radiological extrapleural fat proliferation and loculated effusion on CT. Therefore, early diagnosis and early treatment may be important to reduce the incidence of the RPO in patients with TPE.
 XML Download