

 PDF
PDF ePub
ePub Citation
 Print
Print


INTRODUCTION
The establishment of tissue-specific gene expression profiles relies on a variety of transcription factor cascades, which initiate embryogenesis and development, and on DNA methylation, which prevents the reactivation of inactive genes (1). The promoter regions of the housekeeping genes always overlap with the CpG islands, whereas approximately 60% of the genes lacking CpG islands are expressed in a tissue-specific manner (2, 3). However, an inverse correlation between the methylation state and gene expression is found in only 30% of the genes randomly selected (4). Therefore, it is believed that rather than simply acting as an on-off switch in gene regulation, DNA methylation is essential for maintaining the well-organized gene expression in a variety of somatic tissues (5), and that changes in the normal methylation state might play a role in the genesis and development of cancers (6).
The loss-of-heterozygosity (LOH) event detected by an analysis of microsatellite sequences represents the unilateral chromosomal loss, major genetic alterations observed in human solid tumors (7). Although the LOH event may be a part of bi-allelic gene inactivation, it is still unclear if a decrease in the chromosomal dose plays a role in carcinogenesis. Assuming the DNA methylation profile of a given tissue is established with respect to the global gene expression profiles, it is possible that the gene-copy number reduction caused by LOH can influence the methylation and transcriptional status of the genes on the chromosomal copies retained. However, there are a few reports describing the functional relationship between the genetic and epigenetic features of cancer cells, especially on how the LOH events and methylation changes collectively influence the global gene expression profiles of cancer cells. We previously observed that the methylation-variable CpG sites between unmethylated promoters and nearby methylated retroelements, including the CpG-island margins and the non-island-CpG sites the genes lacking CpG islands, are associated with the global as well as individual gene expression patterns (8-10). These findings lead us to propose an assumption that a decrease in the number of active gene copy caused by LOH might facilitate the methylation changes in the transitional-CpG sites as well as the changes in the total number of active genes.
In this study, we examined the chromosomal losses events, methylation changes, and global expression profiles in gastric, colonic, mammary and nasopharyngeal cancers in order to further delineate the interaction of genetic, epigenetic, and transcriptional alterations using LOH, methylation-specific polymerase chain reaction (PCR) and Serial Analysis of Gene Expression (SAGE) data.
MATERIALS AND METHODS
Collection of cancer and normal tissues
Formalin-fixed, paraffin-embedded tissue sections of four cancer types (stomach, colon, breast, and nasopharynx) were obtained from 100 patients who had undergone a surgical resection between March 2004 and July 2006 at St. Paul's Hospital and Kangnam St. Mary's Hospital, The Catholic University of Korea. The Institutional Review Board approved this study, and written informed consent was obtained from each patient before surgery. A single 10-mm-diameter site containing a homogeneous cell population was selected from each section that contained a representative of paired normal and tumor tissues. Seven-µm-thick hematoxylin-eosin-stained sections were microdissected under a 40× stereomicroscope using a surgical scalpel. In the microscopic examination, the tumor specimens consisted mainly of tumor tissue and the normal tissues did not show any evidence of tumor cell invasion or significant inflammatory involvement. Approximately 50 microdissected cells were digested in 1 µL of a Tween 20-Proteinase K lysis buffer.
PCR-based microsatellite analysis
A pair of normal and cancer DNAs was examined using a panel of PCR primers that covered 40 microsatellite loci on eight cancer-associated chromosomes, 3p, 4p, 5q, 8p, 9p, 13q, 17p, and 18q, as reported elsewhere (11-14). The allelic profiles of the 40 microsatellite sequences were initially analyzed for any microsatellite instability (MSI) at the homozygous markers showing a few stutter bands in a pair of normal and cancer tissues. If the cancer DNA showed novel bands that were absent in normal DNA, in >40% of the homozygous microsatellite alleles, they were interpreted as being a MSI. The difference in the allelic intensity between the normal and cancer DNAs was scored as the relative allelic ratio calculated by dividing the intensity ratio of the cancer by the normal allelic ratio. A relative allelic ratio >1.5 in the heterozygous case without a MSI was interpreted as a LOH on the basis of the distribution of relative allelic ratios, as this provided the best discrimination between wild-type heterozygosity and LOH.
Methylation-specific PCR and sequencing of bisulfite-modified DNA
Ninety microliters of genomic DNA was denatured with 10 µL of 3 M NaOH for 15 min at 37℃ and modified with 1,040 µL of 2.3 M sodium bisulfite and 60 µL of 10 mM hydroquinone for 12 hr at 50℃, as described elsewhere (12, 13). The methylation-variable CpG sites reported in previous study of 11 somatic tissue types were chosen in the transitional area between promoters and retroelements (9). A total of 15 CpG sites selected from six CpG-island-negative genes (MAGEA2, TFF2, DDX53, MSLN, MASPIN, and BGLAP) and nine CpG-island-positive genes (MUC8, KIAA1752, CDKN2A, ESR2, PPARG, MLH1, CDH1, VDR, and RUNX3) were examined using methylation-specific PCR (MSP) primer sets (Supplementary Table 1 and 2). Supplementary Fig. 1 shows the coverage of CpG islands along with the distribution of retroelements in the 5'-end regions of the 15 genes examined.
For semiquantitative MSP analysis, a minimum number of PCR rounds to reach sub-plateau DNA amplification were performed using a radioisotope. The bisulfite-modified DNA was amplified and labeled by a hot-start PCR containing α-32P dTTP (PerkinElmer, Boston, MA, U.S.A.) and dNTP mixture through 32 PCR cycles. The PCR products were loaded onto a nondenaturing polyacrylamide gel and visualized by repeated autoradiography using a radioluminograph scanner (BAS 2500, Fuji Photo Film, Kanakawa, Japan) and analyzed with TINA image software (Raytest Isotopenmeβgerate, Straubenhardt, Germany). The specificity of each MSP primer set was validated using a standard curve for the universal methylated and unmethylated DNAs, as described elsewhere (9).
The relative proportion of the methylated CpG band to the total intensity of the methylated and unmethylated CpG bands was calculated from the MSP bands amplified by the MSP primer set. The proportion of methylated CpGs was divided into 5 levels; level 1 (0-20% methylation), level 2 (21-40% methylation), level 3 (41-60% methylation), level 4 (61-80% methylation), and level 5 (81-100% methylation). The results of the LOH and MSP analyses on the four cancer types are listed in Supplementary Table 3.
The methylation-variable CpGs of the TFF2, MSLN, BGLAP, CDKN2A, and MLH1 genes were analyzed by cloning and sequencing of the common PCR DNA (Supplementary Fig. 2). The common PCR primer sets were designed to span both the unmethylated and methylated CpGs in the CpG amplicons. The PCR product of each common primer set was cloned into the T&A cloning vector (Real Biotech, Taipei, Taiwan). The DNA sequencing was performed using a BigDye Terminator Kit (PE Biosystems, Foster City, CA, U.S.A.) and an ABI automated DNA sequencer (PE Biosystems, Warrington, U.K.). The intensity of the MSP bands was compared with the distribution of methylated CpGs, which were determined by cloning and sequencing of the common PCR amplicons.
Methylation analysis of normal somatic tissues
The methylation status of the transitional CpGs examined in 11 normal somatic tissues was previously reported (9). This study extended the previous data by adding six transitional sites (TFF2, MSLN, BGLAP, MUC8, KIAA1752, and PPARG) and three somatic tissues (fat, ovary, and testis). A total of eleven tissue types were collected from 51 individuals. The bone marrow and fat stromal cells were obtained from three individuals (10) and each of the remaining nine tissue types were obtained from five individuals. The stomach and colon was divided into proximal and distal portions according to the anatomic landmarks, gastric body and the splenic flexure of the colon.
Analysis of in-silico data
A total of 32 SAGE libraries for the embryonic stem cells, placenta, stomach, colon, and breast tissues were obtained from a public database (http://cgap.nci.nih.gov/SAGE/). Six expressed sequence tag (EST) libraries for the nasopharyngeal tissues were collected from a public database (http://cgap.nci.nih.gov/Tissues) because of no SAGE data available. The SAGE and EST libraries analyzed are listed in Supplementary Table 4. The SAGE tags and EST tags were assigned using UniGene cluster ID by accumulating the total expressed tags to the matched genes at each tissue library. A total of 434,325 expressed tags in the 32 SAGE libraries corresponded to the 15,770 gene symbols through tag-to-gene matching.
The genomic location of the NCBI RefSeq cDNA sequences was obtained from the genome web site (UCSC Golden Path May, 2004 assembly, http://genome.ucsc.edu/). A 3-kb sized non-overlapping window was used to analyze a DNA segment upstream and downstream of the transcription start site. The coverage of CpG islands and the distribution of retroelements compiled from searches of the genome database were evaluated by inputting the sequence data that was delimited from the 5'-end regions into a local program. The annotation of retroelements was made using the Repeat-Masker program (http://ftp.genome.washington.edu/RM/RepeatMasker.html). A total of 15,770 active genes showing the tag-and-gene match were demarcated by the presence or absence of CpG islands at the transcription sites as well as the types of nearby retroelements existing in a 3-kb window. For the fidelity of the genome-wide expression data, we compared SAGE and Affymetrix GeneChip (http://symatlas.gnf.org/SymAtlas), and there was strong agreement in major mRNA content of the analyzed tissue types (data not shown) as previous reports (15, 16). However, the SAGE data was found to reliably reflect the wide-range of transcription level by counting the sequence-based 'digital' tags, while the microarray data based on the fluorescence signal was not suitable for defining the active or inactive transcription status as well as the estimation of strong transcription activities due to the limit of probe hybridization method.
Statistical analysis
A chi-square test was used to compare the methylation changes between gastric, colonic, mammary, and nasopharyngeal cancers. The Pearson's correlation coefficients of the expressed tag numbers in different tissues were calculated to determine the similarities of the individual gene expression. A two-sided p value <0.05 was considered significant.
RESULTS
The level of chromosomal losses estimated in four cancer types
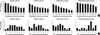
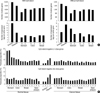
The LOH events in each cancer were determined using 40 microsatellite markers on eight cancer-associated chromosomes. In order to count the substantial loss of a chromosome, a unilateral chromosomal loss was defined when two or more allelic losses were detected on a single chromosome in cancer tissue. Fig. 1 shows the frequency of individual chromosomal losses and the number of chromosomal losses examined in four cancer types. The losses of chromosomes 17p and 18q were most frequent in gastric (72% and 68%) and colonic cancers (64% and 56%). An 8p loss was most common in mammary cancers (60%) and 9p loss (72%) most frequent in nasopharyngeal cancers. The level of LOH was categorized as high level (involving four or more chromosomes) and low level (involving less than four chromosomes). High- and low-level chromosomal losses had a similar frequency in gastric (56% vs. 44%) and colonic (48% vs. 52%) cancers. Mammary and nasopharyngeal cancers frequently showed low-level (64%) and high-level (72%) chromosomal losses, respectively.
Methylation changes in the transitional-CpG sites
A total of 15 transitional-CpG sites selected from six CpG-island-negative genes (MAGEA2, TFF2, DDX53, MSLN, MASPIN, and BGLAP) and nine CpG-island-positive genes (MUC8, KIAA1752, CDKN2A, ESR2, PPARG, MLH1, CDH1, VDR, and RUNX3) were examined using MSP primer sets (Supplementary Fig. 1, Supplementary Table 1-3). The methylation density of the CpG amplicon was divided into the following 5 levels: 1 (0-20%), 2 (21-40%), 3 (41-60%), 4 (61-80%), and 5 (81-100%). The frequency of the methylation changes was scored as the number of the CpG amplicons showing a difference in the level of methylation between the normal and tumor DNAs.
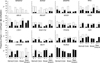
Fig. 2 shows the methylation status of the transitional-CpG sites examined in the four cancer types. The non-island CpG sites round the transcription start sites of the MAGEA2, TFF2, and DDX53 genes lacking CpG islands were hypomethylated at various frequencies (16-48%). The CpG-island margins of the VDR, MLH1, and RUNX3 genes bordered by retroelements at a long distance had a tendency for hypermethylation in various frequencies (16-76%). A total of 1,500 CpG amplicon pairs were obtained from 100 pairs of the normal and cancer DNAs using 15 methylation primer sets, of which 617 (41%) showed a similar frequency of hypermethylation (320, 20%) or hypomethylation (297, 21%) changes in the cancer DNA. Nine CpG-island margins (900 CpG amplicon pairs) and six non-island CpG sites (600 CpG amplicon pairs) were mainly hypermethylated (hyper- vs. hypo-methylation, 25% vs. 16%) and hypomethylated (hyper- vs. hypo-methylation, 16% vs. 26%) in cancer tissues, respectively (p<0.0001).
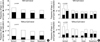
A total of 225 CpG amplicon pairs from nine CpG-island margins and a total of 150 CpG amplicon pairs from six non-island CpG sites were analyzed in 25 cancer tissues tested for each cancer type. Fig. 3 shows the relationships between the transitional-CpG methylation status and the level of LOH analyzed in the four cancer types. A comparison of the four cancer types showed that hypomethylation of the CpG-island margins tend to be more common in gastric (21%) and nasopharyngeal (18%) cancers than in colonic (13%), and mammary (10%) cancers (p=0.009). The hypomethylation of the non-island CpG sites was more frequent in the gastric (32%) and colonic (33%) cancers than in the mammary (21%) and nasopharyngeal (19%) cancers (p=0.013). Hypomethylation of the transitional-CpG sites frequent in gastric cancers was associated with high-level chromosomal losses (CpG-island margins, p<0.0001; non-island CpG sites, p=0.006).
Methylation status of transitional CpGs in normal somatic tissues
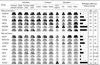
The methylation status of the 15 transitional-CpG sites, including the methylation data reported previously (9, 10), was analyzed comparatively in the 11 somatic tissue types (Fig. 4). The mean level of transitional-CpG methylation estimated in three or five individuals was calculated for each tissue type. The somatic tissues were classified into the three germ-layer lineages to determine the lineage-dependent pattern of transitional-CpG methylation. Eight of the nine CpG-island margins were completely unmethylated or most hypomethylated in the mesodermal lineage and all six non-island CpG sites were the most hypermethylated. Meanwhile, seven CpG-island margins were most hypermethylated in the endodermal lineage and three non-island CpG sites were the most hypomethylated. The CpG-island margins were slightly hypomethylated in the ectodermal lineage compared with the endodermal lineage.
Analysis of the transcript populations based on CpG islands and nearby retroelements
The number of active genes and the mean number of expressed tags (i.e. mean transcript number) per active gene were used to access the net output of transcription in each tissue (Fig. 5A). A total of 15,770 active genes obtained from the SAGE data were categorized according to the presence or absence of CpG islands. The number of active genes in both gene groups with and without CpG islands was higher in the embryonic stem cells than in the placenta. The transcript number per active gene in the gene group with CpG islands was higher in the embryonic stem cells while that in the gene group lacking CpG islands was higher in the placenta. The somatic tissues also showed an inverse correlation between the total number of active genes and the transcript number per active gene in the gene group lacking CpG islands. The genes with CpG islands showed a low number of active genes as well as the transcript number per active gene in the normal stomachs compared with the other normal tissues.
All cancers tended to show an increase in the number of active genes accompanying the down-regulation of tissue-specific strong gene expression. Gastric and colonic cancers increased the number of active genes with and without CpG islands. Gastric cancers increased the transcript number per active gene in the gene group containing CpG islands and decreased the transcript number in the gene group lacking CpG islands. Colonic cancers showed a lower transcript number per active gene in both the gene groups with and without CpG islands. Mammary cancers showed a slightly higher number of the active genes in the gene group with CpG islands and a lower transcript number per active gene in the gene group lacking CpG islands.
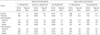
The type of retroelements in close proximity to the promoter was demarcated using non-overlapping 3-kb windows moving away from the transcription start site. The CpG-island-positive genes were classified into three gene groups according to the type of retroelements occupying a 3-kb window as follows; L1, Alu, and L1-Alu combination. The CpG-island-negative genes with L1 or L1-Alu in a 3-kb window were collectively classified as the L1-close gene group. The number of active genes was high in order of the breast, colon, and stomach irrespective of the type of nearby retroelements and the presence or absence of CpG islands (Table 1). There was an inverse correlation between the number of active genes and the transcript number per active gene in the CpG-island-negative gene group close to L1 elements in normal tissues. There was a similar number of active genes and a similar transcript number per active gene in each gene group in all cancers.
SAGE or the expressed sequence tag (EST) data was used to calculate the relative proportion of CpG-island-negative gene transcripts in the total transcripts (Fig. 5B). The CpG-island-negative gene group close to the L1 elements was transcribed in the highest proportion (13-27%) in the stomach and in the lowest proportion in the embryonic stem cells (3-4%). In all cancers, the proportion of CpG-island-negative L1-close gene transcripts reached intermediate levels (4-9%) compared with the placenta (9-12%) and embryonic stem cells (3-4%).
Tissue-specific gene expression profiles in embryo and somatic tissues
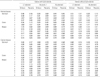
The Pearson's correlation coefficients of the transcript numbers of the individual genes between the somatic tissues and either embryonic stem cells or the placenta were calculated to determine the similarities in the gene expression profiles (Table 2). The transcript numbers of the CpG-island-negative genes in the placenta and embryonic stem cells were not associated with those in the stomach but strongly or weakly associated with those in the colon and breast. There was no or weak association between the transcript numbers of the CpG-island-positive genes close to L1 elements in the gastrointestinal tissues and placenta or in the breast tissues and embryonic stem cells. In all cancer tissues, including gastrointestinal cancers, the transcript numbers of both the genes with and without CpG islands were strongly associated with those of the embryonic stem cells as well as the placenta.
DISCUSSION
In this study, we investigated the four types of human cancers-gastric, colonic, mammary, and nasopharyngeal cancers using LOH and MSP to delineate the relationship of chromosomal losses with the DNA methylation and transcription profiles in cancers. The four human cancers can be distinguished for their preferred types and extents of LOH (Fig. 1), providing potential clues on the presence of cancer-type-dependent tumor suppressor genes. With respect to methylation changes, there was a similar tendency for the 15 transitional CpG sites in the four cancers; the hypermethylation of nine CpG-island margins and the hypomethylation of six non-island CpG sites (Fig. 2). A series of evidence proposes that retroelement methylation is prevented at the unmethylated CpG islands and promote the methylation of the non-island-CpG sites (1, 2, 17, 18). Both CpG-island margin hypermethylation and non-island CpG hypomethylation might be associated with the genome-wide pattern of retroelement methylation (6, 19). In addition, chromosomal losses reducing the active genes appear to influence the total number of active genes in the cancer genome through global methylation changes in the gene-control regions.
The hypomethylation of both the CpG-island margins and non-island-CpG sites was more common in gastric cancers than in other cancer types. The SAGE data demonstrated an increase in the number of active genes with and without CpG islands in gastric cancers and their expression profiles were similar to those of embryonic stem cells and the placenta (Table 1, 2). It is well-known that there are many similarities exist between carcinogenesis and embryogenesis, such as invasive growth and multi-lineage differentiation (20-23). The hypomethylation of the transitional-CpG sites in the gene-control regions may allow the reactivation of cell-intrinsic developmental programs that are repressed by transitional-CpG methylation in the adult somatic tissues.
In gastric cancer, the cases with high-level of chromosomal losses showed a significantly higher extent of hypomethylation for both the CpG-island margins and non-island CpG sites (Fig. 3). Meanwhile, the colon, breast, and nasopharynx with a higher number of active genes showed no significant association between the chromosomal losses and methylation changes in their cancer tissues. The different epigenetic and transcriptional changes in different cancer types are likely to commonly drive the universal malignant traits through the reactivation of the dormant cell-intrinsic programs for embryonic implantation and placentation (9, 12, 13). Therefore, the hypomethylation of the transitional-CpG sites associated with chromosomal losses might be uniquely prevalent in gastric cancers because the stomach with a small number of active genes needs an increase in the active genes for cancer evolution.
In the stomach, high-level chromosomal losses can cause the excessive reduction of active gene copies and have an adverse effect on cell viability. The hypomethylation of the transitional-CpG sites related to the global methylation pattern would increase the number of active genes as well as facilitate the reactivation of the inactive genes. In case of the normal colon with a large number of active genes, it is likely that the hypomethylation of the transitional-CpG sites in colonic cancers is not necessarily associated with high-level chromosomal losses. Similarly, the gene-dose-dependent methylation changes in both the genes with and without CpG islands appear to be relatively less dominant in mammary and nasopharyngeal cancers because their normal tissues already have a sufficient number of active genes.
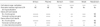
When the 11 normal tissue types were categorized based on the three germ-layer origins, the CpG-island margins, most of which are close to L1 elements or are bordered by retroelements at a long distance (Supplementary Fig. 1), were more methylated in the endoderm-derived tissues than in the other tissues (Fig. 4). In particular, the normal stomach had a lower number of active genes and higher transcript number per active genes in the CpG-island-negative gene group close to L1 elements. Previous studies suggest that during embryogenesis and development, highly repetitive Alu and L1 elements trigger genome-wide methylation as well as the spreading of methylation signals into the flanking CpGs (9, 24, 25). The dense methylation of the transitional-CpG markers indicates long-distance L1 methylation in the stomach, which is necessary for maintaining a small number of active genes as well as repressing a large number of genes (Table 3). Therefore, the tissue-specific methylation profiles established in consistent with the tissue-specific number of active genes are likely to be disturbed with chromosomal losses reducing the active genes in cancers.
With the accuracy of the SAGE data, the biased number of active genes is attributable to the total number of transcript tags counted in the SAGE library (26). However, both the SAGE and microarray data showed the strong expression of a small number of the active genes without CpG islands in the normal stomach (data not shown). The non-island-CpG sites were hypomethylated in the normal stomach whereas the hypermthylation of the CpG-island margins in the normal stomach (Fig. 4). This pattern of transitional-CpG methylation appears to be a useful epigenetic way for the maintenance of tissue-specific strong expression along with the inactivation of a large number of genes. Thus, it is possible that a set of the transitional-CpG sites examined in this study can serve as a global epigenetic marker for the total number of active genes established under the influence of genome-wide retroelement methylation.
Taken together, unilateral chromosomal losses, which reflect a reduction in the gene dose, might lead to the hypomethylation of the gene-control regions and an increase in the number of active genes in gastric cancers. The hypomethylation changes in the transitional CpG sites appear to facilitate the reactivation of cell-intrinsic embryogenesis-development programs in cancer cells as well. The results of this study explain how the LOH events initiate the invasive outgrowth of cancer cells similar to embryonic implantation and placentation.
 XML Download