

 PDF
PDF ePub
ePub Citation
 Print
Print


INTRODUCTION
Between one third and three fourths of maintenance hemodialysis patients show signs, symptoms, or laboratory evidence of malnutrition (1-5). There is a strong relationship between the extent of malnutrition and mortality. Specifically, low serum albumin levels appear to be independently associated with an increased risk of death in patients treated with hemodialysis (6). Several factors have been identified which may contribute to this problem. Among these are anorexia and decreased nutrient intake (7, 8), hormonal derangements, such as insulin resistance, increased glucagon sensitivity and excess parathyroid hormone levels (9-11), intake of multiple medications (12), metabolic acidosis (13, 14) and frequent hospitalization (15). Dialysis-related factors may also have an important impact on malnutrition (16, 17). There is a considerable amount of amino acid and/or protein loss during renal replacement therapy, and the amount of amino acid loss varies depending on the type of dialysis. The average loss of free amino acids in the dialysis fluid has been reported to be 5-8 g/dialysis during hemodialysis and 1.2-3.4 g/24 hr during CAPD (18-20). Losses of amino acid during hemodialysis may also contribute to malnutrition. An increased dose of dialysis and the use of biocompatible membranes have also been used to enhance nutritional status in hemodialysis patients. However, several randomized and nonrandomized clinical trials have shown conflicting results regarding the impact of the study intervention on nutritional parameters (21-23). The high flux membrane (HF) in the HEMO study did not prevent deterioration in nutritional status over time (24). Although amino acid losses during dialysis have been reported previously, these studies have been performed using conventional cellulose membranes. One study revealed that the high flux membrane resulted in significantly more amino acid loss into the dialysate when compared to the low flux membrane (LF) (20). However, when adjusted for surface area and blood flow, amino acid losses were not different. Although both surface area and blood flow influence amino acid losses to dialysate, the two membranes in this study were composed of different membrane material. There is no previous report comparing the difference between HF and LF composed of the same synthetic membrane material.
In this study, we measured the impact of two different hemodialysis membranes with the same synthetic membrane material on plasma amino acid concentrations, and simultaneously measured the amino acid losses into the dialysate.
MATERIALS AND METHODS
Patients
Ten patients participated in this study, which was conducted at the Soonchunhyang University Cheonan Hospital, Cheonan, Korea. All of the patients who participated provided informed consent. The study protocol was approved by the Ethics Committee of Soonchunhyang University Cheonan Hospital, Korea. All study patients were clinically stable on chronic hemodialysis treatment for a minimum of 24 months. We excluded patients who had cancer, active infection, previous cardiovascular disease, or unstable vital signs during maintenance hemodialysis. The data were collected in August 2005. The mean age of the patients was 57.2±14.6 yr and the mean time on hemodialysis was 75.3±42.9 months. Three of the patients were non insulin-dependent diabetics. The mean height of the ten patients was 164.9±7.6 cm, and the body weight was 58.6±11.7 kg. The mean body mass index was 21.5±3.3. Urea Kinetic modeling and protein catabolic rates (PCR) of the patients were calculated every three months. The Kt/V and nPCR results of the ten patients participating in the study were 1.52±0.22 and 0.92±0.24 g/kg/day, respectively. They had a mean serum albumin level of 3.74±0.56 g/dL. The ten patients had undergone LF dialysis and a sample was obtained, then they underwent HF dialysis and a sample was obtained. All patients had a small meal approximately one hour prior to each dialysis treatment, which was similar in composition. Patients were instructed to have a diet composed of a half bowl of rice with cooked vegetables.
Membranes
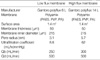
The characteristics of the membranes used in the study are shown in Table 1. LF (Polyflux 6L, Gambro dialysatoren; from Hechingen, Germany) and HF (Polyflux 14S, Gambro dialysatoren; Hechingen, Germany) membranes were composed of the same materials (PA polyamide; PAES polyarylethersulfon; PVP polyvinylpyrrolidone). The two membranes had the same surface area. However, the pore size distribution of the nanoporous polymeric membranes was different; these differences influence sieving capacity (25).
Plasma amino acid
Plasma amino acid concentrations were measured before and after dialysis performed using new dialyzers. The venous needle was inserted pointing toward the heart more than 5 cm proximal to the arterial needle to prevent the recirculation effect on plasma amino acid measure. Measured parameters included pre- and post-dialysis (15 min following termination of dialysis), blood samples from arterial blood lines for amino acid (AA) profiles, and blood chemistries at each dialysis session. Plasma samples were separated from blood within 15 min of collection, and all specimens were stored at temperatures -20℃ immediately, until specific assays were performed.
Dialysate amino acid
Dialysate amino acid losses were initially measured during the first use of the two dialyzers.
Blood flow and ultrafiltration volume were similar with the two dialyzers in each patient (LF: blood flow 250 mL/min, UF volume 2,700±220 mL, dialysate flow 500 mL/min, HF: blood flow 300 mL/min, UF 2,770±180 mL, dialysate flow 500 mL/min). Gambro AK 95S Hemodialysis machines (Gambro dialysatoren; Hechingen, Germany) were used. Dialysate fluid was collected 4 times per hour, at 100 mL each time, during hemodialysis. Dialysate amino acid was calculated by the mean of four aliquots. The aliquots of dialysate were stored at -20℃, until specific assays were performed.
Amino acid analysis
Blood chemistry (BUN, creatinine, glucose, sodium, potassium, and HCO3-) was performed using standard techniques (76600-020, Hitachi, Japan). HCO3- was performed using blood gas analysis (Rapidlab 248, Bayer Health Care, U.S.A.). Plasma and dialysate amino acid profiles were measured by reverse-phase high pressure liquid chromatography (HPLC) using a modified version of the methods of Bidlingmeyer et al. (25), and Heinrikson and Meredith (26), in which amino acids were derived from phenylisothiocyanate. The phenylthiocarbamoyl amino acids were then separated over a 65 min gradient and detected at 254 nm.
Statistics
Repeated measure analysis of variance was used to assess overall differences between the two types of membranes studied. Data were presented as mean±SD values. A probability value of p<0.05 was considered statistically significant. All statistical analyses were performed using SPSS for Windows (version 12.0, Chicago, IL, U.S.A.). We used paired t-tests to assess differences between membranes.
RESULTS
Patients' characteristics
The study included 6 male patients and 4 female patients. All patients took ferrous sulfates, calcium acetate, vitamin B12, and folic acid. Nine patients took antihypertensive drugs (angiotensin receptor blocker 9; beta-blocker 6; calcium channel blocker 5). Three diabetic patients took an oral hypoglycemic agent. All patients had native arteriovenous fistula. All patients had less than 100 mL residual urine volume.
Pre-dialysis serum concentrations of BUN (45.98±9.08 mg/dL), creatinine (10.4±2.78 mg/dL), sodium (139.33±3.57 mEq/L), potassium (4.91±0.67 mEq/L), and HCO3- (23.39±2.69 mEq/L) were not different in patients, regardless of the dialyzers used. High sensitive C-reactive protein was 2.61±0.94 mg/L.
Plasma amino acid profile
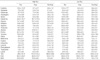
The concentration of individual amino acids as well as the concentration of groups of amino acids (total, essential, and branched chain) in plasma before and after dialysis for each of the membranes is shown in Table 2. Pre-hemodialysis plasma amino acid levels were not significantly different in comparisons between the two dialysis membrane groups for any individual amino acid except glutamate (9.69±5.27 vs. 15.52±6.52 mg/L).
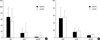
For HF, the reduction in plasma amino acid levels for total amino acids and essential amino acids were statistically significant, although the reduction of branch chained amino acids was not statistically significant. For LF, the reduction in total plasma amino acid levels was statistically significant. The difference in reduced levels of total amino acids (TAA), essential amino acids (EAA), and branched chain amino acids (BCAA) was not significant in comparisons between the two membranes (Fig. 1).
Dialysate amino acid losses
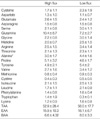
Amino acid losses in the dialysate for the two membranes are shown in Table 3. TAA, EAA, and BCAA were not significantly different in comparisons between the two membranes. Alanine loss in the dialysate was greater in the low flux membrane than in the high flux membrane.
The reduction in some plasma amino acids (aspartate, cystine) was greater than dialysate losses in the high flux membrane, but the reduction of proline and leucine was less. The reduction in some plasma amino acids (cysteine, aspartate, cystine) was greater than dialysate losses for the LF, but the reduction of leucine was less. Although it was not statistically significant, the dialysate losses of BCAA were greater than the reduced amount of BCAA in plasma (Fig. 1).
DISCUSSION
Multiple factors may contribute to the abnormal amino acid profile seen in chronic renal failure. Many patients experience anorexia, nausea, and vomiting caused by illness, inadequate dialysis or medication, and a moderate amount of amino acids are lost during each hemodialysis (18-20). In addition, altered lipid metabolism, metabolic acidosis, decreased muscle mass, and insulin resistance may also be closely related to the mechanism causing plasma amino acid abnormalities in end stage renal disease (27-30).
Hemodialysis, with certain types of membranes, has been shown to increase protein catabolism. It has been observed that the breakdown of skeletal muscle protein occurs during sham dialysis with bioincompatible cellulosic membranes in healthy subjects (31). However, in our study, biocompatible membranes were used. These membranes have a minimal effect on complement activation, which induces the breakdown of skeletal muscle protein.
HF had a larger pore size and a middle molecule sieving coefficient (32). Although the dose and flux intervention may subtly influence certain nutritional parameters, neither intervention prevented deterioration of nutritional status over time (24). HF does not improve nutritional parameters. We suggest that one of the causes of greater nutritional losses to dialysate in HF is due to the large pore and bigger sieving coefficient. A previous report showed that HF resulted in a significant loss of amino acids into the dialysate when compared to LF (20). However, when adjusted for surface area and blood flow, amino acid losses were not different. Our study findings, with synthetic membranes, are consistent with the above result. We fixed the membrane surface, blood flow, and dialysis flow. Total dialysate amino acid losses were not different, and the reduction of plasma EAA was equal to dialysis losses for both membranes studied. HF, with a large pore size and sieving coefficient, did not influence the dialysate amino acid losses.
Increased attention has focused on the plasma levels of leucine, isoleucine, and valine, the so-called BCAA, because leucine has been shown to enhance protein synthesis in vitro. Dialysate losses of BCAA were greater than the reduction of plasma BCAA, although this was not statistically significant. This discrepancy suggests an enhanced appearance of new amino acids during dialysis, most likely from other tissue stores such as skeletal muscle. Our patients had no metabolic acidosis. Ikizler et al. (33) showed that hemodialysis is an overall catabolic event, decreasing the circulating amino acids, accelerating rates of whole body and muscle proteolysis, stimulating muscle release of amino acids, and elevating net whole body and muscle protein loss.
Our findings suggest that the hemodialysis membrane itself has a major impact by either increasing catabolism and/or from losses to the dialysate.
Our study of amino acid loss in hemodialysis patients has several limitations, although we believe that these do not invalidate its conclusions. First, the number of our study sample was very small. Second, the nutritional marker was varied, but in our study only nPCR, albumin, and cholesterol were measured. The nutritional status could affect the level of plasma amino acid. The patients were clinically stable, but if subjective global assessment, prealbumin, and transferrin were measured, which could explain the nutritional status of the patients. Third, recirculation has an effect on the level of plasma amino acid, but we did not measure recirculation. To prevent recirculation, there was more than 5 cm distance between artery puncture and venous puncture. Fourth, we measured only the concentration of plasma amino acid before and after hemodialysis and the concentration of dialysis amino acid. We did not consider that hemodialysis itself could have caused a catabolic event. The muscle and whole body proteolysis could happen, and plasma amino acid concentration might be affected. Fifth, HF was done only once. We did not consider that repeated usage could have an effect on the concentration of plasma amino acid.
In conclusion, amino acid losses to dialysate were not different in comparisons between HF and LF when dialysis dose and blood flow were adjusted. HF with its large pore size and sieving coefficient does not influence dialysate amino acid losses. However, hemodialysis itself may influence dialysate amino acid losses and may have an effect on muscle breakdown. Improved protein metabolism should be pursued in patients undergoing hemodialysis.
 XML Download