

 PDF
PDF ePub
ePub Citation
 Print
Print


INTRODUCTION
It has been reported that fenofibrate prevents weight gain (1) or body adiposity (2) in a variety of animal models (3-5). The mechanism that explains the effects of the peroxisome proliferator-activated receptor (PPAR) α activator has been attributed to increased fat catabolism in the liver primarily resulting from the induction of target enzymes involved in hepatic lipid metabolism (6, 7). According to a recent report (8), the effect of fenofibrate on adipose tissue metabolism may also contribute to decreasing adipose tissue. We have also previously shown that fenofibrate therapy reduced abdominal and skeletal adiposity and enhanced hepatic expression of fatty acid translocase (FAT)/CD36 and carnitine palmitoyltransferase (CPT)-I mRNA (9).
The effect on food intake of the PPAR α activator has been inconsistent. Some have reported that reduced adiposity with fenofibrate was associated with the reduction of food intake in obese diabetic rats (9), high-fat-fed rats (10) and diabetic mice (11); however, there have been several reports showing that PPAR α did not change with food intake.
PPAR α has also been suggested to regulate energy homeostasis. Three distinct uncoupling protein (UCP) isoforms, UCP-1, UCP-2, and UCP-3, have been implicated as mediators of thermogenesis. Brown adipose tissue (BAT) has been known to be an important site of thermogenesis in rodents. UCP-1, which is expressed exclusively in BAT, expression levels are reduced in several rodent models of obesity (12). UCP-1 functions to uncouple oxidative metabolism from ATP synthesis, resulting in the generation of heat (13). There is strong evidence that increased fat metabolism is associated with increased expression of UCP-2 and UCP-3 (14, 15). In addition, PPAR α as well as γ activators have been suggested to induce the expression of UCP-2 in hepatocytes (16) and UCP-3 in adipose tissues (17, 18) and skeletal muscles (19). Treatment of db/db mice with WY-14643, one PPAR α activator, did not affect expression of UCP-1, -2, or UCP-3 in BAT (20).
In a previous study, we suggested that the relationship between increased β-oxidation and anti-adiposity resulted in "the burning fuel effect" (9). We thought that fenofibrate increased fatty acid oxidation in hepatic mitochondria and consumed fat fuels, which resulted in increasing hepatic influx of fatty acid from fat depots especially from visceral fat. However, it was unclear how increased β-oxidation by chronic treatment with the PPAR α activator could increase energy expenditure rather than energy generation in the liver.
In this study, we hypothesized that chronic fenofibrate treatment might increase energy expenditure by induction of an uncoupling mechanism in the hepatic and/or skeletal muscular mitochondria, which may contribute to a decrease in body adiposity.
MATERIALS AND METHODS
Animals and diet
Otsuka Long-Evans Tokushima Fatty (OLETF) rats four weeks of age, a type 2 diabetes animal model (n=14) were kindly donated from Otsuka Pharmaceuticals (Tokushima, Japan); diabetes mellitus did not develop in any of these rats until 61 weeks of age for unknown reasons. They were fed with the standard rat diet and tap water ad libitum until 10 weeks of age. At this age, all of the OLETF rats were randomly divided into two groups. The average body weight of rats in the two groups was not significantly different. The one, the fenofibrate group (n=7), was fed with powdered diet, mixed with micronized fenofibrate (0.5% w/w, 320 mg/kg/day) and the other, the control group (n=7), was fed with powdered diet only. The fenofibrate group was fed freely. For paired-feeding, the total food intake of the fenofibrate group was monitored every two days and the same amount of food intake was provided to the control group. Body weights of each rat were monitored weekly. All the rats were cared and handled during the entire period of the experiment by the Guidelines for Animal Experiments developed by The Korean Academy of Medical Sciences.
Measurement of blood glucose and ketone levels
At 60 weeks of age, after 12 hr of fasting, all rats inhaled ether after which we sampled blood from the tail vein for measurement of glucose and β-ketone. Whole blood glucose and β-ketone levels were measured with a MediSense Optium using blood glucose strips and β-ketone test strips (Abbott Laboratories, MediSense Products, Bedford, MA, U.S.A.).
Measurement of plasma lipid and insulin levels
At 61 weeks of age, after 12 hr fasting, all rats inhaled ether and were injected with ketamine (200 mg/kg) into the peritoneum. After the anesthesia was administered, we sacrificed all of the rats; blood samples were drawn for measurements of the plasma levels of free fatty acid, total cholesterol, triglyceride, high-density lipoprotein cholesterol (HDL-C) and insulin from the inferior vena cava. The blood samples were collected in 4.5% EDTA-treated bottles and stored in ice bottles at -20℃. The plasma levels of total cholesterol (Infinity Cholesterol Reagent, Sigma Diagnostics, St. Louis, MO, U.S.A.), triglyceride (Infinity Triglycerides Reagent, Sigma Diagnostics, St. Louis, MO, U.S.A.) and HDL-C (EZ HDL Cholesterol, Sigma Diagnostics, St. Louis, MO, U.S.A.) were measured by the enzyme method. The plasma level of free fatty acid (FFA) was measured by the ACS-ACOD enzyme method (NEFA ZYME-S, Aiken, Japan). Plasma insulin levels were analyzed with a rat insulin radioimmunoassay kit (Linco Research Inc, St. Charles, MO, U.S.A.).
Measurement of fat amount by MRI
At 61 weeks of age, a day after body temperature measurement, six rats were selected randomly for MRI study. All rats were anesthetized as in the method described above. The rats (n=3 in each group) were placed in supine position with a V shaped hand-made fixing device to secure a constant position with flexion of the hip joint to prevent stretching of the thigh muscle. The imaging was performed on a 1.5 Tesla MRI machine (Magnetom Vision, Siemens, Erlangen, Germany) with a loop coil at the mid-abdominal level. Coronal and axial scans were obtained. First, the coronal scout view was obtained and then the axial scan was performed at the level just inferior to the lower pole of left kidney. The image parameters of T1 weighted images were 350/30 msec of TR/TE (time to repetition/time to echo), 8.8×10 cm of field of view, 190×256 for matrix number and three times for acquisition. In the scanned images, the areas of the region of interest presenting visceral and subcutaneous fat tissue were calculated automatically with an installed program (Vision VB33D) in the MRI.
Reverse Transcriptase-Polymerase Chain Reaction (RT-PCR) analysis
At 61 weeks of age, we obtained tissue samples for RT-PCR. Total RNA was isolated using TRIzol (Life Technologies, U.S.A.). Complementary DNA was synthesized from RNA samples by enhanced AMV reverse transcriptase. An aliquot of the reverse transcription reaction was then used for subsequent PCR amplification with specific primers. The sequences of the sense and antisense primers used for amplification were as follows: UCP-2, 5'-AACAGTTCTACACCAAGGGC-3'and 5'-AGCATGGTAAGGGCACAGTG-3'; UCP-3, 5'-GGAGCCATGGCAGTGACCTGT-3'and 5'-TGTGATGTTGGGCCAAGTCCC-3'; β-actin, 5'-GTGGTGGTGAAGCTGTAGCC-3'and 5'-GAGACCTTCAACACCCC-3'. PCR was performed in the Gene Amp PCR system 2,400 (Perkin-Elmer, U.S.A.). After initial denaturation for 5 min at 94℃, PCR was performed for 30 cycles for all samples. Each cycle consisted of denaturation at 94℃ for 1 min, primer annealing at 56℃ for 1 min, and primer extension at 72℃ for 1 min. A final 5 min extension step at 72℃ was included. Amplification of each gene yielded a single band of the expected size (UCP-2, 471 bp; UCP-3, 179 bp; beta-actin 763 bp). Preliminary experiments were carried out with various amounts of cDNA to determine nonsaturating conditions of PCR amplification for all of the genes studied. Therefore, under these conditions, the RT-PCR method used in this study permitted relative quantification of mRNA. The illuminated bands were quantified by Image Gauge (Fujifilm, Tokyo, Japan). The results of the expression of specific mRNAs were presented relative to the expression of the control gene.
Western blot analysis
Frozen hepatic tissue were homogenized in a buffer containing 50 mM Tris (pH 7.4), 150 mM NaCl, 1 mM EDTA, 25 mM sodium fluoride, 0.2% Triton X-100, 0.3% NP 40 and protease inhibitors (aprotinin 1 µg/mL, leupeptin 1 µg/mL PMSF 10 mM/L). The homogenates were centrifuged and the supernatant was decanted and saved on ice. Protein concentrations were measured using the BCA kit (Sigma Chemical Co., St. Louis, MO, U.S.A.). The proteins were separated on a 12% SDS-polyacrylamide gel and transferred electrophoretically onto a nitrocellulose membrane (Amersham, Arlington Heights, IL, U.S.A.) using a mini electroblotter (BioRad Laboratories, Hecules, CA, U.S.A.). The nitrocellulose membrane was blocked in Tris-buffered saline containing 0.1% Tween and 5% non-fat milk and then incubated over night at 4℃ in anti-rat UCP3 polyclonal antibody (Fitzgerald Industries International, Inc, MA, U.S.A.). After washing in Tris-buffered saline containing 0.1% Tween, blots was incubated with an anti-rabbit IgG antibody conjugated to horseradish peroxidase (Amersham, Arlington Heights, IL, U.S.A.). Immunoreactive bands were visualized with ECL Plus™ Western Blotting Detection Reagents (Amersham, Arlington Heights, IL, U.S.A.). β-actin (42 kDa; Sigma Chemical Co., St. Louis, MO, U.S.A.) was used as the internal control.
Measurement of core temperature
At 61 weeks of age, all rats were anesthetized with ketamine (200 mg/kg, intraperitoneal injection), and the thermometer probe (Temperature controller, DX4-PSSNR, KSC 1614, HANYOUNG, Seoul, Korea) was placed into the esophageal and rectal canals. We evaluated both temperatures twice on separate days under the same conditions.
Statistical analysis
All results are presented as means±SEM. Significant differences in the data between the groups were analyzed by the Mann-Whitney U test. We used the statistical programs in SPSS 9.0 version for Windows. In all cases, a p value estimated less than 0.05 was considered significant.
RESULTS
Change of body weight
As mentioned previously, the fenofibrate group was fed freely and the control group was fed the same amount as the fenofibrate group. The mean amount of daily food consumption in both groups was 26.1±2.8 g. The body weights in both groups increased continuously until the end of experiment.
The mean body weight of the control group was 744.3±14.9 g and that in the fenofibrate group was 531.6±7.6 g at 61 weeks of age. The average weight of the fenofibrate group was significantly less than that of the control group from 14 through 61 weeks (p<.005, Fig. 1A).
The weight gain during the experimental period in the fenofibrate group (326.6±8.5 g, 160.2±7.8%) was significantly decreased compared to the control group (543.7±11.0 g, 271.2±12.3%) (p=0.002, Fig. 1B).
Blood glucose, insulin, lipid and ketone levels
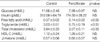
The whole blood glucose level in the fenofibrate group (7.98±0.97 mM/L) was slightly decreased compared to that of the control group (11.06±2.48 mM/L), but the difference was not significant. The plasma insulin levels were not significantly different between the two groups (Table 1). As has been already noted, diabetes did not develop in this strain.
To verify the effects of fenofibrate treatment, we measured plasma lipid profiles. At the end of the experiment, the plasma levels of FFA, triglyceride and total cholesterol in the fenofibrate group were significantly decreased compared with those in the control group (p<.05). The HDL cholesterol levels showed no significant difference between the two groups. The whole blood β-ketone of the fenofibrate group (0.60±0.07 mM/L) was slightly increased compared to that of the control group (0.57±0.06 mM/L) but this finding was not significant (Table 1).
Abdominal fat size
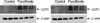
We measured abdominal fat composition with MRI. The areas with visceral and subcutaneous fat were calculated automatically. As shown in Fig. 2, the visceral fat area, representing V, was 21.0±0.7 cm2 and the subcutaneous fat area, representing S, was 7.4±0.4 cm2 in the control group (Fig. 2A). The visceral fat area and the subcutaneous fat area were 11.0±0.9 cm2 and 4.2±0.3 cm2, respectively, in the fenofibrate group (Fig. 2B). Therefore, the fat areas were significantly decreased in the fenofibrate group compared to the control group (p=0.046) (Table 2).
The expression of UCP-2 and UPC-3 in liver and muscle
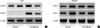
To examine whether UCP-2 and UCP-3 in liver and muscle were unregulated by fenofibrate, we measured the expression of UCP-2 and UCP-3 mRNA by RT-PCR. As shown in Fig. 3, the expression of UPC-2 mRNA in liver and muscle did not show a sighificant difference between the two groups. The expression of UCP-3 mRNA in muscle showed no difference between the groups. However, hepatic UCP-3 mRNA appeared to be newly synthesized with fenofibrate treatment (Fig. 3A).
De novo expression of UCP-3 mRNA levels in the liver were reflected by the parallel effects on UCP-3 protein content, as measured by Western blot analysis (Fig. 4). In the fenofibrate treatment group, UCP-3 protein was detected, but not in the control group.
Body core temperature
If hepatic UCP-3 works as an uncoupling protein, the body core temperature may be increased. We measured body core temperatures to confirm this hypothesis. The esophageal temperatures were significantly higher in the fenofibrate group compared to those in the control group (37.7±0.1 vs. 37.3±0.1, p=0.025). The rectal temperatures were also significantly higher in the fenofibrate group compared to the control group (33.1±0.2℃ vs. 32.2±0.1℃, p=0.005) (Fig. 5).
DISCUSSION
We found that chronic fenofibrate treatment resulted in decreased body weight and abdominal adiposity. These effects of fenofibrate treatment were not associated with a dietary factor because the amount of oral intake was the same in both groups studied.
We also found that the core temperatures of the fenofibrate treated rats were significantly increased. This demonstrates that a large amount of energy was dissipated as heat especially from the liver. This heat may have resulted from uncoupling by UCP-2 as well as UCP-1 and UCP-3, if they are expressed in the liver.
In this study we observed that fenofibrate did not significantly increase the expression of UCP-2 mRNA and UCP-3 mRNA in skeletal muscle, but induced newly expressed UCP-3 mRNA in hepatic tissues. These data suggest that the major target organ for fenofibrate treatment is the liver, not skeletal muscles.
The exact physiologic role of UCP-3 in the liver is uncertain. There are two theories suggested on the function of UCPs. One is the uncoupler theory and the other is the exporter theory. The uncoupler theory can explain the anti-adiposity effect of fenofibrate. Fenofibrate increases β-oxidation of fatty acid, which leads to the production of acetyl CoA. Acetyl CoA may enter the TCA cycle, where it is converted into citrate by citrate synthase. During β-oxidation of fatty acids and the TCA cycle, high-energy electrons in the form of nicotinamide adenine dinucleotide (reduced from) (NADH) or flavin adenine dinucleotide (reduced from) (FADH) are generated. These electrons released in the re-oxidation of NADH and FADH2 flow through the electron-transport chain to generate a proton gradient across the inner mitochondrial membrane. When these protons flow through uncoupling proteins (such as UCP-3), their energy is converted into heat and then dissipated (21).
The function of UCP-3 as an exporter has also been postulated; this protein could be an exporter of fatty acid anions from the mitochondrial matrix under conditions of increased fatty acid oxidation (21). This hypothesis proposes that excess acyl CoA, within the mitochondria, is hydrolyzed by a mitochondrial acyl CoA thioesterase, yielding a fatty acid anion and coenzyme A (CoASH). The fatty acid anion is exported to the cytosol by being carried across the inner mitochondrial membrane by UCP-3. The exported fatty acid anion returns to the pool of fatty acid anions in the cytosol and is recycled by ATP consumption (22). Thus the energy consumption, via UCP proteins in the liver, can be explained by the uncoupler or exporter theory, though the efficiency of energy consumption would be different for each of them.
A recent report by Linn et al. (23) showed that fenofibrate induced de novo expression of UCP-3 in the liver of Winstar rats. They suggested that such de novo expression was associated with enhanced fatty acid metabolism by fenofibrate. Because UCP genes contain functional PPAR-responsive elements (24), they may be target genes for the PPAR activator (25).
The increased core (esophageal and rectal) temperatures suggest that fenofibrate treated rats may increase heat production or metabolic rate. If the major role of hepatic UCP-3 is an uncoupler, this de novo expression of UCP-3 by fenofibrate treatment may be indirect evidence that fenofibrate can increase heat production or energy expenditure.
The increased body core temperature and hepatic UCP-3 expression induced by fenofibrate supports the hypothesis that hepatic UCP-3 works as an uncoupler protein rather than an exporter protein. However, we did not provide direct evidence that UCP-3 works as an uncoupler. This unsolved topic may be resolved by measuring state-4 respiration and membrane potentials of isolated hepatic mitochondria, which would be diagnostic of mitochondrial uncoupling activity.
There may be no reason to accumulate adipose tissue in subcutaneous regions under conditions of increased core temperature; this is because the major function of subcutaneous fat is to insulate the body by maintaining heat at a constant body temperature. Thus the loss of subcutaneous fat mass might be enhanced by adaptive responses to increased core temperature.
In conclusion, fenofibrate decreases visceral and then subcutaneous fat mass. A possible hepatic mechanism for decreasing visceral adiposity is that fenofibrate increases hepatic energy dissipation via de novo expression of UCP-3 in mitochondria. The decreased subcutaneous fat mass results from adaptive mechanisms in response to increased core temperature induced by increased energy combustion.


 XML Download