

 PDF
PDF ePub
ePub Citation
 Print
Print


INTRODUCTION
In epidermal differentiation keratinocytes undergo a complex series of biochemical and morphologic transformations leading to terminally differentiated corneocytes. Differentiation of keratinocytes begins in the basal layer where daughters of stem cells become transit amplifying cells. Following a finite number of divisions transit amplifying cells leave the basal layer and continue to metamorphose as they migrate through the layers of the epidermis (1). Calcium gradients are a critical factor in the process of keratinocyte differentiation (2).
The transforming growth factor (TGF)-β is crucial for normal epidermal growth and differentiation as evidenced by abnormal skin phenotypes in transgenic mice with either increased or decreased levels of functional TGF-β (3). Five distinct TGF-β genes have been identified, designated TGF-β1 to -β5. The three mammalian isoforms (TGF-β1 to -β3) share 70-80% amino acid homology, are nearly 100% conserved across species, and show similar functions in vitro (4, 5). However, TGF-β isoforms have been shown to be differentially expressed spatially and temporally in vivo, throughout embryogenesis (6), tissue repair (7) and carcinogenesis (8, 9), suggesting distinct roles of the individual isoforms in vivo.
Recent studies have revealed differential functions for each TGF-β isoforms in keratinocyte proliferation and differentiation. For example, TGF-β1 was localized to the upper differentiated layers, the stratum granulosum and corneum, whereas TGF-β2 and, weaker, TGF-β3 immunostaining was present in all suprabasal layers of normal keratinizing epithelium (10). Moreover, the loss of TGF-β1 and -β2 expression in hyperproliferating squamous cells is associated with a high risk of maliganant conversion (11).
In the present study, we investigated the differences in the expression of TGF-β isoforms in proliferation and differentiation of a human keratinocyte cell line, HaCaT. In this model system, growth and differentiation of cultured keratinocytes were induced by the different Ca2+ concentrations in culture media. When keratinocytes are cultured in a medium containing low Ca2+ concentrations (0.03 mM), cells maintain a proliferative basal cell phenotype. By elevating the Ca2+ concentration to above 0.1 mM, keratinocytes can be induced to differentiate in vitro (12). Further elevation of Ca2+ concentrations to 1.0 mM induces terminal differentiation and cornification. This differentiation process closely follows the maturation pattern of epidermis in vivo (13). This study reports here that differential expression of TGF-β isoforms during Ca2+ induced differentiation and suggests that differential functions for each TGF-β isoforms in epidermal differentiation.
MATERIALS AND METHODS
Cell culture
The human keratinocyte cell line HaCaT was cultured in Dulbecco's modified Eagle's medium (DMEM) supplemented with 10% fetal bovine serum and 100 u/mL penicillin/streptomycin at 37℃ and in 5% CO2. For experiments, HaCaT keratinocytes were seeded in 6-well plates (2×10⁵/well) containing keratinocyte growth medium (0.15 mM Ca2+; Clonetic, Walkersville, MD, U.S.A.) and at 1 day postconfluence (1DPC) medium was changed to keratinocyte basal medium (KBM minus Ca2+ and growth factors) for 24 hr. KBM was then changed to experimental medium: KBM containing EGF (5 ng per mL), insulin (5 µg per mL), hydrocortisone (0.5 µg per mL), and bovine pituitary extract (30 µg per mL) with either 0.03, 0.1, 0.7, 1.0 and 1.2 mM Ca2+ (3 mL per well). Cells were exposed to experimental medium for 24 hr followed by another 48 hr of the identical medium. The total experimental period was 96 hr.
Measurement of TGF-βs by ELISA
At the indicated times, the culture media were harvested and stored at -80℃ until ELISA for TGF-βs was performed. TGF-βs in the conditioned medium were determined using an human TGF-βs immunoassay kit (R&D systems; Minneapolis, MN, U.S.A.). Briefly, ELISA plates were coated overnight at 4℃ with 100 µL of mouse anti-human TGF-βs-coating antibodies that had been diluted in 1×Voller's buffer (pH 9.6). Samples to be tested were first activated by 1 N HCl for 10 min and then neutralized by 1.2 N NaOH/0.5 M HEPES at room temperature. Plates were washed, and 100 µL of samples or standard amounts of human TGF-βs were added in duplicates to individual wells and incubated at room temperature for 2 hr. After three washes, 100 µL of biotinylated anti-TGF-βs antibodies diluted in PBS (pH 7.4) containing 0.05% Tween 20 was added for 1 hr. After washing, 100 µL of streptavidin-horseradish peroxidase (HRP) conjugate that had been diluted to 1:20,000 in dilution buffer was added for 1 hr. After a final wash, 200 µL of the HPR substrate tetramethylbenzidine dihydrochloride and hydrogen peroxide in 0.05 M phosphate-citrate buffer (pH 5.0) was added for 30-60 min. The reaction was stopped by adding 50 µL of 1 M sulfuric acid and absorbance at 450 nm was determined in a E max microplate reader (Molecular devices, Sunnycale, CA, U.S.A.). The amount of TGF-βs in sample was determined by comparing absorbance with that produced by standards.
RNA isolation
At the end of the final experimental period total cellular RNA was purified from cultured cells by the RNA-Bee solution (Tel-test, Inc, Friendswood, TX, U.S.A.). The cells were lysed with 1.0 mL RNAzol B solution and extracted by adding 0.1 volume chloroform to tube. After centrifuged at 12,000 g (4℃) for 15 min. The supernatant was transferred to a new 1.5 mL tube and added an equal isopropanol. The samples were precipitated for 15 min at 4℃. After centrifuged, the pellet was washed with 800 µL of 75% ethanol and stored in diethylpyrocarbonate (DEPC) treated water. The total RNAs were measured in 280 nm by the spectrophotometer (Parmacia Bootech, U.K.).
Reverse transcription-polymerase chain reaction (RT-PCR)
First-strand complimentary DNA (cDNA) synthesis was performed using a cDNA synthesis kit (Promega, Madison, WI, U.S.A.) and following the manufacturer's protocol. cDNA synthesis was performed by reverse transcription in a total volume of 20 µL reaction mixture containing 1 µg RNA , 2 µL of 10× reaction buffer (100 mM Tris-HCl, pH 9.0, 500 mM KCl, 1% Triton X-100), 4 µL of 25 mM MgCl2, 2 µL of 10 mM each deoxynucleotide triphophate (dNTP), 0.5 µg random primer, 20 U of RNase inhibitor, 15 U AMV reverse transcriptase. The mixture was incubated at 25℃ for 10 min, 42℃ for 1 hr, then heated to 95℃ for 5 min and chilled on ice.
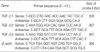
The PCR reaction was performed in a mixture of 50 µL containing 2 µL cDNA, 5 µL of 10×reaction buffer (100 mM Tris-HCl pH 8.3, 500 mM KCl, 15 mM MgCl2), 4 µL of 2.5 mM each dNTP, 20 pmol of each primer (Table 1), 2 U Taq DNA polymerase (Bioneer, Korea). All reactions were carried out in a thermal cycler (Perkin Elmer 9600, Norwalk, CT, U.S.A.) with an initial denaturation step of 95℃ for 4 min. Then 30 cycles proceeded of denaturing at 95℃ for 1 min, annealing at 58℃ (for TGF-β1) and 55℃ (for TGF-β2, TGF-β3, and β-actin) for 1 min, extension at 72℃ for 1 min. The run was terminated at 72℃ for 5 min and the temperature was then reduced to 4℃ for sample storage until further processing. As negative controls, water instead cDNA or the products of the reverse transcription (RT) reactions without reverse transcriptase were subjected to polymerase chain reaction (PCR) and confirmed no false-positive reaction. 10 µL of PCR products were separated by electrophoresis on a 2% agarose gel containing 0.5 µg/mL ethidium bromide and visualized by image analysis (Gel Doc 1000 gel documentation system, Bio-Rad, Hercules, CA, U.S.A.). The size marker was used with DNA molecular weight marker 100 bp ladder (Takara, Japan). The intensities of PCR bands were measured by densitometer (Model GS-700 imaging densitometer, Bio-Rad) and expressed as intensities relative to β-actin.
RESULTS
Expression levels of TGF-β1, -β2 and -β3 protein during differentiation of HaCaT keratinocytes in culture
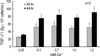
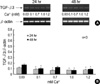
TGF-β1, -β2 and -β3 abundance in conditioned medium collected from HaCaT cells grown under increasing Ca2+ conditions was determined by ELISA. TGF-β1 abundance, following correction for cell number, is expressed as a mean±SD of 2 samples in 2 experiments and compared with that of cells grown at 0.03 mM Ca2+ for 24 hr and 48 hr, respectively. As shown in Fig. 1, a representative ELISA of HaCaT conditioned medium, TGF-β1 abundance were significantly increased at 0.1, 0.7, 1.0 and 1.2 mM Ca2+ condition compared with cells grown at 0.03 mM Ca2+ condition (p<0.05 for each comparison). But, TGF-β2 and TGF-β3 were never detectable.
Expression levels of TGF-β1 mRNA during differentiation of HaCaT keratinocytes in culture
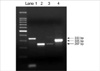
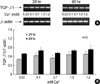
RT-PCR of total RNA extracted from HaCaT keratinocytes exposed to increasing calcium concentrations was performed to determine whether the observed regulation of TGF-β isoforms levels in HaCaT keratinocyte conditioned medium was due to regulation of TGF-β isoforms mRNA levels. TGF-β1, -β2 and -β3 mRNA expression could be detected by RT-PCR in HaCaT keratinocytes (Fig. 2). Fig. 3A is a representative RT-PCR of extracted RNA showing that the predicted TGF-β1 mRNA band was detected in all samples. The combined densitometric analysis of the RT-PCR analyzes is shown graphically in Fig. 3B. Data are represented as the ratio of expression of TGF-β1 to that of β-actin. After exposing to experiemental medium for 24 hr, TGF-β1 mRNA levels were increased at 0.1, 0.7, 1.0 and 1.2 mM Ca2+ condition when compared with expression levels at 0.03 mM Ca2+ condition (p<0.05). However, after exposing to experiemental medium for 48 hr, TGF-β1 mRNA levels were only increased at 0.1, and 1.2 mM Ca2+ condition (p<0.05) and TGF-β1 mRNA levels at 0.7 and 1.0 mM Ca2+ condition did not differ from expression levels at 0.03 mM Ca2+ condition (p>0.05).
Expression levels of TGF-β2 mRNA during differentiation of HaCaT keratinocytes in culture
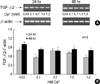
Fig. 4A is a representative RT-PCR of extracted RNA showing that the predicted TGF-β2 mRNA band was detected in all samples. The combined densitometric analysis of the RT-PCR analyzes is shown graphically in Fig. 4B. Data are represented as the ratio of expression of TGF-β2 to that of β-actin. TGF-β2 mRNA levels were decreased at 0.1 and 1.2 mM Ca2+ condition compared with expression levels at 0.03 mM Ca2+ condition after exposing to experimental medium for 24 hr and decreased at 0.7, 1.0 and 1.2 mM Ca2+ condition for 48 hr (p<0.05).
Expression levels of TGF-β3 mRNA during differentiation of HaCaT keratinocytes in culture
Fig. 5A is a representative RT-PCR of extracted RNA showing that the predicted TGF-β3 mRNA band was weakly detected in all samples. The combined densitometric analysis of the RT-PCR analyzes is shown graphically in Fig. 5B. Data are represented as the ratio of expression of TGF-β3 to that of β-actin. TGF-β3 mRNA levels were decreased at all condition compared with expression levels at 0.03 mM Ca2+ condition after exposing to experimental medium for 24 hr and 48 hr (p<0.05), except that TGF-β3 mRNA levels at 0.7 Ca2+ condition did not differ from expression levels at 0.03 mM Ca2+ condition for 48 hr (p>0.05).
DISCUSSION
Transforming growth factors are potent multifunctional autocrine- and paracrine-acting regulators of morphogenesis, angiogenesis, adhesion, chemotaxis, immune response, and extracellular matrix formation (4). Especially, TGF-β isoforms are potent inhibitors of the growth of epithelial cells and thus play an important role in maintaining epidermal homeostasis. The decrease of TGF-β2 has been shown to be associated with excessive proliferation of keratinocytes and an increased risk of psoriasis in normal epidermis, implicating their role in skin proliferation and differentiation (14). The immortalized human keratinocyte cell line (HaCaT) have a generally high competence to realize an epidermal phenotype in a natural environment and appear therefore qualified for in vitro studies on structural and regulatory aspects of keratinocyte physiology and pathology (15). We therefore used this model system to study the role of TGF-β isoforms in differentiation of human keratinocyte.
In the present study, it was shown that TGF-β1 protein and TGF-β1 mRNA were increased during calcium-induced differentiation (0.1, 0.7, 1.0 and 1.2 mM Ca2+ condition) when compared with that of cells grown in medium containing low Ca2+ concentrations (0.03 mM). In contrast, major differences were seen for TGF-β2 and TGF-β3 mRNA. Although TGF-β2 and TGF-β3 mRNA levels were not decreased at all condition compared with expression levels at 0.03 mM Ca2+ condition after exposing to experimental medium for 24 hr and 48 hr, our results showed a tendency to decrease TGF-β2 and TGF-β3 mRNA levels at Ca2+ concentration to above 0.1 mM which keratinocytes can be induced to differentiate when compared with expression levels at 0.03 mM Ca2+ condition. However, TGF-β2 and TGF-β3 were not evident on an ELISA.
These results suggest that differential functions for each TGF-β isoforms in epidermal differentiation, such that TGF-β1 is associated with the more differentiated state, and TGF-β2 and TGF-β3 may be associated the more proliferated state. Numerous previous studies support the differential roles of TGF-β isoforms in epidermal differentiation. TGF-β1 was localized to the upper differentiated layers, the stratum granulosum and corneum, whereas TGF-β2 and, weaker, TGF-β3 immunostaining was present in all suprabasal layers of normal keratinizing epithelia (10). Also, compared with normal skin, TGF-β2 showed a decrease of epidermal staining in psoriatic skin lesion, with the middle and lower epidermis, especially, showing a tendency to decrease TGF-β2. This suggests that the decrease of TGF-β2 in the epidermis of psoriatic skin may contribute epidermis hyperplasia, a hallmark of psoriasis (12). Moreover, the TGF-β1 receptor was expressed with increasing abundance through the upper differentiated layers of the epidermis and not at all in the basal layer (16). Insulin-like growth factor binding protein-3 (IGFBP-3) serve as carrier proteins for insulin-like growth factor-I which is essential for the development of a normal epidermis. The IGFBP-3 expression which was inhibited by TGF-β1 was lacking in upper layers of the epidermis (17, 18). These studies support our results, which suggest that TGF-β1 is associated with the more differentiated state, and TGF-β2 and TGF-β3 may be associated the more proliferated state.
In contrast to our study, it was shown that induction of differentiation by Ca2+ resulted in an increase of TGF-β2 mRNA and peptide but produced a decrease in the expression of TGF-β1 in mouse keratinocytes, suggesting that TGF-β1 has more significant biological roles in regulating growth and differentiation of cells in basal layer than in the upper layer (19). Presumably the differences in the localization of TGF-β isoforms may be related to the different species studied.
In the present study, we questioned whether calcium, a regulator of keratinocyte differentiation (2), may modulate the activity of TGF-β on keratinocyte. Matsumoto et al. (20) reported that the effect of TGF-β on keratinocyte differentiation is Ca2+ dependent. It enhances differentiation of human keratinocytes under high Ca2+ conditions, but inhibits differentiation under low Ca2+ conditions. Kato et al. (21) reported that the growth-inhibitory activity being neutralized by the TGF-β antibody was detected in media conditioned by growing or confluent HaCaT cells, both at physiological or low Ca2+ concentration. However, a considerable part of TGF-β in media conditioned at a physiological Ca2+ concentration was in active form, whereas only latent TGF-β was detected in media conditioned at a low Ca2+ concentration. Thus, the increased growth rate and the blockade of differentiation of keratinocytes at low Ca2+ concentrations may at least in part be due to the loss of autocrine growth inhibitor pathways, i.e. impaired TGF-β activation. However, further studies are required to determine the role of Ca2+ in modulating the activity of TGF-β and the expression of TGF-β in skin during differentiation.
In conclusion, this study showed that TGF-β1 protein and TGF-β1 mRNA were increased during calcium-induced differentiation (0.1, 0.7, 1.0 and 1.2 mM Ca2+ condition) when compared with that of cells grown in medium containing low Ca2+ concentrations (0.03 mM). In contrast, major differences were seen for TGF-β2 and TGF-β3 mRNA which were decreased at Ca2+ concentration to above 0.1 mM which keratinocytes can be induced to differentiate when compared with expression levels at 0.03 mM Ca2+ condition. So, the observed variation in expression of TGF-β isoforms levels probably reflects different roles of the specific isoforms in epidermal differentiation. Based on these and other published studies, we hypothesize that TGF-β1 is associated with the more differentiated state, and TGF-β2 and TGF-β3 may be associated the more proliferated state. In addition, calcium may regulate the activity of keratinocyte-derived TGF-β in the epidermis and suggest a potential mechanism for the distribution of TGF-β in the epidermis, which may be involved in the process of keratinocyte differentiation.
 XML Download