

 PDF
PDF ePub
ePub Citation
 Print
Print


INTRODUCTION
Eukaryotic genomes contain variable amounts of retroelements, which propagate within host genome using RNA intermediates (1). Approximately half of the human genome is composed of five major retroelement families that are classified into three groups, termed as the long interspersed nuclear element (LINE; L1 and L2), short interspersed nuclear element (SINE; Alu and MIR), and long terminal repeat (LTR) (2). The extreme abundance of retroelements in the modern human genome reflects the possibility of the explosive outbreaks that resulted in the massive propagation and fixation of the highly repetitive retroelement copies. When neutral or at least tolerable retroelements do not come up with certain threshold copy numbers, most of them are eliminated from a breeding population through random drift (3). A massive number of new retroelement copies is fixed within a population shortly after amplification (4), and the ancient retroelement's activity can be traced based on the wave of neutral mutations increased with time (1). The genome-wide analysis of Alu sequence divergence demonstrates a sharp amplification peak occurring 40 million years ago (MYRA), which corresponds to the expansion of the primate lineage (2, 5). This finding strongly supports the view that the explosive expansion of retroelements increased the genomic diversity responsible for the speciation events of host (6-8).
In spite of phylogenetic significances of individual retroelement families, the evidence of explosive expansions for retroelement other than Alus is considerably limited due to ambiguous peak activities. An approximate timescale for the entire retroelement formation roughly revealed the continued flourishing of autonomous L1s and LTRs for 150 million years (2). Since self-preserving retroelements cause harmful effects on the host genome by direct insertional mutagenesis or by altering genomic stability (9), the intragenomic propagation of retroelements has been selectively restrained depending on their effects on the host. Therefore, the pattern of retroelement amplification has been obscured in the modern genome, which makes it difficult to retrace when and how retroelement peak activities have appeared and influenced the evolution of the host genome.
Wide variations in the retroelement density across chromosomes have been observed previously (10, 11). Among all human chromosomes, chromosome 19, X, and Y contain Alu, L1, and LTR elements in the highest density, respectively. Because Alu elements have been supposed to promote protein expression and selectively accumulated nearby genes (12), it is reasonable to assume that the gene-rich chromosome 19 preferentially favored Alu insertion. The overwhelming frequency of LTRs in chromosome Y can be explained by the suppression of recombination between the heteromorphic sex chromosomes, which would otherwise remove potentially harmful genetic elements selectively (13, 14). Overrepresented L1s on chromosome X have been suggested to function as waystations for the spreading of heterochromatization; thus, playing a role in the inactivation of chromosome X (15). Basically, the variable composition of retroelements in human chromosomes may be a testament to the exapted role of self-preserving retroelements for the symbiotic advantage of both the host genome and the parasitic retroelement (16). Given that the initial integration of retroelements occur randomly (17, 18), each chromosome is believed to have formulated a unique composition of retroelements through the process of post-insertion selection. Therefore, propagation of retroelements is expected to leave expansion curves similar in the time of amplification and variable in the height of peaks across chromosomes.
We assumed that the comparative analysis of retroelement substitutions on individual chromosomes, including sex chromosomes, would unveil the most prominent expansion curves, which most likely represent the period of peak activity associated with explosive amplification. In this study, LINEs, SINEs, and LTRs on each chromosome were partitioned according to sequence divergence to trace time-scaled retroelement activities. Overall, the most prominent expansion curves revealed five reciprocal peaks of autonomous LINE and non-autonomous SINE amplification in a timescale of 150 million years. The time of an exceptional LTR burst was calibrated comparably with the Cretaceous-Tertiary (K-T) boundary between the Mesozoic and Cenozoic periods approximately 65 MYRA (19). In particular, the periodic peak activities of retroelements correspond temporally with speciation events in the hominoid primate lineage, suggesting the programming of genome dynamics by retroelements for the hominoid evolution.
MATERIALS AND METHODS
Data sources of human retroelements
The retroelement data for all figures and tables were retrieved from the December 2001 draft human genome assembly at http://genome.ucsc.edu. The genomic locations and annotations of retroelements were derived from the Repeat-Masker program output (http://ftp.genome.washington.edu/RM/RepeatMasker.html) based on RepBase (20). The sequence divergence of retroelements was directly taken from RepeatMasker results based on the algorithm of Waterman and Smith (21) in sensitive setting. For Table 1, the retroelements were further categorized into major subfamilies according to the similarities with the consensus sequences and the chromosomal fraction of each subfamily was calculated by dividing the total retroelement size by gap-excluded chromosomal size. To analyze the time-coursed pattern of retroelement expansion using sequence divergence, the chromosomal fraction was plotted at each bin of divergence level in 1% scale. The expansion curves of retroelements on individual chromosomes were compared for the highest peak made among chromosomes. For chromosome X, its long arm (Xq) was separately analyzed from the short arm (Xp), because Xq and Xp are composed of different anciently conserved regions (XCR) and recently added regions from autosomes (XAR), respectivley (22). The cytogenetic bands of sex chromosomes were redrawn according to bands information of the same genomic version (Dec. 2001) with the analysis of retroelements.
Age estimation using sequence divergence
Since sequence divergence from the master copy consensus is proportional to the integration age, the divergence range of retroelements from 1% to 38% was converted into the timescale of 150 million years. The estimated ages, using the level of sequence divergence, were compared with the timescale drawn previously using the approximate molecular clock (2). Since a high mutation rate of CpG transition leads to an overestimated age for Alus containing high CpG contents (23), we used the Alu-specific age estimated from previous literature (2). The age of LTRs on chromosome Y was recalibrated using the relative divergence ratio of 1.57 to compensate for the rapid divergence rate of chromosome Y (2, 24).
RESULTS
Composition of retroelements in the human chromosomes
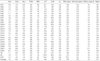
The five families of retroelements in the human genome were collectively retrieved from the public database. The composition of retroelement subfamilies in each chromosome is listed in Table 1. For chromosome X, we separately analyzed the long (Xq) and short (Xp) arms, each of which derived from different origins (22). Chromosome 19 contains Alus in the highest density, comprising 27.2% of chromosome. The major subfamilies, Alu J (3.26%), Alu S (17.2%), Alu Y (5.9%), and free Alu monomers (0.85%) are also most frequent on chromosome 19. The density of Alu distribution is lowest on chromosome 4 (7.1%) and Xq (6.9%). Two major L1 subfamilies, L1P (primate, 16.9%) and L1M (mammal, 16.3%), commonly occupy chromosome Xq in the highest density. On chromosome Y, class I endogenous retrovirus (ERV) elements are overrepresented at 12% - four times the genomic average (2.9%) - while class III ERVs (1.3%) and non-autonomous mammalian apparent LTR retroposons (MaLR, 2.8%) are slightly underrepresented compared to the autosomal averages of 1.5% and 3.7%, respectively. Two ancient retroelements, L2s and MIRs, have considerably low average densities, comprising 3% and 2.5% of each chromosome.
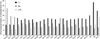
The comparison of L1, Alu and LTR contents in each chromosome is shown in Fig. 1. The gene-rich chromosome 19, 17 and 22 harbor non-autonomous Alus in the highest density, whereas the sex chromsomose Xq and Y reveal autonomous L1s and LTRs in the highest density. In autosomes, Alus are variably distributed according to gene density, and L1s and LTRs are rather uniformly distributed.
Substitution-scaled distribution pattern of retroelements on individual chromosomes
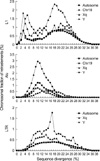
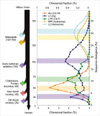
The chromosomal fractions of five retroelement families were plotted according to the degree of sequence divergence for the analysis of time-scaled accumulation (Fig. 2, 3). L1s in the highest density on chromosome Xq make the most prominent expansion curve with two amplification peaks at the sequence divergences of 3% and 18% (Fig. 2). The dominant amplification peak at 18% is unique on chromosome Xq, and the height is three times higher than that of the average amplification peak on autosomes. The over-accumulation of L1s on Xq continues throughout the lifetime of L1s, encompassing the divergence range from 1% to 30%. Chromosome Y contains an L1 amplification peak at 5% divergence, which is as prominent as that on chromosome Xq, but has no L1 peak at 18% divergence.
A single amplification peak of Alus at 10% sequence divergence is most prominent on gene-rich chromosome 19, and this over-dominance is sustained in the range of sequence divergence from 4% to 21% (Fig. 2). Other autosomes and chromosome Xq have the reduced peaks of Alu amplification in the divergence range similar with chromosome 19. Alus on chromosome Y display a widened expansion curve shifted toward the higher divergence.
LTRs in the highest density on chromosome Y make a single amplification peak at 17% divergence, which is four times the height of the autosomal average amplification (Fig. 2). The LTR peak abruptly appears in the middle of the wave showing a rapid rise and slow fall with increased divergence. The over-representation of LTRs on chromosome Y is maintained from 7% to 27% divergence. The amplification curve of LTRs on chromosome X is more prominent than the autosomal amplification at less than 20% divergence.
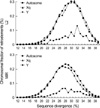
Autosomes and chromosome X show similar L2 and MIR amplification rate and chromosomal fraction (Table 1), and make the amplification peaks at the divergence rates of 31% and 28%, respectively (Fig. 3). The expansion curves of L2s and MIRs similarly initiate at 38% divergence rate and terminate at 20% divergence rate, before the thriving of the young LINE (L1) and SINE (Alu) families. The peak heights of L2 and MIR amplifications, especially an immaterial peak on chromosome Y, are considerably low compared with those of L1 and Alu amplifications.
Overall, three peak activities of LINEs (young L1s, old L1s, and L2s) and two peak activities of SINEs (Alus and MIRs) make the seesaw-like transition of amplifications indicating the reciprocal relationship between autonomous LINEs and non-autonomous SINEs. Retroelements on autosomes and chromosome X tend to peak synchronously at similar divergence levels while varying in extent of fixation. The amplification peaks of retroelements on chromosome Y tend to be skewed toward higher sequence divergence as compared with those on other chromosomes.
Regional distribution pattern of retroelements on sex chromosomes
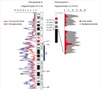
We analyzed the regional distribution of L1 and LTR on sex chromosomes X and Y, respectively (Fig. 4). The distribution of L1s comprising amplification peaks at 3-5% (young copies) and 15-17% (old copies) sequence divergence was separately mapped on chromosome X. We found prominent and extensive accumulation of old L1 copies in the cytogenetic bands of Xq13-Xq21, which contain XIC (X chromosome inactivation center) - known as the main regulatory center of chromosome X inactivation (25). Other spots of old L1 accumulation are associated with dark G-bands and sporadically dispersed along chromosome Xq. The short arm of chromosome X shows a single old L1 cluster at Xp21 while generally suppressed of L1 accumulation. The young L1 copies reveal a relatively random distribution compared to old L1 copies over chromosome X except for XIC.
LTRs on chromosome Y were categorized into the peak (15-17% divergence) and background activities (Fig. 4). LTRs categorized into a peak activity group are specifically concentrated in the middle of the euchromatic portion of the long arm, whereas LTRs at the background activity are uniformly distributed along chromosome Y.
Relationship between retroelement peaking and hominoid primate evolution
The most prominent expansion curves of five retroelement families were collectively plotted in the evolutionary timetable of the primate lineage (Fig. 5). Chromosome 19, X and Y were chosen to represent the peak curves of Alu, L1 and LTR amplification, respectively. All L2s and MIRs in autosomes were analyzed for an unbiased estimate of the peak age, because the number of these old copies on a single chromosome was not enough to represent a normal distribution. Overall, the expansion curves of the five retroelement families display peak activity a total of six times, including two peaks of L1s, each of which is obviously distinguished from the dormant or less active periods of other retroelements. Although the expansion curves of L2s and MIRs are small, a time interval exists between a pair of LINE and SINE activities.
The amplification peaks of ancient L2s and MIRs roughly coincide with the marsupial-placental split about 120-150 MYRA (26). The peak activity of old L1s was found to chronologically correspond to the early eutherian radiation around 100 MYRA (27). An exceptional burst of LTRs on chromosome Y was calibrated at 70 MYRA, closely corresponding to the K-T boundary where extraterritorial impacts were thought to have been accompanied by ecological maelstroms at 65 MYRA (19). The amplification peaks of Alus and young L1s, both of which are restricted to the primate lineages, coincide with the expansions of the New World monkey and Old World monkey at 40 and 25 MYRA, respectively (28).
DISCUSSION
The evolutionary history of human retroelements has been described as successive amplification of subfamilies during the steady rise and fall of retroelement families (29). Previous genome-wide analysis of LTR and L1 substitutions revealed slow expansion curves with no prominent peaks over the long evolutionary period (2). In this comparative analysis of retroelement divergence on individual chromosomes describes retroelement activity synchronized in an entire chromosomal set. Given that potentially harmful autonomous retroelements have been selectively deleted through recombination processes (14), the synchronous amplification peaks of retroelements in variable densities across chromosomes could be a consequence of post-insertion selection for evolutionary advantage. Recombination-suppressed chromosome Y appears to retain the expansion pattern of LTRs with the least selection. Chromosome X, which requires a high density of L1s to mediate heterochromatization for dosage compensation in response to the small-sized chromosome Y, is thought to have conserved the native expansion pattern of L1s with the least elimination. Therefore, retroelements in individual chromosomes might have amplified concurrently while being fixed differently, suggesting that chromosomal retroelement dynamics is similar in when they thrive and dissimilar in expansion magnitude. The retroelement peak acitivity supports the so-called massive bombardment of retroelements that facilitates the divergence of the host genome (6, 8).
In a breeding population, multicopy retroelements propagate depending on the amplification rates that increase the probability of fixation within a population. Only a significantly large number of newly amplified copies can counter random drift and breed throughout the population. Theoretically, 2N or more insertions are required to allow one insertion to get fixed in a breeding population of N individuals (30). Thus, extremely large numbers of Alus and L1s appeared to have amplified explosively at the time of peak activity that created an excessive number of copies over a population. The expansion curves of the old retroelements such as MIRs and L2s are less prominent as compared with their young counterparts, Alus and L1s and it must be taken into account that some old elements are too diverged to be recognized. However, considering that the normal distribution of neutral substitutions is considerably dispersed around a peak fraction with time, such small amplification peaks are likely to reflect the peak activity of retroelements for the corresponding genome.
Studies have suggested a competitive relationship between autonomous L1 and non-autonomous Alu elements based on the parasitic behavior of Alus that exploit the protein machinery of L1s for retrotransposition (31, 32). This study on the evolutionary wave of retroelements demonstrates that the different retroelement families have never explosively expanded at the same period; thereby coping with the competitive conflicts between selfish DNAs. In addition, it is likely that evolutionary events, such as speciation facilitated by retroelement peaks, provided new niches for the amplification of the other silenced retroelements. Consequently, LINEs and SINEs appeared to reciprocally promote the amplification of each other through repeated reshaping of the host genome.
The dormant periods of retroelements between amplification peaks is noted in terms of the accommodation through the presumptive functionality on host fitness (33) or the stability of retroelements themselves (17). It is believed that the initial integration of L1s and Alus are random while they become differentially redistributed with time (3). It is possible that selfish autonomous L1s are more enriched in the gene-poor regions for lesser detrimental influence, whereas Alus promoting gene expression are more concentrated in the gene-rich region through degeneration of useless contents in the gene-poor region (34). Alternately, the host genome positively selects Alu insertion in the gene-rich regions for adaptive advantage due to its role in promoting protein expression (12). This reciprocal redistribution of LINEs and SINEs in a dormant period would reorganize the explosive insertions for the beneficial and stable relationship between host and retroelement, even for symbiotic co-evolution. Therefore, LINEs and SINEs are likely to have expanded in the host genome as temporally and spatially reciprocal partners.
LTRs were found to have over-accumulated on chromosome Y throughout the period of active amplification. This unique overrepresentation of LTRs can be explained by the lack of recombination in chromosome Y, because other recombination-competent chromosomes are able to eliminate potentially harmful LTRs (14). In fact, we found no LTR peaks on chromosomes other than chromosome Y. The large fraction of amplified LTR copies seems to have been removed through selective recombination due to its adverse influence on the host genome. According to Muller's ratchet and hitchhiking theory for the degeneration of chromosome Y, the non-recombining region is unable to remove the stochastic insertion of retroelements, while tolerating mutational deletion (35, 36). In support of Muller's theory, the evolutionary waves of L1s and LTRs on chromosome Y reveal a skewed expansion curve with a high density of young copies and a low density of old copies. These findings suggest that the rapid gain and loss of genetic contents, rather than recombination, is a main dynamic underlying the unique retroelement composition of chromosome Y.
Of the two amplification peaks made by L1s, the older one was found to largely constitute multiple L1 hot spots in the long arm of chromosome X. A single hot spot of old L1 copies in the short arm of chromosome X coincides with the ancestral conserved region (XCR) on chromosome Xp described in a previous report (37). The most extensive hot spot is located in the proximal part of chromosome Xq that contains XIC. The high density of L1s in XIC was previously suggested to promote the spread of the X inactivation signal by XIST (X inactive-specific transcript) RNA in support of the Lyon repeat hypothesis (38). Alternately, because the two sex chromosomes have evolved differently in terms of predominant retroelement content, the decreased sequence homology in highly repetitive copies takes advantage for minimizing the undesirable recombination between sex chromosomes (39). The recombination suppression caused by the inversion of chromosome Y (40) is likely to have been further solidified due to different repeated sequences.
A single LTR burst is noted in association with the ancient outbreaks of retroviruses accompanied by the concurrent activation of endogenous retroelements. Exogenous retroviral infection is thought to have activated in trans endogenous retroviruses, which are defected in infectivity due to lack of appropriate viral components (41). The massive horizontal transmission of active exogenous retroviruses was most likely to be critically detrimental for host individuals and populations. The estimated age of an endogenous LTR peak at the K-T boundary implies a sudden change in the global environment, which facilitated evolution and conferred a niche for the LTR expansion in the primate ancestral genome. The Earth's ecosystem and climate are believed to have been severely disturbed at the K-T boundary at 65 MYRA (42, 43). These changes are likely to have modified habitats and genomic DNA through large quantities of dust and radioactive gas, consequently promoting the speciation of mammals. Therefore, a LTR amplification peak is possible in association with such a special global event, but not an accidental event.
The global changes at the K-T boundary of 65 MYRA are believed to have had important consequences for diversification of terrestrial organisms. Some investigators have used a placental mammalian evolution in a molecular clock to suggest the inter- and intra-ordinal divergence of placental mammals before and after the K-T boundary, respectively (27). In this respect, the human LTR explosion at 70 MYRA is timely compatible with the emergence of prosimians at the K-T boundary. The peak of old L1 copies appearing before the LTR peak is correlated with the inter-ordinal divergence of early placental mammals about 100 MYRA (44). The ancient L2s and MIRs appeared to expand explosively during the inter-ordinal divergence of marsupial and eutherian lineages about 120-150 MYRA. The peaks of Alus (40 MYRA) and young L1s (25 MYRA) following LTR peaking could be responsible for the active intra-ordinal diversification of the Old World monkey and New World money, respectively, in the hominoid lineage. The LTR explosion independent of LINE/SINE expansion is thought to have converted the evolutionary impact of reciprocal LINE/SINE expansion from inter- to intra-ordinal eutherian divergence.
In conclusion, this comparative analysis of retroelement divergence among individual chromosomes sheds light on the genome dynamics driven by the peak activity of two monophyletic selfish DNAs, SINEs and LINEs. The ebb-and-flow-like expansion curves of LINEs and SINEs suggest that the human genome has evolved through repeated SINE/LINE amplification and exaptation for 150 million years. An exceptional expansion peak of LTRs associated with the K-T boundary is considered a pivotal event in the inter- and intraordinal transition of eutherian diversification that reshuffled the programmed genome dynamics.
 XML Download