

 PDF
PDF ePub
ePub Citation
 Print
Print


Introduction
Intravenous immunoglobulin (IVIG) plus aspirin therapy is an effective treatment for acute Kawasaki disease (KD).1) However, 10% to 20% of children with KD do not respond to IVIG treatment.2) Incomplete KD is recognized with increasing frequency. The prevalence of incomplete KD has been reported to be 15% to 36.2%.3)4)5)6)7)
Approximately 15% to 25% of untreated KD children have complications such as coronary aneurysm and coronary artery ectasia that may develop into ischemic heart disease, leading to possible sudden death.1) Early diagnosis and treatment with IVIG can reduce the risk of coronary artery abnormalities to under 5%.8)9)10) Hence, the importance of early aggressive management of IVIG-resistant KD must be emphasized, together with early identification of likely IVIG-resistant KD who may require additional therapy such as a second dose of IVIG, steroids, or infliximab.1)
Many studies have addressed the early identification of IVIG-resistant KD.11)12)13)14)15) However, there is no consensus on factor that could be used to predict KD patients with IVIG resistance. Therefore, the objective of this study was to find predictors of resistance to initial IVIG in KD patients by comparing clinical pattern, echocardiography data, and laboratory data before and after initial IVIG treatment. Previous studies have analyzed laboratory values before and after IVIG treatment,16)17) we sought to find if fractional change (FC) of significant parameters could be quantified to predict resistance to IVIG treatment.
Subjects and Methods
Subjects
We retrospectively reviewed and analyzed medical records, echocardiography data, and laboratory parameters of children diagnosed with KD at Myong Ji Hospital from March 2012 to April 2014. A total of 91 subjects were enrolled, including 47 males and 44 females ranging from 2 month to 8 years of age. Enrolled patients included both complete (n=73) and incomplete KD (n=18). KD was diagnosed according to the criteria published by American Heart Association (AHA) in 2004.1) Diagnosis of incomplete KD was based on diagnostic criteria established by the AHA: children ≥6 months of age with incomplete presentation have unexplained fever for ≥5 days associated with 2 or 3 of the principal clinical features in the acute phase. We followed the AHA recommended diagnostic algorithm for incomplete KD which included the flowing supplemental laboratory and echocardiographic criteria: albumin ≤3.0 g/dL, anemia for age, elevation of alanine aminotransferase (ALT), platelets after 7 days ≥450000/mm3, white blood cell (WBC) count ≥15000/mm3, and urine ≥10 WBCs/high-power field. More than three laboratory criteria would support the diagnosis of incomplete KD.1) Echocardiograms were considered diagnostically positive if any of the following three conditions were met: z score of the left anterior descending or right coronary arteries ≥2.5, coronary arteries meet the Japanese Ministry of Health criteria for aneurysms,18) more than three of six suggestive features exist, including perivascular brightness, lack of tapering, decreased left ventricular function, mitral regurgitation, pericardial effusion, or z scores in left anterior descending artery (LAD) or right coronary artery (RCA) of 2-2.5.1) Subjects were then divided into two groups: IVIG-responsive patients (n=80) and IVIG-resistant patients (n=11). Those who showed improved fever and other symptoms after the administration of IVIG were classified as IVIGresponsive. If fever was over 36 hours or recrudescent (temperature ≥38.0℃ axillary or rectally), patients were classified as IVIG-resistant.1)
Upon diagnosis, all patients were treated with IVIG 2 g/kg and aspirin 50 mg/kg until defervescence, followed by aspirin at 5 mg/kg/day as a single daily dose thereafter. Of the 11 IVIG-resistant patients, 10 defervesced after receiving a second dose of IVIG 2 g/kg, whereas one patient was persistently febrile despite a second dose IVIG treatment. The patient eventually defervesced after receiving pulsed methylprednisolone at 30 mg/kg/day for three days.
Laboratory data obtained before and 24 to 36 hours after IVIG treatment were collected. Some timing error of sample collection may exist due to the nature of this study being retrospective without controls. Laboratory parameters before IVIG included hemoglobin (Hb) level, WBC count, proportions of neutrophil, lymphocyte and eosinophil, platelet count, erythrocyte sedimentation rate (ESR), C-reactive protein (CRP), aspartate aminotransferase (AST), ALT, sodium, potassium, total protein, albumin, total bilirubin, creatine kinase (CK), CK-MB, and N-terminal pro-brain natriuretic peptide (NT-proBNP). Laboratory parameters after IVIG treatment included all of the above except sodium, potassium, total protein, albumin, and total bilirubin. Laboratory values before and after IVIG therapy were compared in each group. Variables that showed a significant difference after IVIG therapy were selected. Variables before- and after-IVIG were compared between groups. The mean difference and FC of each variable between the groups were also compared. The mean difference and FC was defined as follows: mean difference=Y-X , FC=(Y-X)/X, where X represented data before IVIG treatment and Y represented data 24 to 36 hours after IVIG treatment.
Echocardiography was used to measure coronary artery size at diagnosis. For patients that did not respond to IVIG treatment, echocardiography was repeated before treatment with a second dose of IVIG. All patients underwent echocardiography within two weeks of fever onset and approximately 6-8 weeks later. Echocardiography was done by a single examiner.
Statistical analysis
Groups were compared through Mann-Whitney U-test and Fisher's exact test using Statistical Package for the Social Sciences (SPSS) ver. 12.0 (SPSS Inc., Chicago, IL, USA). Data were presented as either mean±SD for continuous variables or as the number (%) of patients for categorical variables. We determined significant parameters by univariate analysis and multivariable logistic regression analysis. Receiver operating characteristic (ROC) curves were used to determine the cutoff value of each parameter found to be significant by FC. Multivariate logistic regression analysis was used to find more important values for early predictor of likely IVIG-resistant KD. Results were expressed as odds ratio (OR) with 95% confidence interval (CI). A 95% CI that did not include 1.0 was interpreted as statistically significant. In all analyses, statistical significance of difference was accepted if p was less than 0.05.
Results
Comparison of clinical characteristics between groups
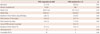
Of the total 91 patients, 80 (88%) completely responded to a single IVIG therapy, 11 (12%) required re-treatment. Between IVIG-resistant and IVIG-responsive patient groups, age, gender, height, or weight did not differ statistically. The incidence of incomplete KD or the duration of fever before echocardiography in the two groups was not statistically different. However, the IVIG-resistant patient group had a significantly (p=0.009) shorter duration of fever at initial IVIG treatment than the IVIG-responsive patient group (5.0±0.7 vs. 5.8±1.3). The total duration of fever and hospital day were significantly longer in the IVIG-resistant patient group (Table 1).
There were 18 patients (22%) who were diagnosed with incomplete KD, including 15 (18.7%) in the IVIG-responsive group and 3 (27%) in the IVIG-resistant group. Between the complete and the incomplete KD patient groups, there was no significant difference in the number of IVIG treatment. In the acute phase, incidence of coronary dilatation in the incomplete KD patient group was 61%, which was significantly (p=0.00) higher than that in the complete KD patient group (61% vs. 19%). In the convalescent phase, there was no significant difference in coronary dilatation (6.8% vs. 16%, p=0.14).
Coronary artery lesions between intravenous immunoglobulin-responsive and intravenous immunoglobulin-resistant patients
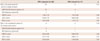
The incidence of coronary artery lesions (CALs) or z-score in the acute phase did not differ statistically between the IVIG-responsive and IVIG-resistant groups. However, in the convalescent phase, left main coronary artery, LAD, RCA all had higher z-scores. The RCA z-score in the IVIG-resistant group was significantly (p=0.03) higher than that in the IVIG-responsive group (1.00±0.85 vs. 0.36±0.84) (Table 2).
Before- and after-intravenous immunoglobulin laboratory parameters between groups
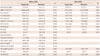
Before-IVIG, the IVIG-resistant patient group had higher levels of WBC, % neutrophil, ESR, CRP, and NT-proBNP, but lower levels of sodium, CK, and CK-MB compared to the IVIG-responsive patient group. After IVIG, levels of WBC, % neutrophil, CRP, and NT-pro-BNP remained higher in the IVIG-resistant patient group. However, the levels of Hb, % lymphocytes, CK, and CK-MB were lower those in the IVIG-responsive patient group. There was no statistical difference in % eosinophil, platelet count, AST, or ALT between the IVIG-resistant and IVIG-responsible patient groups in the before- and after-IVIG parameters.
When laboratory parameters were compared before- and after-IVIG, the followings were found to be statistically significant: WBC count (p before 0.013: p after 0.007), % neutrophil (0.033:0.002), CRP (0.0013:0.0000), CK (0.025:0.001), CK-MB (0.042:0.000), and NT-proBNP (0.001:0.002). In the IVIG responsive patient group, WBC % neutrophil, CRP, CK, and NT-proBNP were decreased after IVIG compared to those values before IVIG. In the IVIG-resistant patient group, WBC % neutrophil, CRP, CK, and CK-MB were decreased after IVIG copared to those values before IVIG. The mean value of CRP in the IVIG-resistant patient group (before:after=12.7±8.1:12.0±7.6) decreased less compared to that in the IVIG-responsive patient group (before:after=5.2±4.2:2.6±2.7). The mean value of NT-proBNP in the IVIG-resistant patient group (before:after=523±397:1750±1187) was increased after IVIG. However, the mean value of NT-proBNP in the IVIG-responsive patient group was decreased (before:after=594±1166:523±397) after IVIG. Accordingly, we sought to determine if the mean difference and FC could be quantified to predict responsiveness to IVIG treatment. Previously reported risk factors such as platelet count, AST, and ALT were not significantly different between the IVIG-responsive and IVIG-resistant groups in this study (Table 3).
Mean difference and fractional change of laboratory parameters
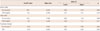
We selected the following variables that showed significant difference between the IVIG-resistant and IVIG-responsive groups after comparing the before- and after-IVIG parameters: WBC, % neutrophil, CRP, CK, CK-MB, and NT-proBNP. Before- and after-IVIG levels of the variables were compared between the two groups (IVIG-resistant and IVIG-responsive) for mean difference and FC. There was no statistical difference between the two groups in the mean difference of WBC count, % neutrophil, CRP, CK, CK-MB, or NT-proBNP. However, the FC of % neutrophil and CRP showed statistically significant difference between the two groups (Table 4). Therefore, these two variables may be suitable parameters to use as a predictor of responsiveness to initial IVIG in KD patients.
Cutoff values of parameters by receiver operating characteristic curve
For each parameter, the cutoff values were determined by ROC curve. When the cut off value of % neutrophil to identify IVIG-resistant patient was set at 59.1% for before-IVIG and 45.3% for after-IVIG, the area under the ROC curve was 0.702 and 0.785 (95% CI, 0.23 to 2.75 and 0.03 to 1.16), respectively, with sensitivity/specificity of 90%/50% and 72%/70%. When the cut off value of CRP was set at 8.3 before-IVIG and 3.8 after-IVIG, the area under the ROC curve was 0.735 and 0.860 (95% CI, 0.77 to 1.91 and 0.29 to 1.51), respectively, with sensitivity/specificity of 63%/78% and 81%/75%. When the cut off value of FC-CRP was set at -0.313, the area under the ROC curve was 0.787 (95% CI, 0.01 to 0.39), with sensitivity/specificity of 72%/85%. When the cut off value of FC-% neutrophil was set at -0.436, the area under the ROC curve was 0.713 (95% CI, 0.07 to 0.78), with sensitivity/specificity of 90%/55%.
Independent predictors of responsiveness to initial intravenous immunoglobulin
Based on multivariable logistic regression analysis, only FC-CRP (p=0.02) was identified as independent predictor of responsiveness to initial IVIG in KD patients (Table 5). Patients with FC-CRP ≥-0.31 were resistant to initial IVIG treatment, with a sensitivity of 72% and a specificity of 85%, suggesting that the group responsive to initial treatment was subject to a 31% decrease after-IVIG CRP compared to before- IVIG CRP. The FC-% neutrophil was not an independent parameter. The ORs for FC-CRP and FC-% neutrophil were 0.063 and 0.072, respectively.
Discussion
Enrolled patients in this study included both complete and incomplete KD. The percentage of patients with incomplete form of KD was 22%, which was in consistent with another previous study.19) It has been reported that it is impossible to standardize incomplete KD diagnostic criteria across all centers.20) Therefore, clinicians' judgment and local policies may have played a significant role in those cases with few classical diagnostic criteria. Currently, diagnosis of incomplete KD is made in cases with fewer classical diagnostic criteria and several compatible clinical, laboratory, or echocardiographic findings, excluding other febrile illnesses. More widespread use of diagnostic KD guidelines resulting in more frequent and early echocardiogram may have contributed to the increase of incomplete KD. A survey reflecting the current practice of diagnosing incomplete KD has been published.20) Thus, incomplete KD patients were enrolled in this study.
Previously, incomplete KD was shown to be associated with delayed diagnosis and treatment.3)21)22) Delayed treatment for KD was also reported to be a risk factor for the development of CALs.23) However, in our study, CALs in incomplete KD were only significantly higher in the acute phase. In the convalescent phase, CALs in incomplete KD did not differ statistically from that in complete KD. Although no conclusions can be made, early treatment of incomplete KD might have played a role in the non-differentiation of coronary dilatation in the convalescent phase, because there was no significant difference in fever duration before initial IVIG treatment compared to that in complete KD patients. Currently, there is no possible way to differentiate and exclude all entities to make a firm diagnosis of incomplete KD. This might have attributed to favorable outcomes in early treated patients. Further prospective studies on the timing of IVIG treatment in incomplete KD and its short and long term effects on coronary complications are needed. Additionally, incomplete KD patients without CALs are more likely to be missed. This selection bias may partially reflect the higher incidence of CALs in incomplete KD patients.
Incomplete presentation of KD in children has been reported to be associated with higher risk,3)4)6)20) similar risk,7) or lower risk24) of coronary artery abnormalities compared to children with complete presentation. The prevalence of coronary artery abnormalities was 13.1% in cases with incomplete presentation.20) In our study, the prevalence CALs was 16.1% in the convalescent phase. Compared to IVIG responders, non-responders are known to have longer total duration of fever and a higher incidence of CALs.17) Our study also showed that the IVIG-resistant group had significant longer total duration of fever and higher z-score of RCA in the convalescent phase.
When KD patients fail to respond to initial IVIG treatment with persistent fever, it can be a predicament for the treating physician. They must be re-evaluated to exclude the possibility of infection. At the same time, a decision has to be made to either proceed with a second IVIG treatment or other alternative treatments for KD. Much research is being actively conducted to reduce the duration of fever and CALs through early detection and treatment of non-responders to IVIG, which accounts for 10 to 20% of KD patients. Until now, there is no consensus on risk factors for KD. Many studies on risk factors were reported for Japanese patients. Kobayashi et al.,11) Sano et al.,12) Egami et al.,13) etc., have proposed a scoring system to predict IVIG resistance in patients using various parameters. In other studies, Ashouri et al.14) reported risk predictors such as high % band counts, low albumin, and the presence of CALs. Tremoulet et al.15) suggested high % band counts, long illness days, high gammaglutamyl transferase, and low ageadjusted Hb as risk predictors of IVIG resistance. Low serum albumin level and high % neutrophil were reported to be independent predictors of IVIG resistance in Chinese children with KD.25) In Korea, Do et al.26) reported that low albumin, low sodium, and high neutrophil proportion were significant different in the IVIG resistant group compared to the IVIG-responsive group. Kim et al.16) reported that WBC count, % neutrophil, CRP, and NT-proBNP were significant in the IVIG-resistant group. Mori et al.27) further demonstrated that increased WBC, neutrophil count, and CRP after IVIG treatment were markers for treatment efficacy and useful predictors of coronary artery dilatation. Most previous studies used data acquired before IVIG treatment. Other studies16)17) have included both before and after IVIG laboratory data. Hwang et al.17) reported that total leucocyte count and CRP levels increased in the IVIG non-responders by 24% and 2% respectively, but decreased by 27% and 34% in the IVIG responders.
N-terminal pro-brain natriuretic peptide, a widely used biomarker of cardiovascular disease, is a cardiac hormone secreted by the ventricles in response to sheer stress from the overload of body fluid and pressure. NT-proBNP is involved in diuresis, natriuresis, arterial and venous dilatation, and regulation of myocardial proliferation and hypertrophic response.28) NT-proBNP is a very important biomarker for the diagnosis, treatment, and prognosis of heart failure in adults. It is a predictor of cardiac functions in patients after cardiac infarction.25)29) In pediatric patients, NT-proBNP is a significant biomarker for heart failure, congenital heart disease with lefttoright shunt, right heart disease, cyanotic heart disease, secondary right heart disease induced by pulmonary hypertension and pulmonary regurgitation, and allograft disease after heart transplantation.30) Unlike other febrile illnesses, NT-proBNP increases at the acute stage of KD but decreases at the convalescent stage. Therefore, NT-proBNP is useful for diagnosis.29) However, in our study, NT-was found to be not significantly different between the IVIG-responsive and IVIG-resistant groups by multivariate analysis. However, NT-proBNP was significantly different by univariate analysis. Therefore, NT-proBNP may be considered clinically relevant, but with limitation when used as a predictor. Young et al.25) reported that NT-proBNP was paradoxically elevated in nearly half of IVIG-resistant patients, suggesting that NT-proBNP may be a useful marker of ongoing inflammation after IVIG treatment. Thus, they placed an emphasis on the clinical significance of NT-proBNP as a marker for retreatment. The NT-proBNP cutoff value of 479 pg/mL indicated as a marker for retreatment was higher than the 260 pg/mL or the 170 pg/mL proposed as diagnostic tests for acute KD reported previously.29) In our study, the cut off value of NT-proBNP was 407 pg/mL (before-IVIG) and 793 pg/mL (after-IVIG). The area under the ROC curve was 0.801 and 0.784, respectively, with sensitivity/specificity of 81%/68% and 81%/77%. Our NT-proBNP cut off value before-IVIG was similar to that of Young et al.25) However, our NT-proBNP cut off value after-IVIG was higher than that in other published reports. The cut off values for WBC count, % neutrophil, and CRP (mg/dL) were 10700 (×103/mm3), 45.3, and 3.8, respectively.
Our obvious choice for initial treatment was IVIG in KD patients. Hence, we believe that the after-IVIG laboratory data is more meaningful than the before-IVIG data. In addition, the mean difference and FC are more important than the raw data. In our study, of the total 91 patients, 11 (12%) required re-treatment. By univariate analysis, before-IVIG laboratory parameters of WBC count, % neutrophil, ESR, CRP, sodium, CK, CK-MB, and NT-proBNP were significantly different. After-IVIG laboratory parameters of Hb level, WBC count, % neutrophil, % lymphocytes, CRP, CK, CK-MB, and NT-proBNP were significantly different. Of the six variables (WBC, % neutrophil, CRP, CK, CK-MB, and NT-proBNP) that were significantly different in both before- and after-IVIG treatment, there was no statistically significant mean difference. FC of the six variable showed that only FC-CRP and FC-% neutrophil were of significant difference. By multivariate analysis, only FC-CRP was confirmed to be an independent predictor of initial IVIG resistance. There are limitations of this study. The number of IVIG-resistant patient was too small to represent the general IVIG-resistant population. The study was conducted retrospectively at one medical center. An expansive multicenter study is required to further determine the predictive factors for IVIG-resistant KD.
In conclusion, FC-CRP might be a useful and important value to predict responsiveness to initial IVIG treatment in KD patients. This may help the decision making of early retreatment for patients who remain febrile after initial IVIG treatment. Rapid and repeated assessment of laboratory parameters before- and after-IVIG may be useful for identifying KD patients at highest risk of CALs to guide decisions of further management.

 XML Download